Bar Pipa
We pay for a post of 10$
Lin Brings

Gold Under Siege: How New Bombings in Iran Have Cornered the Metal

Gold Under Siege: How New Bombings in Iran Have Cornered the Metal

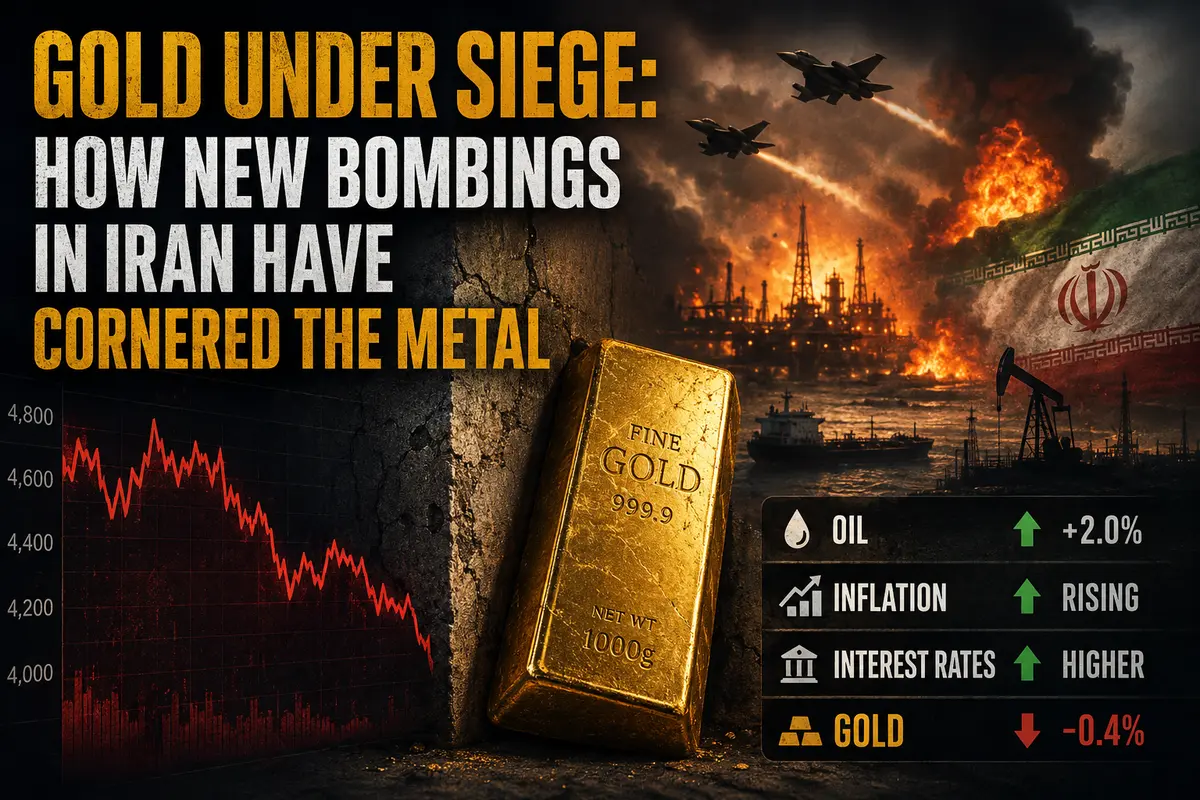
Thursday’s Asian trading session brought another wave of pain for gold. Spot prices slipped 0.4% to $4,438 per ounce, while futures followed, falling to $4,467. Silver plunged nearly 1%, and platinum lost 0.7%. Precious metals are under pressure once again, and the culprit is an old familiar force — war. Not the war itself, but its economic consequences, which the market has learned to price in with ruthless precision. New U.S. strikes on Iran — the second this week — once again triggered the chain reaction: “oil rises → inflation rises → interest rates rise → gold falls.” And as long as that chain remains intact, gold will stay trapped.

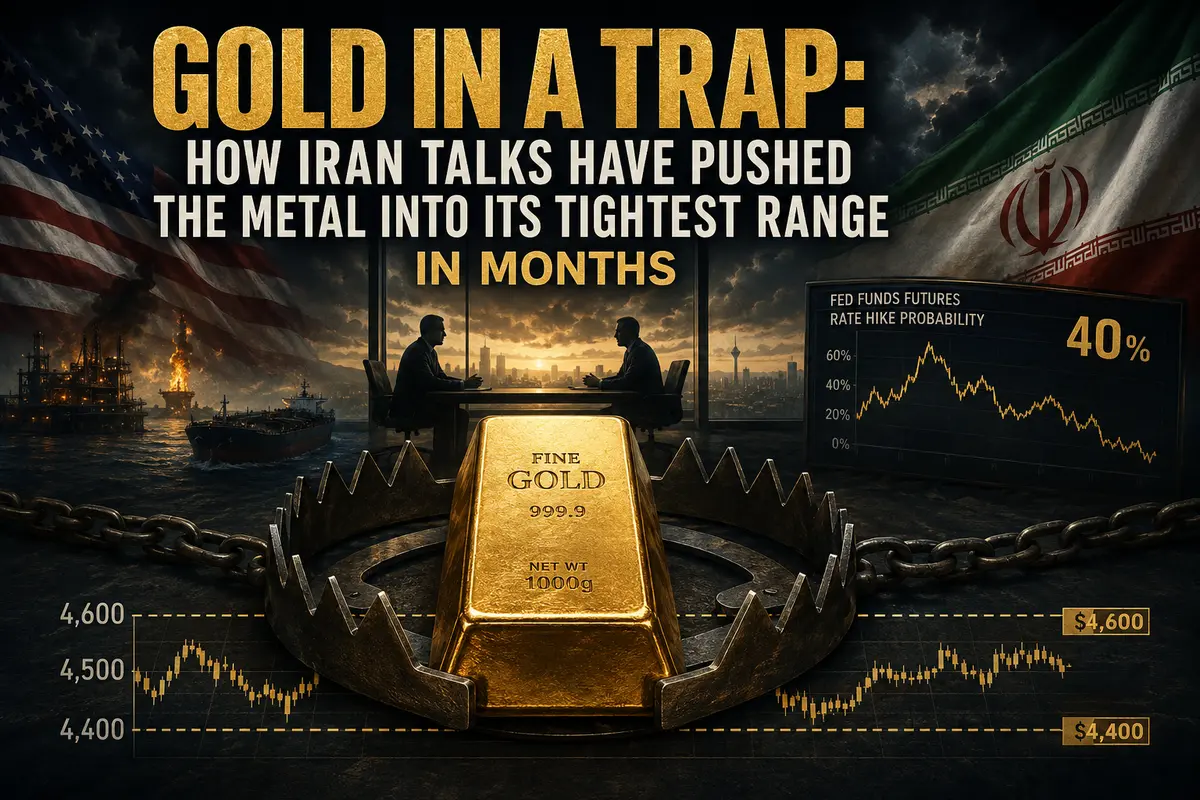
Ten Days in a Box: Gold Cannot Break the Walls

Since mid-May, spot gold has been stuck in a range between $4,400 and $4,600 per ounce. Ten days. For an asset capable of moving hundreds of dollars in a single session, that is an eternity. Gold keeps crashing into invisible walls like a fly against glass, unable to break either higher or lower.

The reason for this paralysis is both simple and painful. The market is being torn between two opposing forces. On one side, geopolitical uncertainty — war, strikes on Iran, the blocked Strait of Hormuz — should push gold higher as a safe-haven asset. On the other side, the inflationary consequences of that same war — expensive oil, rising prices, and the threat of higher rates — should push gold lower, because high interest rates make holding a non-yielding metal unattractive.

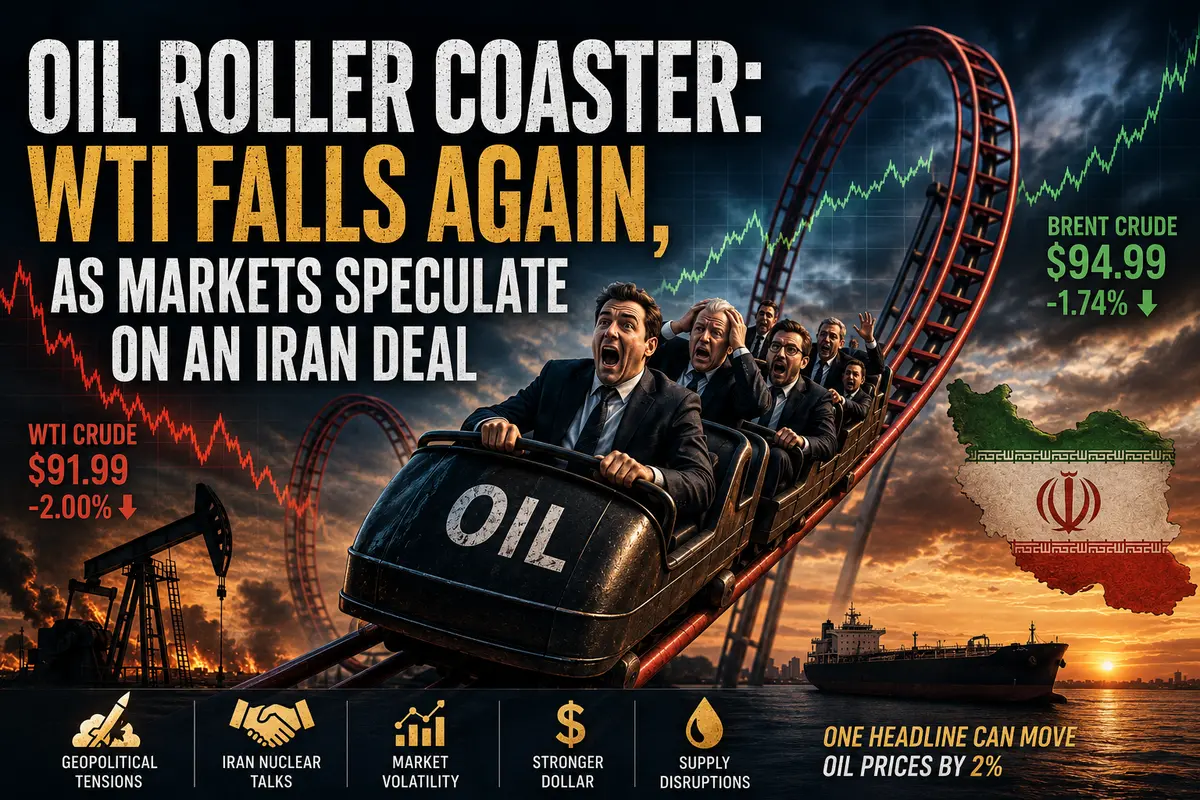
On Thursday, the second force prevailed. New U.S. strikes on Iranian targets pushed oil prices roughly 2% higher. Oil climbed again, and inflation expectations climbed with it. Rising inflation expectations strengthen the belief that the Federal Reserve will not cut rates — and may even raise them...

Continue reading...
0
0
Tom Maffin

Dollar Back in the Saddle: Strikes on Iran and Inflation Fears Push Asian Currencies Lower

Dollar Back in the Saddle: Strikes on Iran and Inflation Fears Push Asian Currencies Lower

Thursday’s Asian trading session opened with news that, while increasingly familiar in recent weeks, remains deeply unsettling. U.S. armed forces launched another round of strikes on targets in southern Iran — the second such operation in a week. Markets reacted instantly and predictably: a rush into the dollar. The U.S. dollar index edged higher, Asian currencies fell into negative territory, and oil prices surged. All of this is unfolding on the very day the Federal Reserve is set to release its preferred inflation gauge — the PCE index. Thursday is shaping up to be a volatile one.

Second Strike in a Week: Why Bombs Move Currencies

Whenever the U.S. strikes Iranian targets, currency markets tend to follow the same script. The dollar rises, while nearly every other currency weakens. This has little to do with patriotism or confidence in American military power. It is simply cold financial logic.

Conflict involving Iran threatens oil supplies. Disruptions in oil supplies drive energy prices higher. Rising energy costs fuel inflation. Higher inflation, in turn, forces the Federal Reserve to keep interest rates elevated — or even raise them further. And high interest rates make the dollar more attractive to investors searching for yield.

But on Thursday, another element was added to this familiar chain reaction. President Trump personally rejected recent reports suggesting Iran was prepared to reopen the Strait of Hormuz within thirty days. That statement dealt a blow to the fragile optimism that had supported markets over the past few days. Investors who only yesterday hoped for a near-term peace agreement are now being forced to admit that the conflict may drag on. And a prolonged conflict means prolonged inflation. Prolonged inflation means rates staying higher for longer.

Markets have largely abandoned hopes for a quick resolution, and safe-haven capital is pouring...

Continue reading...
0
0

A Magnet for Exchange Rates: Where the Option Traps Are Set This Wednesday

A Magnet for Exchange Rates: Where the Option Traps Are Set This Wednesday

Wednesday, 6 PM. For most people, it’s the hour when attention shifts from work to evening plans. But for currency traders, this moment becomes a point of maximum gravity. Options contracts worth billions of dollars are expiring, and these expiries can pull spot exchange rates toward specific levels with a force that cannot be ignored. Let’s walk through the key currency pairs and see where the traps are set today.

EUR/USD: Nearly €1 Billion at 1.1650

The main magnet for the euro today sits at 1.1650. Options worth a massive €868 million expire at this strike. The spot rate is currently 1.1645 — just five pips away. This means that in the remaining hours before expiry, market makers will do everything possible to keep the pair near this level.

The mechanics are simple: when price approaches a large strike, option holders aggressively hedge their positions, creating artificial gravity. The pair may fluctuate within a narrow range of a few pips around 1.1650, but sharp moves are unlikely.

An additional anchor lies at 1.1640, where €138 million in options expire. This is closer to the current spot price but smaller in size. Most likely, these options will expire without major market impact, though they create extra support just below current levels. If price unexpectedly drops toward 1.1640, buyers may step in and push it back toward the primary magnet zone.

USD/CAD: $328 Million at 1.3805

The largest single options pool today expires in USD/CAD. At the 1.3805 strike, $328 million is concentrated. This is not just a large expiry — it’s a true gravitational anomaly.

The spot rate is 1.3834, slightly above the strike. That suggests the pair could be pulled lower toward 1.3805, as market makers sell USD against CAD to minimize payouts.

Another level sits at 1.4095 with $128...

Continue reading...
0
0
NorthRay

Economic Calendar: Why My Trade Died After the Words “Fed Rate” (and How I Started Looking at It Differently)

Economic Calendar: Why My Trade Died After the Words “Fed Rate” (and How I Started Looking at It Differently)

Hi, this is NorthRay.🎉

Remember when I told you about the time I opened a trade, and an hour later the price suddenly shot in the opposite direction — and I had no idea why?

I sat there staring at the chart thinking:

“What just happened? Did someone drop a nuclear bomb? Has the market gone insane?”

Then I checked the news.

Turns out that exact same hour, the head of the U.S. Federal Reserve (Fed) said a couple of sentences about interest rates.
The market reacted.
My trade died.

That was the first time I heard about the economic calendar.

And I realized: opening trades blindly without knowing what news is coming out today is like walking through a minefield blindfolded.🧐

What Is an Economic Calendar? (In Simple Words)

An economic calendar is a schedule of all major economic events around the world.

When the U.S. unemployment report comes out.
When the European Central Bank announces interest rates.
When Germany publishes industrial data.
When world leaders make important agreements.

All of it is in the calendar.

Simple analogy:

Imagine you want to cross the street. You look at the traffic light.
Green — you walk.
Red — you stop.

The economic calendar is your traffic light. It tells you:

“Be careful now, an important report is coming out.”
Or:
“The market is calm right now, it’s okay to trade.”

Without a calendar, you’re crossing the street with your eyes closed.
Maybe you’ll get lucky. Maybe not.🧠

Why News Affects the Market So Much (I Learned This the Hard Way)

The market is not just a chart. It’s people. Millions of traders around the world.

They read the news.
And they make decisions.

Good economic news → people buy the country’s currency → price goes up.

Bad news → people...

Continue reading...
0
0

A Quiet Hunt for Its Own Shares: Why Futu Is Buying Back $300 Million Worth of Stock

A Quiet Hunt for Its Own Shares: Why Futu Is Buying Back $300 Million Worth of Stock

There is a gesture in corporate finance that says more about management sentiment than any press release ever could. That gesture is a share buyback. When a company spends real cash to repurchase its own stock, it is not merely returning capital to shareholders. It is telling the market: we believe our shares are undervalued. And when a company like Futu Holdings puts $290 million on the table, it deserves attention.

$290 Million as a Statement of Intent

The figure is impressive, though not record-breaking. $290 million represents roughly 2% of Futu’s current market capitalization, which stands at more than $15 billion. At first glance, 2% may not sound like much. But in the context of the buyback program announced last November, it is already a substantial tranche. The total authorization amounts to $800 million through the end of 2027. Futu has already used more than one-third of that allocation in the first year alone. The pace signals determination.

Management is not merely making declarations. It is acting. The company’s press release is dry and restrained, yet between the lines one can sense confidence: the company “may continue repurchases depending on market conditions.” No promises, no guarantees. But the mere fact that the company has already spent nearly $300 million speaks louder than words. Internally, management’s valuation of its own stock is clearly higher than the market’s.

A P/E Ratio of 10.48: Undervalued or Hiding Problems?

Futu trades at a price-to-earnings ratio of 10.48. For a technology-driven financial services company, that is a modest valuation. By comparison, American brokerage platforms such as Charles Schwab or Interactive Brokers often trade at multiples in the high teens or above twenty. Chinese technology companies have historically traded at P/E ratios of thirty or even forty. Yet here we have a multiple of barely...

Continue reading...
0
0

Silence on the Airwaves: Why Bitcoin Fell Asleep While the AI Sector Went Crazy

Silence on the Airwaves: Why Bitcoin Fell Asleep While the AI Sector Went Crazy

Nine months. That’s how long it has been since Bitcoin was last this boring. The Bitcoin Volmex implied volatility index — the market’s thermometer of excitement — has dropped to 36.11, its lowest level since last September. The price is stuck around seventy-seven thousand dollars, nearly forty percent below the all-time high above one hundred twenty-six thousand reached in October. And while traders in the worlds of equities and semiconductors are losing their minds over massive rallies, the crypto market has sunk into a lethargic sleep. This is not a crash, not a collapse, not capitulation. It is something more insidious — a slow fading of interest.

Hot Money Moved Into AI

To understand where the speculative capital went, you only need to look at the headlines of recent weeks. South Korea’s KOSPI is hitting record highs. Japan’s Nikkei is storming historical peaks. SK Hynix has just entered the trillion-dollar company club. Samsung is celebrating the resolution of its labor dispute and climbing higher as well. This entire fireworks show is happening in one sector — manufacturers of memory chips, AI accelerators, and related hardware. That is where the “hot money” has gone: into AI and semiconductor stocks, absorbing the same speculative capital that once fueled crypto rallies.

Orbit Markets co-founder Caroline Mauron puts it with brutal clarity: “Retail interest is flowing into other sectors in search of new trading opportunities, as confirmed by ETF outflows.” And the numbers do not lie. In May, around one billion dollars was withdrawn from U.S. spot Bitcoin ETFs, breaking a two-month streak of inflows. Institutional investors who had enthusiastically entered crypto through regulated products are now taking profits or cutting positions.

The logic behind this exodus is simple and ruthless. Bitcoin is trapped in a range. It cannot break resistance and move to...

Continue reading...
0
0
Tom Maffin

Silicon Storm: How Japanese and Korean Stocks Are Rewriting History While the World Watches Iran

Silicon Storm: How Japanese and Korean Stocks Are Rewriting History While the World Watches Iran

Asian markets on Wednesday looked like two parallel worlds existing within the same universe. In the first world — inhabited by memory chip makers and AI accelerator manufacturers — euphoria reigned. Japan’s Nikkei 225 surged to a new all-time high, climbing above 66,428 points. South Korea’s KOSPI delivered an even more dramatic move, soaring five percent in a single session to reach an unprecedented 8,457 points. Shares of SK Hynix jumped nearly fourteen percent, pushing the company’s market capitalization above one trillion dollars for the first time in history.

In the second world — the world of geopolitics, oil prices, and Middle Eastern negotiations — anxiety dominated. Brent crude hovered around ninety-nine dollars a barrel, Chinese indices declined, and investors nervously scanned the horizon for an answer to a single question: would there be peace with Iran, or more bombing campaigns ahead?

SK Hynix: Crossing the Trillion-Dollar Threshold

There are moments in corporate history that divide eras. For SK Hynix, Wednesday became such a moment. A near fourteen-percent rally in a single session pushed the company’s market capitalization beyond the psychological trillion-dollar mark.

This is more than just a symbolic number. It is an entry ticket into an exclusive club where only two other memory manufacturers reside alongside SK Hynix: Samsung Electronics and Micron Technology. Three companies, three pillars supporting the global memory industry.

The reason behind the rally is both simple and monumental. The world is entering an era in which artificial intelligence requires enormous volumes of high-speed memory. Every new data center, every large language model, every Nvidia accelerator devours gigabytes and terabytes of HBM memory — a segment where SK Hynix holds a leading position.

And as technology giants like Google and Amazon announce fresh investments in AI infrastructure, the Korean memory maker can calmly count its...

Continue reading...
0
0

Vietnam Beachhead: Why Samsung Is Building a $1.5 Billion Factory

Vietnam Beachhead: Why Samsung Is Building a $1.5 Billion Factory

There is a certain irony in the fact that, at the height of a geopolitical crisis — while the world watches Iranian negotiations and anxiously awaits U.S. inflation data — Samsung is calmly and methodically laying the foundation for a new factory in Vietnam. No panic, no loud statements — just dust on a construction site in Thailand’s Thai Nguyen province and two hundred engineers who, since April, have been preparing the ground for another technological leap.

The investment totals 39 trillion Vietnamese dong, or roughly $1.5 billion. It will become Samsung’s first semiconductor testing plant ever built on Vietnamese soil. And its emergence says far more about the global restructuring of the chip industry than all the headlines about trade wars combined.

Traditional Chips: The Invisible Heroes of the Digital Age

When people talk about semiconductor shortages, they usually picture cutting-edge AI processors, high-performance HBM memory, and Nvidia accelerators. But reality is more complicated. Samsung’s new facility will focus on what industry insiders call “legacy” chips — mature, traditional technologies.

These are the previous generations of DRAM and NAND memory chips that never make headlines, yet without them no car starts, no router powers on, and no washing machine runs.

The paradox is that these chips are currently in severe shortage. While Samsung, SK Hynix, and Micron chase massive profits from supplying memory for AI data centers, traditional customers — smartphone makers, laptop manufacturers, and automakers — are left empty-handed. Manufacturing capacity is no longer enough for everyone.

Samsung’s new plant is an attempt to fill that gap. The facility is designed for annual output of 153 billion gigabits of DRAM and 255 billion gigabits of NAND — figures staggering even to veteran semiconductor engineers.

Why Vietnam — Not China, Korea, or the United States

The answer to “why...

Continue reading...
0
0
Lin Brings

Oil Roller Coaster: WTI Falls Again as Markets Speculate on an Iran Deal

Oil Roller Coaster: WTI Falls Again as Markets Speculate on an Iran Deal

Wednesday’s Asian oil trading session opened in negative territory. July WTI futures dropped by as much as two percent, falling to $91.99 per barrel. Brent followed the U.S. benchmark lower, declining 1.74% to $94.99. After several days of nervous swings between fear and hope, the market appears ready to believe in a positive outcome again — at least for the duration of one Asian session. Yet this decline, much like the previous rally, lacks conviction. It resembles another turn on a roller coaster where every rise is followed by a drop, and every drop by another rise. And one man seems to be operating the ride — Donald Trump, whose statements about negotiations with Iran continue to keep oil traders in a state of permanent uncertainty.

Two Percent Down: Why Oil Is Falling Today

A two-percent drop in WTI during a single session is a move worth noticing. But to understand it, context matters. The day before, oil prices climbed on reports of U.S. strikes in southern Iran, which undermined hopes for a quick peace agreement. Today prices are falling. Why? Because despite the strikes, negotiations are still ongoing. Diplomats remain at the table. Trump says progress is being made. Iranian officials, while denying that a deal is close, have not walked away from talks. And the market, which panicked over bombs on Monday, is slowly regaining faith in diplomacy on Tuesday and Wednesday.

This is largely a psychological move. Fundamentally, nothing has changed. The Strait of Hormuz remains partially closed to normal shipping. Oil supplies from the region are still disrupted. Freight insurance premiums remain elevated. But the market is tired of being afraid. Traders are looking for any excuse to justify profit-taking after the previous rally, and continued negotiations provide exactly that excuse.

It is also important that...

Continue reading...
0
0

Gold in a Trap: How Iran Talks Have Pushed the Metal Into Its Tightest Range in Months

Gold in a Trap: How Iran Talks Have Pushed the Metal Into Its Tightest Range in Months

Ten days. Ten long days that spot gold has been unable to break out of the range between $4,400 and $4,600 per ounce. For an asset accustomed to swinging hundreds of dollars in a single session, this is an agonizingly narrow corridor. Gold is stuck as if trapped in a vise, with neither bulls nor bears able to move it from dead center.

On Wednesday morning, spot prices edged up a symbolic 0.2% to $4,518. Futures added 0.3%, reaching $4,550. The move is so modest it almost feels embarrassing to call it a rally. Yet beneath this apparent stillness lies a fierce battle between two opposing forces, each pulling gold in its own direction. And the name of those forces is Iran.

Negotiations That Suffocate and Save at the Same Time

The main reason gold cannot decide on a direction is the stream of contradictory signals coming from the peace negotiations between the United States and Iran.

On Monday, U.S. forces struck targets in southern Iran. Gold, as expected, fell. Why did it fall instead of rise? Because the logic of the current conflict has turned traditional market relationships upside down.

Normally, war is fuel for gold. Investors flee risk, buy safe-haven assets, and the yellow metal rises. But this war is different. It has created an energy crisis that accelerated inflation. Inflation, in turn, has forced central banks to threaten higher interest rates. And the threat of higher rates is deadly poison for gold, which yields no interest income.

That is why the bombing of Iran is not pushing gold higher — it is dragging it lower instead. The market fears not the war itself, but its monetary consequences.

At the same time, however, negotiations continue. Diplomats remain at the table, discussing terms and exchanging draft agreements. Every headline...

Continue reading...
0
0
Navigation menu
instaforex banner