Bar Pipa
We pay for a post of 10$

Others

joy

Auction Mechanics — Open/Close Crosses and Volatility Halts
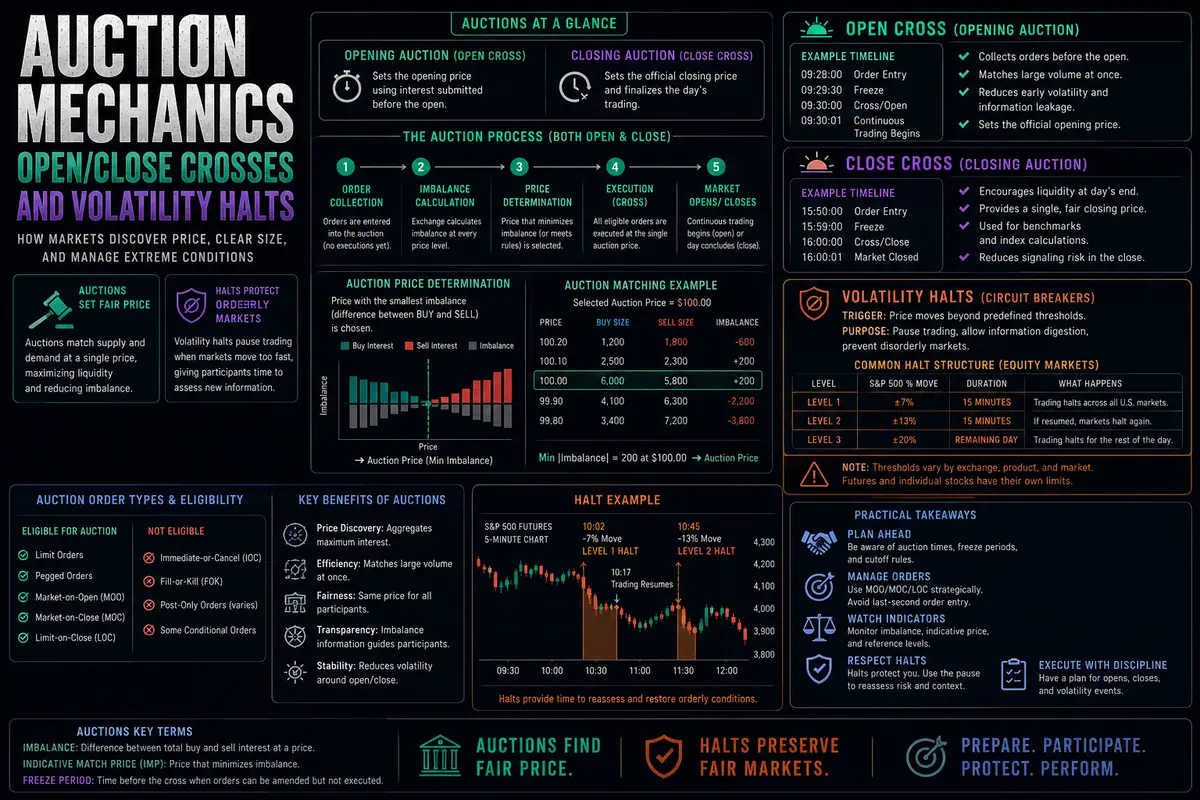
Auction Mechanics — Open/Close Crosses and Volatility Halts

Financial markets do not operate as a continuous, uninterrupted stream of uniform activity. Instead, they function through distinct auction phases that transition from periods of intense price discovery to formal market closures and back again. Understanding the auction mechanics that govern market opens, market closes, and regulatory volatility halts is essential for any trader seeking to avoid the severe execution traps that occur during these transition windows.

Unlike standard intraday trading where liquidity is continuously matched across the order book, auction mechanics rely on centralized call auctions designed to aggregate unexecuted orders and determine a single, fair clearing price for the entire market.

The Opening Cross: Price Discovery and Overnight Accumulation

The transition from the overnight closed market to the official cash session open is managed through an opening auction, frequently referred to as the Open Cross.

Throughout the overnight session, news releases, geopolitical developments, and macroeconomic data accumulate. Institutional and retail participants submit orders that sit in the limit order book as unexecuted instructions. During the pre-market phase, these orders are accumulated without executing immediately. The exchange matching engine constantly calculates an indicative clearing price—the exact price level where the maximum volume of buy and sell orders can be matched simultaneously.

As the official open approaches, trading desks flood the system with market-on-open (MOO) and limit-on-open (LOO) orders. This massive influx of accumulated liquidity creates a volatile supply and demand imbalance. When the opening bell rings, the matching engine executes all eligible orders at a single opening price.

For active traders, attempting to trade the immediate open is hazardous. The opening cross often produces aggressive price spikes that immediately reverse once the initial backlog of overnight orders is cleared. Waiting for the initial opening range to establish—typically the first fifteen to thirty minutes of the session—allows the market to...


Continue reading...
0
0
Big Pip

Updated Article Guidelines: How to Write High-Quality Content and Get Paid

Updated Article Guidelines: How to Write High-Quality Content and Get Paid

Hello everyone!

Recently, we have encountered a large influx of low-quality materials that, unfortunately, resemble spam more than useful content. We value our audience and want the platform to remain a source of expert and valuable information.

Because of this, we have decided to update and tighten the quality requirements for articles that are eligible for monetization.

Please read the new rules carefully.

8 Mandatory Rules for Content Monetization

  • 1. Mandatory Thematic Cover Image Every article must be accompanied by a main image (cover) that reflects the essence of the material. You can easily generate one using AI tools.

  • 2. AI Content Limit: No More Than 20% We pay for your thoughts and your expertise, not the work of algorithms. The acceptable threshold for AI-generated content has been lowered. Be sure to run your text through AI detectors (such as ZeroGPT) — the generated text must not exceed 20%.

  • 3. Content Depth (Minimum 4,500 Characters) Short notes are no longer eligible for monetization. The minimum length for a high-quality analytical or informational article is now 4,500 characters (excluding spaces).

  • 4. Clear Structure (H2 and H3 Headings) A solid "wall of text" is unreadable. Using H2 and H3 subheadings to logically divide content blocks is now a strict requirement.

  • 5. Visuals Within the Text In addition to the main cover, the body of the article must contain at least one additional image that visually breaks up the text and matches the context.

  • 6. Integration of Financial Tickers If your material mentions stocks, cryptocurrencies, or specific companies, you must use the built-in ticker tagging feature using the $ symbol. This helps readers quickly navigate to the charts of the requested asset. Example: EURUSD ...

  • 7. Evidence for Technical Analysis Any reasoning regarding price movements, trends, or patterns must absolutely...

Continue reading...
0
0
Big Pip

Understanding IFRS: A Global Framework for Financial Reporting

Understanding IFRS: A Global Framework for Financial Reporting

International Financial Reporting Standards (IFRS) represent a comprehensive set of accounting standards and rules developed by the International Accounting Standards Board (IASB). Their primary purpose is to regulate the preparation and presentation of corporate financial statements on a global scale.

At their core, IFRS serve as a universally recognized language for financial reporting. They dictate stringent requirements for how companies must report essential financial metrics, including statements of comprehensive income, balance sheets involving current assets and liabilities, cash flows, and various other critical aspects of accounting. By establishing a unified methodology, IFRS ensures that financial data is legible, regardless of the geographic location of the business.

The Global Landscape of IFRS Adoption

The application of IFRS is mandatory for a vast number of jurisdictions worldwide. For instance, all publicly traded companies in the European Union are required to use IFRS, a mandate stemming from the EU’s commitment to the IFRS Foundation and its goal of fostering a unified capital market.

Beyond the EU, countries like Canada, Australia, and South Africa have fully integrated IFRS into their national reporting frameworks, while others, such as Japan, allow multinational corporations to voluntarily adopt these standards. Even in the United States, which primarily utilizes US GAAP (Generally Accepted Accounting Principles), there is an ongoing, albeit slow, convergence project with the IASB to harmonize standards. This widespread adoption underscores IFRS's role as the definitive global benchmark for corporate financial transparency.

The Core Objectives of IFRS

The design and implementation of IFRS are driven by several overarching goals aimed at streamlining the global economy.

1. Ensuring Global Comparability

IFRS establishes universally recognized financial reporting standards that allow analysts, investors, and regulators to compare the financial performance and market position of different companies across international borders. For example, an international investor can directly compare the profitability of...

Continue reading...
0
0

A Lifeline for a British Legend: Aston Martin Raises $736 Million and Restores Market Confidence

A Lifeline for a British Legend: Aston Martin Raises $736 Million and Restores Market Confidence

A Morning of Hope: Shares Surge 7.7%

When Aston Martin AMGDF ... Global Holdings announced on Wednesday that it had secured £550 million in new debt financing—equivalent to nearly $736 million—the market reacted immediately. Shares of the British luxury car manufacturer surged 7.7%, and the increase was more than a brief speculative spike. It was a much-needed vote of confidence in a company that has struggled to reassure investors in recent years.

Investors who had long watched Aston Martin’s financial difficulties with concern could finally breathe a sigh of relief. The transaction, led by funds managed by HPS Investment Partners, which is owned by asset-management giant BlackRock, includes several components: a £450 million term loan, a £100 million delayed-draw facility, and an additional permitted debt capacity of £100 million.

This is more than just an injection of cash. It is a structured financing package that gives the company room to maneuver and time to regroup.

For Aston Martin, which has endured a difficult period, the deal represents a genuine lifeline. The company, renowned for its elegant sports cars and its long-standing association with James Bond, has spent the past several years balancing ambitious electrification plans against a chronic shortage of capital.

Now that its immediate financing needs have been at least partially addressed, Aston Martin has an opportunity to breathe more freely and refocus on what it does best: creating dream cars.

Financial Restructuring: What Lies Behind the Deal

To understand the full significance of the transaction, it is necessary to examine Aston Martin’s financial position. The company has long been burdened by debt that dragged on its performance like a set of concrete blocks. Legacy obligations, high interest costs, and declining sales created a vicious cycle from which there appeared to be no clear escape.

Investors demanded stronger results, but...

Continue reading...
0
0

Airdrop #1 DPLQ Deep Liquidity – Valid Until August 31

Airdrop #1 DPLQ Deep Liquidity – Valid Until August 31

Dear Community, we are glad to welcome you!

The Deep Liquidity (DPLQ) ecosystem continues to actively develop, and today we are announcing the launch of a large-scale reward campaign for our authors and supporters. If you follow the growth of our deflationary asset and want to become part of the DPLQ economy with zero initial investment, this is your chance.

We are launching Airdrop #1 DPLQ, which will run until August 31. Below is a detailed step-by-step guide on how to participate and start earning.

How the DPLQ Airdrop #1 Works

As part of this campaign, we reward you for creating high-quality content. For every written and published article on the pip.bar platform, you will receive a reward of $1 (paid out in DPLQ tokens).

Key Benefits & Conditions

  • No Limits: Payout amounts are unlimited. Write 10 high-quality articles, receive the equivalent of $10 in DPLQ tokens.

  • Daily Payouts: Token distribution is conducted once a day to all authors whose articles pass verification.

  • Full Freedom of Action: You can sell your received tokens on a decentralized exchange (PancakeSwap) immediately after they arrive in your wallet. There are no locking or vesting periods.

  • Quality Control: Articles must comply with the internal rules of the pip.bar platform and writing guidelines. Spam and low-quality content will not be rewarded.

How to Write High-Quality Informational Articles and Get Paid for Them

Step-by-Step Guide: How to Get Your Tokens

To make the process as clear and transparent as possible, we have broken it down into a few simple steps.

Step 1: Write and Publish an Article

Head over to the pip.bar platform, create an interesting, well-written, and helpful article. Make sure the text meets all the platform's requirements. Once your article is published, move on to the next step.

Step...

Continue reading...
0
0
GFATHER

Mastering Market Structure: The Universal Map Every Trader Needs

Mastering Market Structure: The Universal Map Every Trader Needs

Mastering Market Structure: The Universal Map Every Trader Needs

Every market leaves footprints. It doesn’t matter if you’re looking at a 5-minute crypto chart, tracking Apple stock on the daily, or scanning EURUSD ... during the London open. Price leaves clues everywhere.

The problem? Most traders waste years chasing lagging indicators. They tweak RSI settings, test double moving average crossovers, or wait for Stochastic lines to magically solve the market. It doesn't work. Indicators only summarize what already happened. If you want to know where price is actually heading, you have to read the core engine of price itself: market structure.

Understanding the Core Blueprint

Strip away the indicators, and the market becomes surprisingly simple. Price moves in natural cycles of expansion, contraction, and consolidation. It’s just an endless tug-of-war between buyers and sellers fighting over liquidity.

Across every asset class and timeframe, you’ll see the market rotate through three main states:

  • Uptrends: Price makes higher highs and higher lows. Buyers clearly hold the steering wheel, and dips get bought quickly.

  • Downtrends: Price makes lower highs and lower lows. Sellers dominate the room, breaking support levels while buyers fail to defend pullbacks.

  • Ranges: Price bounces back and forth between obvious floor and ceiling levels. Neither side has control, creating a messy chop where orders pile up on both sides.

If you can identify which state the market is in right now, you instantly avoid the biggest mistake in trading: trying to buy a crashing market or shorting a moonshot.

Identifying the Shift: BOS vs. CHOCH

Once you spot the overall trend, you need to know when it’s healthy and when it’s about to fall apart. This comes down to two key price events.

First, there’s the Break of Structure (BOS). When a market is trending up and punches cleanly past...

Continue reading...
0
0
pixel

Most Trading Problems Aren’t Strategy Problems

Most Trading Problems Aren’t Strategy Problems
A large number of traders spend years chasing the perfect setup, the ultimate indicator combination, or a more sophisticated risk model. They believe that if they just refine their edge a little more, consistency will finally arrive. In reality, the strategy is rarely what keeps them from making money. The real damage almost always comes from somewhere else. Most large account drawdowns do not begin with a flawed system. They begin after a completely ordinary losing trade that was taken according to the plan. The stop is hit, the loss is recorded, and then the emotional machinery starts running. Frustration appears. The mind starts telling a story that the market “owes” a recovery. The next trade is taken outside the rules. Position size quietly increases. Patience disappears. By the end of the session the trader is no longer executing an edge—he is trying to erase a number on the screen. That single shift—from following a process to chasing recovery—is responsible for more blown accounts than any particular technical setup ever invented.

The Emotional Spiral After a Normal Loss

A planned loss is simply the cost of doing business. Every robust edge produces them. The problem begins when the trader treats that cost as a personal insult or as evidence that something is broken. Once that interpretation takes hold, several predictable behaviors usually follow:
  • The next trade is entered too quickly, often without waiting for the next clean signal.
  • Stops are widened or removed because “this one has to work.”
  • Size is increased in an attempt to make back the earlier loss in fewer trades.
  • Additional setups that would normally be ignored are suddenly taken because “the market is offering a second chance.”
None of these actions are strategic. They are emotional reactions dressed up as trading decisions. Over the course...
Continue reading...
0
0

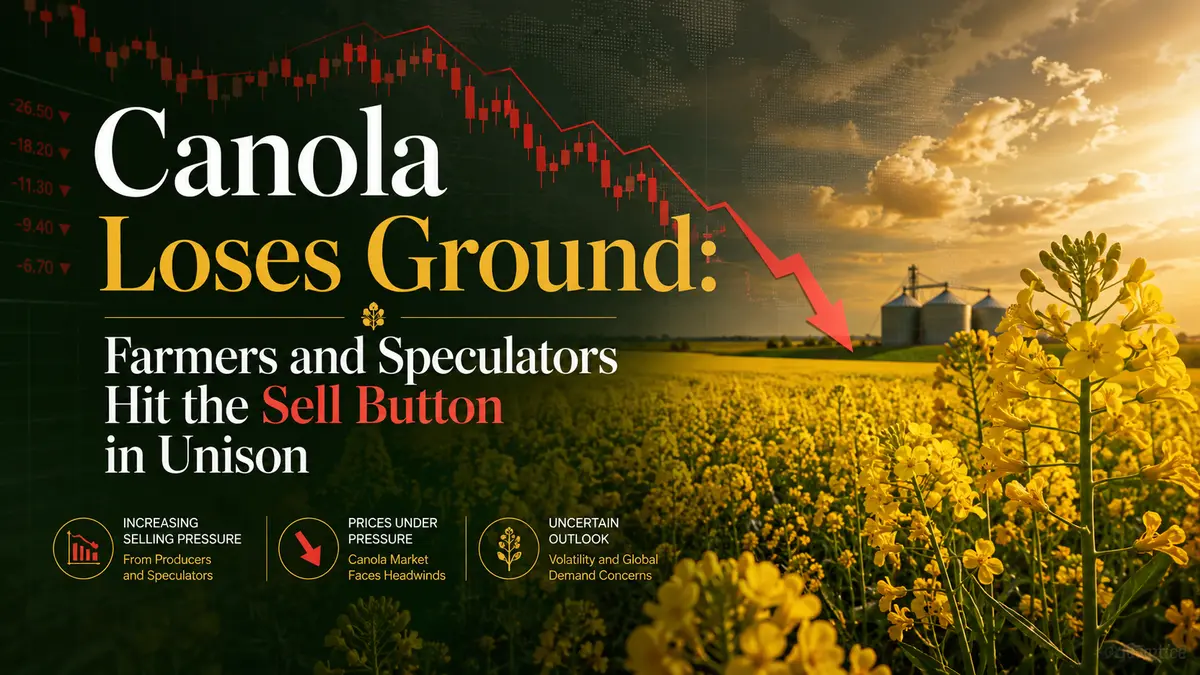
Canola Loses Ground: Farmers and Speculators Hit the Sell Button in Unison

Canola Loses Ground: Farmers and Speculators Hit the Sell Button in Unison

When Prices Touch the Sky, Hands Naturally Reach for the “Sell” Button

Tuesday 22.07.2026 brought a sobering turn to the canola market, which had been surging nervously higher over the past several weeks. Canola futures traded on the ICE exchange plunged, and the decline was neither a technical glitch nor a random accident. It was deliberate, calculated, and even ruthless. November contracts lost C$7 in a single session, falling to C$803.20 per metric ton. For those who do not follow this market closely, let us put it plainly: this was a serious blow.

Why did it happen? The answer is obvious: the market simply grew tired of rising. That may sound simplistic, but this seemingly ordinary explanation contains a profound piece of market wisdom. Canola prices had recently been setting one record after another, reaching contract highs that few had expected only a couple of months ago. Whenever an asset soars toward the sky, there eventually comes a moment when even the most committed bulls begin to wonder: “Have we climbed too high?”

That was when two powerful forces entered the market and began putting simultaneous pressure on prices. On one side, professional speculators and hedge funds that had been holding long positions and profiting from the rally decided it was time to lock in their gains. On the other side, farmers—the same people in overalls and muddy boots who actually grew the crop—also woke up and realized that a price of C$800 per ton was an excellent opportunity to sell their production rather than continue guessing what tomorrow might bring.

This double blow from both speculators and producers is a rare situation in which the interests of two completely different groups of market participants align. Usually, they regard one another with suspicion. Farmers dislike traders for creating volatility, while...

Continue reading...
0
0
pixel

The Blueprint to Consistent Capital Growth: Mastering Simplicity and Trading Psychology

The Blueprint to Consistent Capital Growth: Mastering Simplicity and Trading Psychology

Trading is often misconstrued as a game of highly complex algorithms and predictive superpowers. However, when you observe professional traders pulling apart the strategies of developing traders, a glaring truth emerges: beginners overcomplicate their charts, while professionals ruthlessly simplify theirs.

If your goal is to systematically grow your capital over a standard 20-day trading cycle, the secret does not lie in adding more indicators to your MetaTrader 5 interface. It lies in refining your trading psychology, aligning yourself with the higher timeframes, and executing a singular, masterfully understood edge. Here is the professional blueprint for tearing down a flawed trading model and rebuilding it for consistent profitability.

The Trap of Over-Complication

The most common hurdle for traders who understand the mechanics of the market but struggle to build their account balance is over-complication. More data does not equal more profit; it often results in analysis paralysis.

Confluences as a Coping Mechanism

Many developing traders stack confluences on top of each other — waiting for a liquidity sweep, an internal market structure shift, a 79% Fibonacci retracement, and a fair value gap all to align perfectly on the 1-minute chart. While this sounds incredibly precise, professionals recognize this behavior as a psychological coping mechanism.

By demanding a flawless setup, you are inadvertently protecting yourself from taking the trade and facing a potential loss. This extreme strictness drops your trade frequency to near zero. You end up missing the most explosive, high-probability moves because price simply tapped a 15-minute gap and ran without giving you that deep 79% pullback. Trading is an exercise in managing probabilities, not demanding perfection.

The Strategy Hopping Syndrome

Running two entirely different strategies concurrently — such as an EMA crossover model alongside a Smart Money Concepts (SMC) liquidity model — guarantees that you master neither. Conflicting signals...

Continue reading...
0
0
Big Pip

Understanding Financial Reporting: The Global Language of Business

Financial reporting is the cornerstone of modern global commerce. At its core, a financial report is a comprehensive document — or a series of documents — that contains detailed information about a company's financial position and its operational results over a specific period. However, in the context of the global economy, it is much more than just a regulatory requirement. It is the universal language that businesses use to communicate their health, viability, and strategic direction to stakeholders across the world.

Whether it is a tech giant in Silicon Valley, a massive automotive manufacturer in Japan, or a rapidly growing e-commerce platform in Latin America, all businesses rely on standardized financial reporting. This standardization, often guided by International Financial Reporting Standards (IFRS) or Generally Accepted Accounting Principles (GAAP), ensures that investors and regulators anywhere in the world can understand a company's financial narrative.

Core Components of Financial Statements

A complete set of financial statements provides a multidimensional view of a company's economic reality. It consists of several primary components, each serving a distinct and critical purpose.

The Balance Sheet: A Snapshot of Financial Health

The balance sheet represents the financial position of a company at one specific moment in time — often the last day of the fiscal year or quarter. It is built on the fundamental accounting equation: Assets = Liabilities + Shareholders' Equity.

  • Assets: These are the resources owned by the company that hold economic value. This includes highly liquid assets like cash and cash equivalents, as well as tangible assets like real estate, factories, and heavy machinery. For a global technology corporation, assets might also include massive intellectual property portfolios, patents, and global data centers.

  • Liabilities: This represents what the company owes to external parties. It encompasses short-term obligations like payroll and accounts payable to suppliers,...

Continue reading...
0
0
Navigation menu
instaforex banner