Bar Pipa
We pay for a post of 10$

Traders

Teaching you about forex spread, with basic English.
Teaching you about forex spread, with basic English.

Understanding Spread in Forex Trading

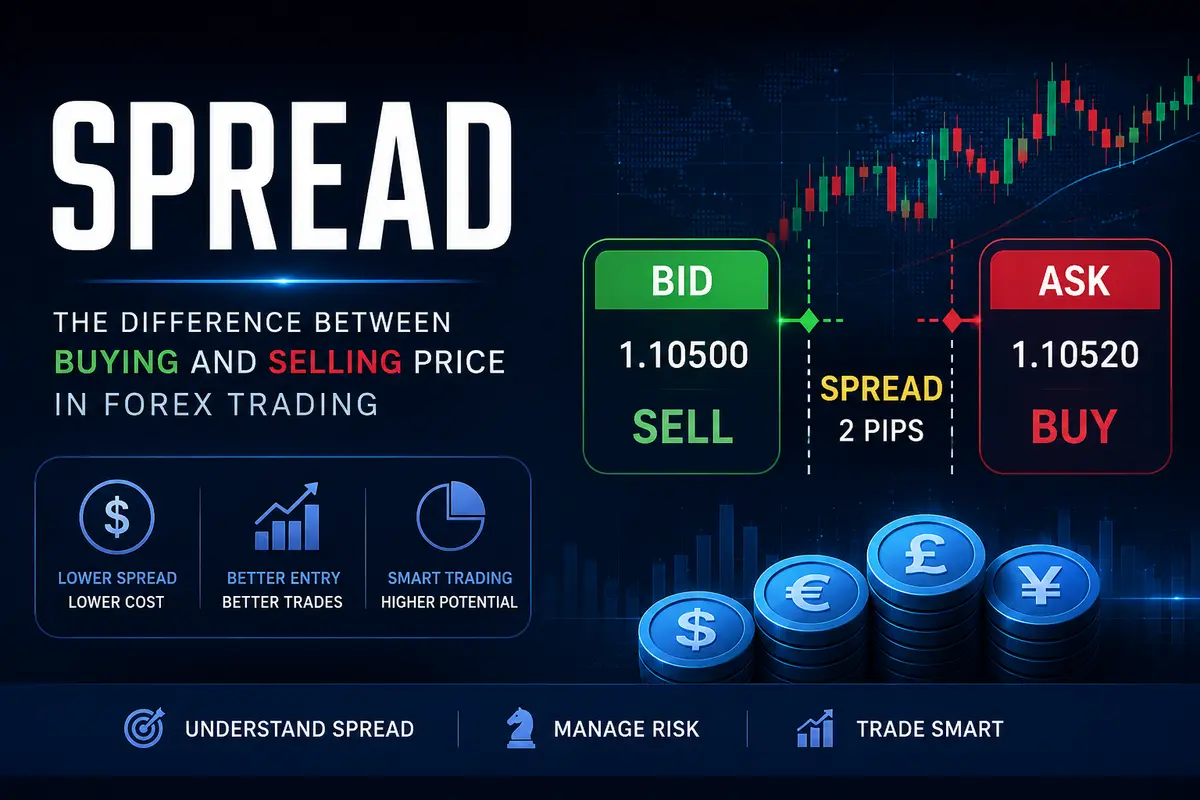
Spread is one of the most important concepts every forex trader should understand. It is the difference between the buying price (Ask price) and the selling price (Bid price) of a currency pair. In simple terms, spread is the cost a trader pays to enter a trade.

For example, if EUR/USD has a Bid price of 1.1700 and an Ask price of 1.1702, the difference is 0.0002, which equals 2 pips. This means the spread is 2 pips.

The Bid price is the price at which the market or broker is willing to buy a currency pair from you, while the Ask price is the price at which you can buy the currency pair. Since the Ask price is always higher than the Bid price, there is always a small gap between the two prices, and this gap is called the spread.

Spreads are very important because they directly affect trading costs. A lower spread means traders pay less to open positions, while a higher spread increases the cost of trading. This is why many traders prefer brokers that offer low spreads, especially scalpers and day traders who open many trades each day.

There are two main types of spreads in forex trading: fixed spreads and variable spreads. Fixed spreads remain the same regardless of market conditions, while variable spreads change depending on market volatility and liquidity. During major economic news releases or periods of low market activity, variable spreads can widen significantly.

Several factors influence spread in the forex market. One factor is liquidity. Popular currency pairs such as EUR/USD, GBP/USD, and USD/JPY usually have lower spreads because they are traded in large volumes. Less popular pairs, known as exotic pairs, often have wider spreads.

Market volatility is another factor. When important economic events...

Continue reading...
0
0
Tom Maffin

Corn Futures Fell From a One-Month High

Corn Futures Fell From a One-Month High

Introduction: The Wednesday When the Grain Rally Ended

Wednesday, Chicago Board of Trade. Traders who were watching corn prices climb to one-month highs in the morning were forced to acknowledge a reversal by the end of the session. The September contract closed down 8-3/4 cents at $4.35 per bushel, after reaching $4.44-3/4 during the session. The December contract ended trading down 8 cents at $4.56-1/4 per bushel, retreating from $4.65-3/4, its highest level since June 3.

What happened? The corn market experienced a classic reversal: first, a rally driven by expectations of weather risks, followed by profit-taking and a correction. Traders who had bought at lower levels decided to lock in gains, creating pressure on prices.

But the weather — or more precisely, its improvement — became the main factor behind the decline. New forecasts reduced the expected intensity of heat in the U.S. Midwest in mid-July. This eased concerns about heat stress for corn crops during the pollination period. Less heat means lower crop risks, and lower crop risks mean lower prices.

The strengthening dollar also weighed on grain futures, reducing the competitiveness of U.S. grain on global markets. When the dollar rises, American corn becomes more expensive for foreign buyers, which reduces demand and puts pressure on prices.

Grain futures on the Chicago Board of Trade reacted weakly to an approximately 5% rise in oil futures, which followed a statement by U.S. President Donald Trump that an interim deal to settle the war with Iran had been “completed.” The corn market appears to be more concerned about weather and the dollar than Middle East geopolitics.

The U.S. Energy Information Administration reported that corn-based ethanol production for the week ended July 3 totaled 1.093 million barrels per day, down 24,000 barrels per day from the previous week. U.S. ethanol...

Continue reading...
0
0
NorthRay

Fundamental Analysis: Why I Stopped Looking Only at Charts and Started Reading News About Farmers and Interest Rates

Fundamental Analysis: Why I Stopped Looking Only at Charts and Started Reading News About Farmers and Interest Rates

Hi, this is NorthRay.💥

For a long time, I thought: “Technical analysis is enough. The chart reflects everything. Why should I bother with reports, GDP figures, and interest rates?”

I drew support and resistance levels, watched the stochastic oscillator, and opened trades.

And often, technical analysis would tell me “buy.” The price would move up at first, then suddenly reverse and crash lower. No apparent reason. No warning.

I’d sit there thinking:

“What went wrong? The level was solid...”

Then I started reading the news.

It turned out that inflation data had been released in the U.S. that day. Or the Federal Reserve Chair had made comments about interest rates. Or Europe was dealing with a crisis.

My technical analysis wasn’t wrong. It simply didn’t know what the market already knew.

That’s when I realized: the chart is the result. The cause lies in fundamentals.

So I started studying fundamental analysis.💬

What Is Fundamental Analysis? (In Simple Terms)

If technical analysis focuses on the chart itself (candlesticks, levels, indicators), fundamental analysis focuses on what’s behind the chart.

A country's economy. Central bank actions. Politics. Natural disasters. Wars. Elections.

Everything that can affect the supply and demand of currencies, stocks, or commodities.

A simple example:

Imagine you want to buy an apartment in a city.

Technical analysis looks at housing prices over the past year and says:

"Prices usually rise in spring and fall in autumn. It's spring now, so prices will probably go up."

Fundamental analysis looks at the city itself:

  • Is a new factory being built? (More people move in → prices rise.)

  • Is a major employer shutting down? (People move away → prices fall.)

  • Are mortgage rates being lowered? (Housing becomes more affordable → prices rise.)

Technical analysis is about history and recurring patterns.

Fundamental analysis is about...

Continue reading...
0
0
Rose Gramit

Gold in a Trap: How Iran Talks Have Pushed the Metal Into Its Tightest Range in Months

Gold in a Trap: How Iran Talks Have Pushed the Metal Into Its Tightest Range in Months

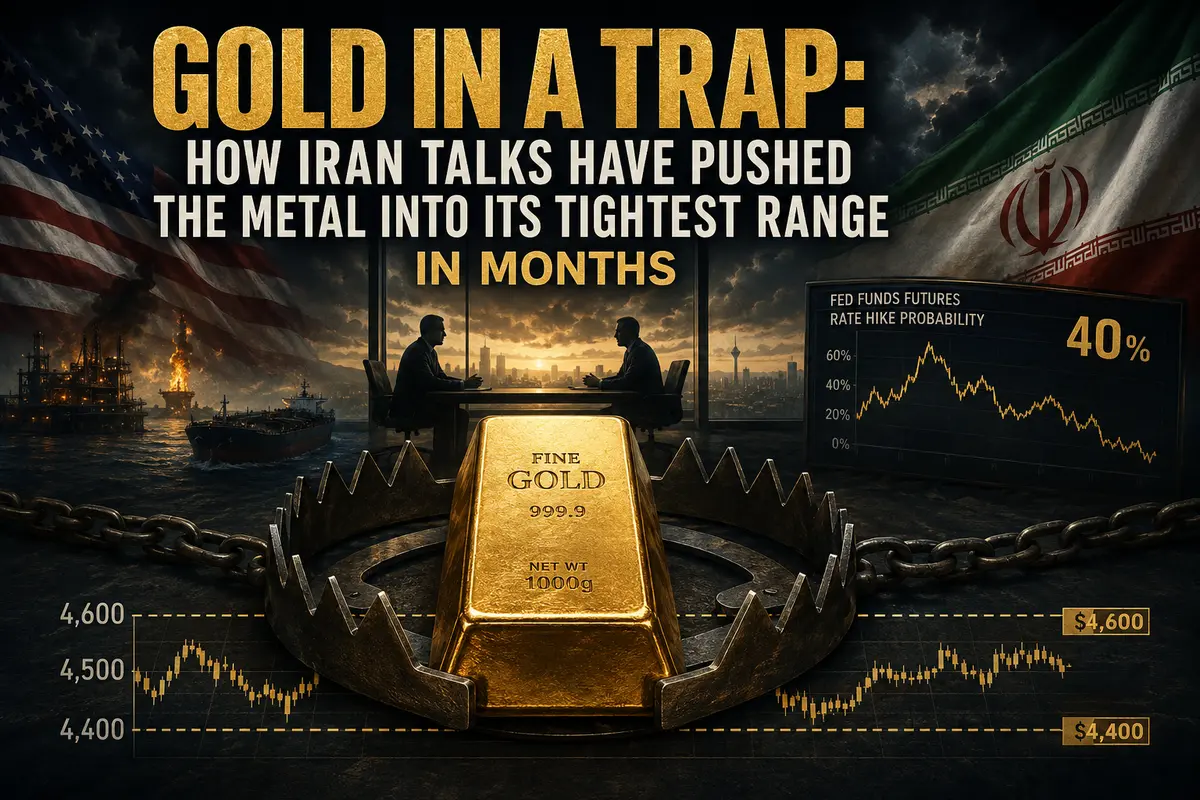
Ten days. Ten long days that spot gold has been unable to break out of the range between $4,400 and $4,600 per ounce. For an asset accustomed to swinging hundreds of dollars in a single session, this is an agonizingly narrow corridor. Gold is stuck as if trapped in a vise, with neither bulls nor bears able to move it from dead center.

On Wednesday morning, spot prices edged up a symbolic 0.2% to $4,518. Futures added 0.3%, reaching $4,550. The move is so modest it almost feels embarrassing to call it a rally. Yet beneath this apparent stillness lies a fierce battle between two opposing forces, each pulling gold in its own direction. And the name of those forces is Iran.

Negotiations That Suffocate and Save at the Same Time

The main reason gold cannot decide on a direction is the stream of contradictory signals coming from the peace negotiations between the United States and Iran.

On Monday, U.S. forces struck targets in southern Iran. Gold, as expected, fell. Why did it fall instead of rise? Because the logic of the current conflict has turned traditional market relationships upside down.

Normally, war is fuel for gold. Investors flee risk, buy safe-haven assets, and the yellow metal rises. But this war is different. It has created an energy crisis that accelerated inflation. Inflation, in turn, has forced central banks to threaten higher interest rates. And the threat of higher rates is deadly poison for gold, which yields no interest income.

That is why the bombing of Iran is not pushing gold higher — it is dragging it lower instead. The market fears not the war itself, but its monetary consequences.

At the same time, however, negotiations continue. Diplomats remain at the table, discussing terms and exchanging draft agreements. Every headline...

Continue reading...
0
0
Tom Maffin

Seventy-Seven Thousand: The Psychological Threshold Is Gone

Seventy-Seven Thousand: The Psychological Threshold Is Gone

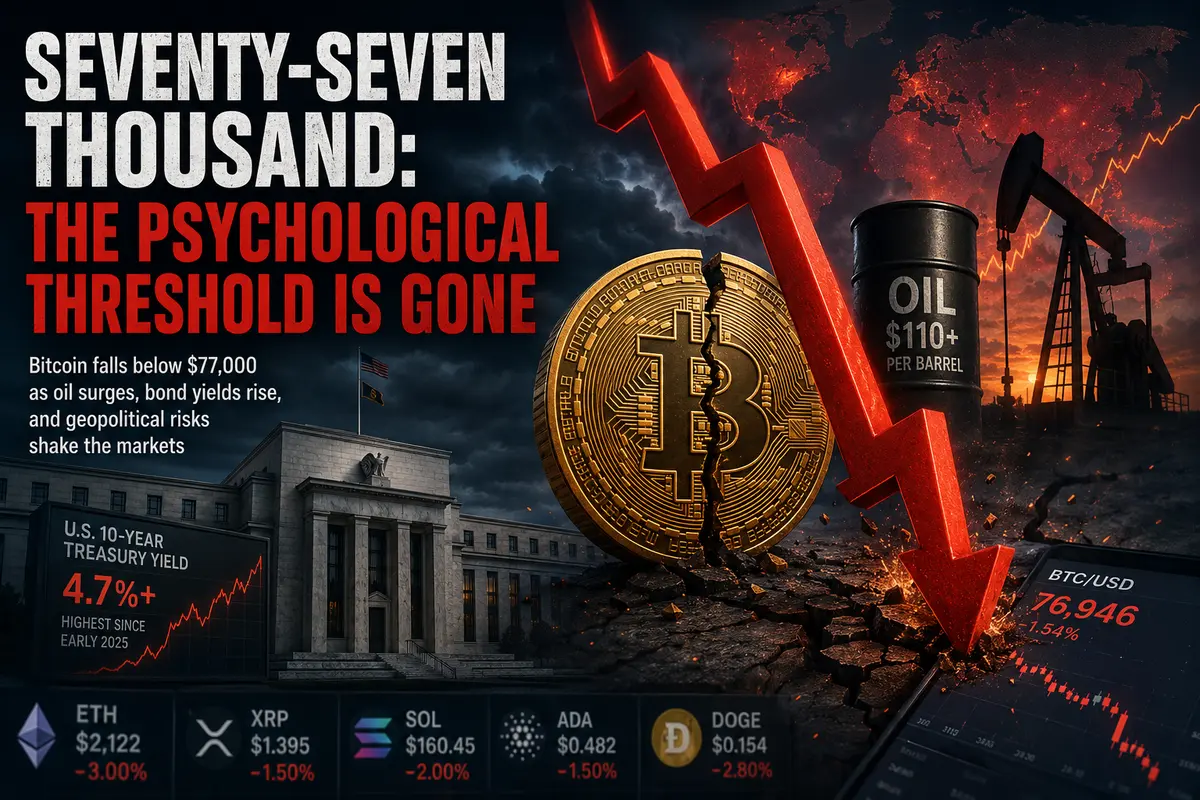
Monday began with an unpleasant milestone for Bitcoin. The leading cryptocurrency broke below the seventy-seven-thousand-dollar level and continued sliding lower, trading around $76,946. A one-and-a-half percent daily loss is not particularly dramatic for an asset accustomed to swinging five to ten percent in a single session. But more important than the percentage itself is the fact that this marked Bitcoin’s lowest level since May 1. Nearly three weeks of gains and consolidation were erased in just a few trading sessions.

Just last week, Bitcoin looked promising. It briefly climbed above the eighty-thousand-dollar mark, and bulls had already begun speculating about when the next major psychological level would fall. But the breakout turned out to be false, and the market failed to hold the higher ground. Looking back now, it’s becoming clear that the move above eighty thousand was not the beginning of a new rally, but rather a final burst before a prolonged correction. The crypto market, which only recently was fueled by hopes of imminent monetary easing, has collided with a harsh reality where oil prices are rising, bond yields are climbing, and risk assets are getting crushed.

Oil as the Killer of Risk Appetite

The main trigger behind today’s Bitcoin decline lies far outside the crypto world — in the Middle East and the bond market. On Monday, Brent crude oil surged above $110 per barrel, setting off a chain reaction that rippled across the entire financial universe.

Expensive oil means inflation. Inflation means higher interest rates. Higher rates are deadly for risk assets — and Bitcoin, whether people like it or not, still belongs in that category. Investors are looking at oil prices, headlines about drones over the UAE, and failed diplomatic negotiations with Iran, and drawing a simple conclusion: cheap energy is not coming back anytime...

Continue reading...
0
0
Navigation menu
instaforex banner