Auction Mechanics — Open/Close Crosses and Volatility Halts
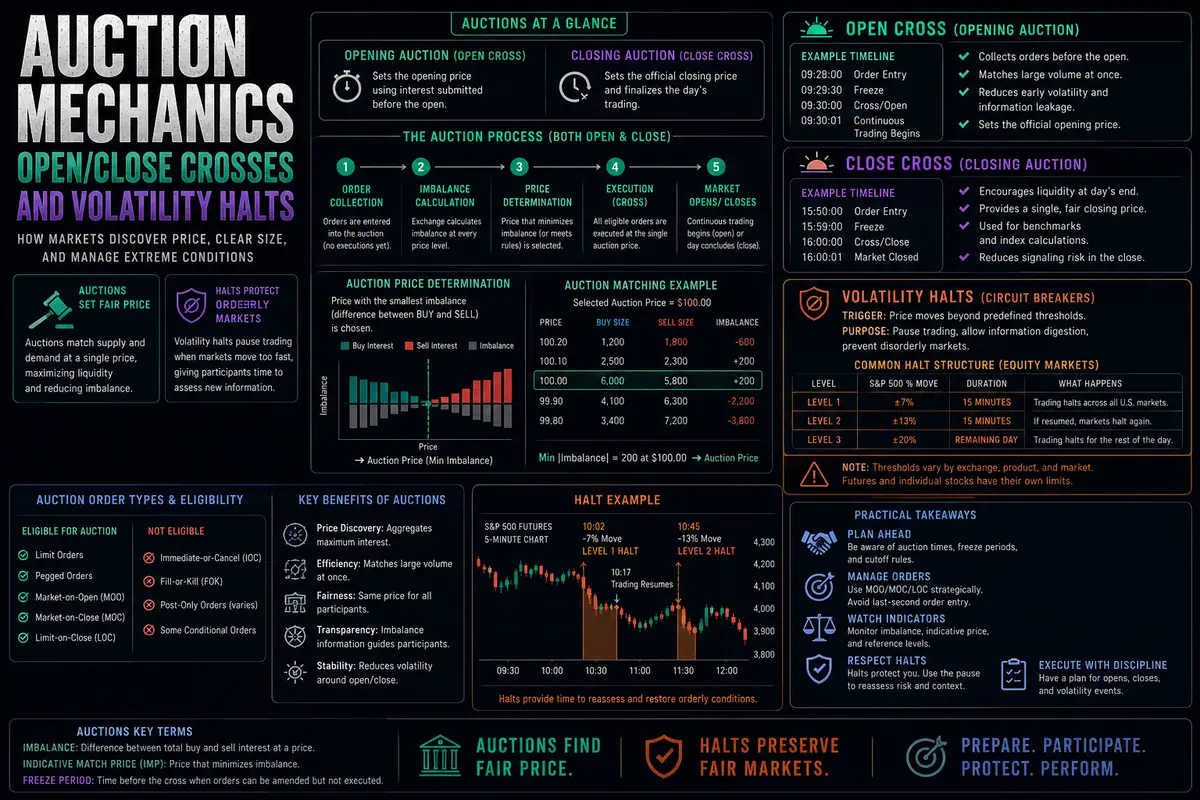
Financial markets do not operate as a continuous, uninterrupted stream of uniform activity. Instead, they function through distinct auction phases that transition from periods of intense price discovery to formal market closures and back again. Understanding the auction mechanics that govern market opens, market closes, and regulatory volatility halts is essential for any trader seeking to avoid the severe execution traps that occur during these transition windows.
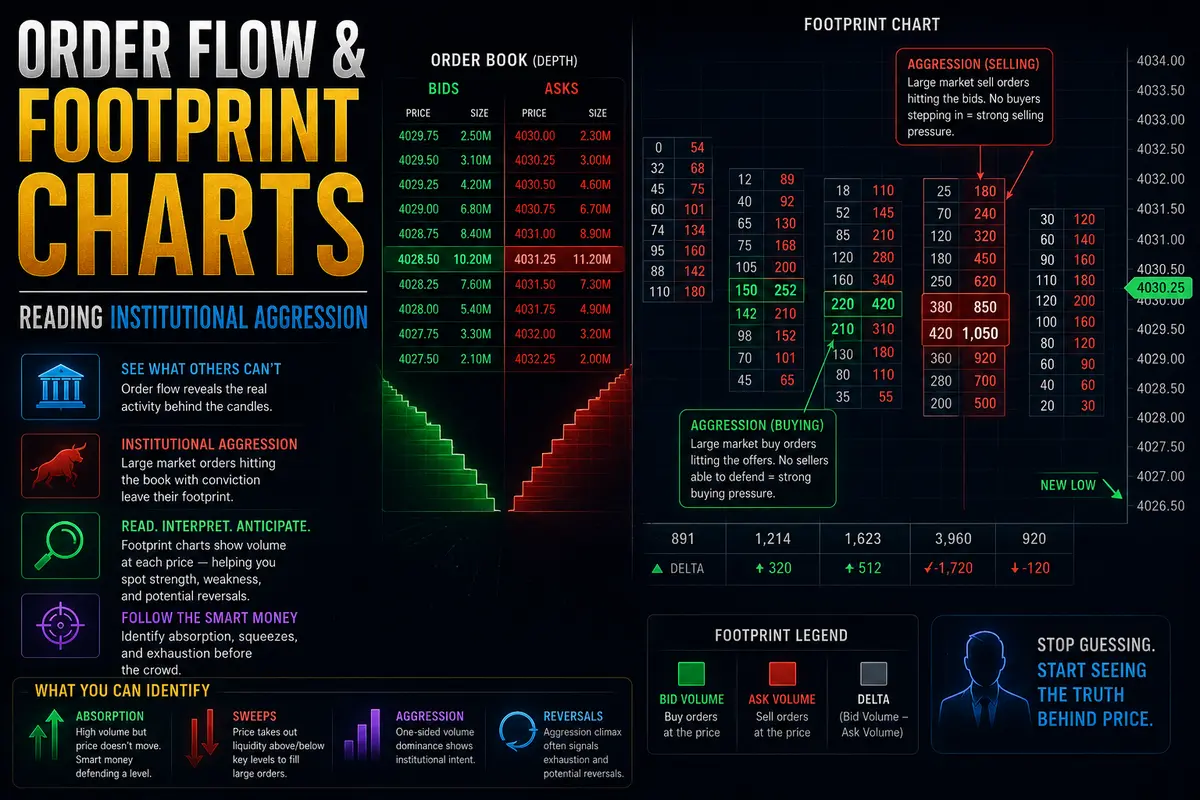
Unlike standard intraday trading where liquidity is continuously matched across the order book, auction mechanics rely on centralized call auctions designed to aggregate unexecuted orders and determine a single, fair clearing price for the entire market.
The Opening Cross: Price Discovery and Overnight Accumulation
The transition from the overnight closed market to the official cash session open is managed through an opening auction, frequently referred to as the Open Cross.
Throughout the overnight session, news releases, geopolitical developments, and macroeconomic data accumulate. Institutional and retail participants submit orders that sit in the limit order book as unexecuted instructions. During the pre-market phase, these orders are accumulated without executing immediately. The exchange matching engine constantly calculates an indicative clearing price—the exact price level where the maximum volume of buy and sell orders can be matched simultaneously.
As the official open approaches, trading desks flood the system with market-on-open (MOO) and limit-on-open (LOO) orders. This massive influx of accumulated liquidity creates a volatile supply and demand imbalance. When the opening bell rings, the matching engine executes all eligible orders at a single opening price.
For active traders, attempting to trade the immediate open is hazardous. The opening cross often produces aggressive price spikes that immediately reverse once the initial backlog of overnight orders is cleared. Waiting for the initial opening range to establish—typically the first fifteen to thirty minutes of the session—allows the market to...