Bar Pipa
We pay for a post of 10$

Trading Signals

pixel

The Order Book Predicts the Next Move 62% of the Time. Retail Never Opens It

The Order Book Predicts the Next Move 62% of the Time. Retail Never Opens It

There is a number that forecasts the next price tick with an R-squared of 0.62, and it updates thousands of times per second on data that every exchange publishes for free.

It is not RSI. It is not a moving average. It is not in any indicator pack you have ever bought.

It is the imbalance between the buy orders and the sell orders sitting in the order book right now.

Retail traders look at a price chart, which is a record of what already happened. Quant desks look at the order book, which is a record of what is about to happen. Those are not the same picture, and the gap between them is where a measurable amount of money changes hands every single day.

This article is about that gap. The mechanism is public, the math is published, and almost nobody outside a trading desk has ever looked at it directly.

What the Chart Actually Hides

A candlestick is a summary. It tells you the open, high, low and close over some interval. By the time you see it, the interval is over and the information is spent.

Underneath every one of those candles is the thing that actually produced it: the limit order book. A live, continuously updating ledger of every resting order in the market. Every price someone is willing to buy at, every price someone is willing to sell at, and critically, how many shares sit at each level.

The book has two sides. Bids are buyers waiting to be filled, stacked below the current price. Asks are sellers waiting, stacked above. The gap between the highest bid and the lowest ask is the spread. The sizes at each level are the depth.

This is not proprietary data. Exchanges publish it as the Level 2...
Continue reading...
0
0
pixel

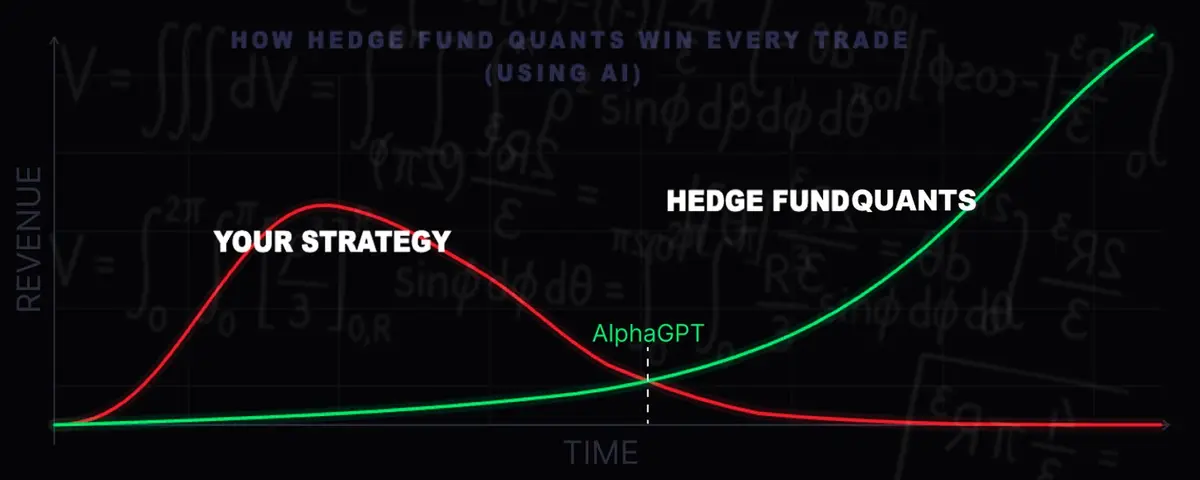
How Hedge Fund Quants Win Every Trade (Using AI)

How Hedge Fund Quants Win Every Trade (Using AI)

Man Group's Head of Quant said something that stuck with me:

"The challenge is the sheer volume of data and possible market relationships that has grown faster than any human team can evaluate by hand."

So they built AlphaGPT. It generates signal hypotheses, writes the code, and runs the backtests. Autonomously. Hundreds of ideas per week instead of 20 per quarter.

Bridgewater went further and built a $2 billion fund where AI makes the primary trading decisions.

Jane Street spent $6 billion on GPU infrastructure last year to train proprietary models.

I'm not going to pretend I know exactly what's running inside these systems. But the public statements from the people building them tell a fairly consistent story and it's not the one most people assume when they hear "AI trading."

The firms winning aren't replacing their quants. They're making each quant about 10x faster.

This article is the complete framework for running the same architecture on Polymarket today.

PART 1 - WILL AI REPLACE QUANTS?

The question everyone asks wrong.

Man Group went public with AlphaGPT in July 2025. The system generates signal hypotheses, writes implementation code, and runs backtests autonomously. Several dozen signals have already been approved for live trading after passing human review.

The challenge in quantitative investing is the sheer volume of data and possible market relationships that has grown faster than any human team can evaluate by hand.

A strong research team might seriously test 20 signal ideas in a quarter. AlphaGPT tests hundreds in a week.

But not a single signal from AlphaGPT touches real capital without a researcher making a deliberate decision about it.

Bridgewater built an AI Reasoning Engine combining LLMs, machine learning, and reasoning tools. Their co-CIO called it "a big jump." But humans still oversee risk management and execution.

Citadel's...

Continue reading...
0
0
pixel

What’s next for Oil 2.0

What’s next for Oil 2.0

The optimists ordered a taco: flows normalize, draws stop, the worst is behind us. Two months and a second chokepoint later, the kitchen sent out nachos. Messier, and nobody ordered them.

The follow-up to "What's Next for Oil" July 25, 2026

Everyone wants the taco. A clean ceasefire, ships streaming through Hormuz, oil back under $70, and the whole crisis filed away as a scare. Instead, the world got served nachos, a messy pile that keeps getting messier. We now have more hands in the dish every week and no clean way to pick it up. That's where we are.

The first piece argued the market had pre-committed to optimism and an inventory clock that doesn't care how anyone feels. It laid out three scenarios and said mid-July was the test. Mid-July came. Here's where we actually landed, and it isn't Scenario A.

Let me walk you through why the market is still priced for a taco and why I think it's dead wrong.

I. The optimists got exactly one thing right

Give them their due: over the last month, the escaping ships did their job. Barrels crept back out of the strait, the export pull on American crude eased just enough, and U.S. commercial inventory managed a small build. That build is real. It's also the entire basis of the oil bear-case victory lap, and it's being badly misread.

Commercial crude sits at 411.7 million barrels; this is down just 1.7% year-over-year. The optimists wave that number around as proof the crisis was overblown. Look how flat inventories are. But let's be fair: there's currently no shortage in crude in the US and anyone claiming there is a current shortage is selling clicks, not reality.

Fig. 1: EIA Table 1, U.S. Petroleum Balance Sheet (week ending 7/17/2026). Commercial...

Continue reading...
0
0
pixel

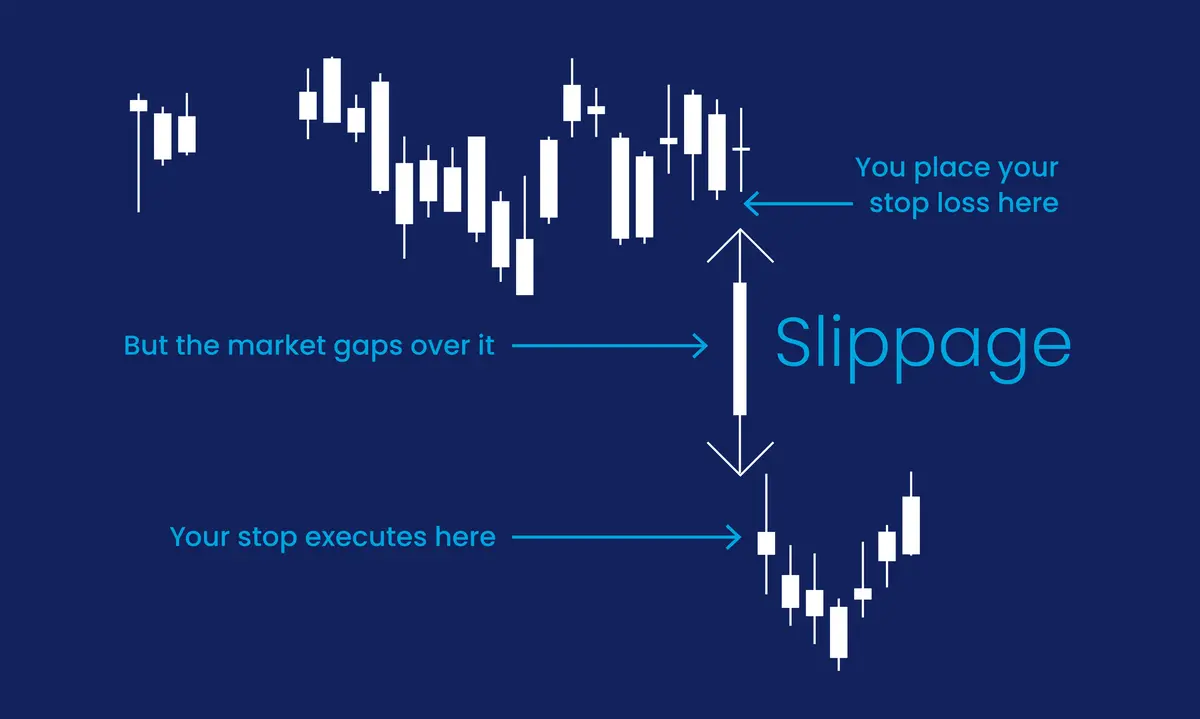
Slippage Explained: Why Your Crypto Trade Almost Never Fills at the Exact Price You Saw

Slippage Explained: Why Your Crypto Trade Almost Never Fills at the Exact Price You Saw

You tap "swap" on your favorite DEX. The screen says you'll get 1,000 USDC for your ETH. You confirm. Ten seconds later, the transaction lands — and you actually got 994 USDC. Nobody stole from you. No hack. No bug.

You just met slippage, one of the most misunderstood concepts in crypto trading. Whether you're swapping on Uniswap, filling an order on a centralized exchange, or aping into a fresh memecoin, slippage is quietly shaping every price you touch. Understanding it is the difference between a trader who feels ripped off and one who knows exactly what happened.

What Slippage Actually Is

Slippage is the difference between the price you expected to get and the price you actually got.

If you expected to buy ETH at $3,000 and you paid $3,015, that's $15 of slippage — half a percent. If you expected to sell 1 SOL for $150 and you received $148.50, that's $1.50 of slippage — one percent.

Slippage can be positive too. Sometimes you get a slightly better price than expected. But in practice, especially when you're the one initiating a trade, slippage almost always works against you. There's a structural reason for that, and we'll get to it.

The key insight: slippage is not a fee. Nobody charges it. It's not a hidden tax collected by the exchange. It's simply a consequence of how markets — and especially blockchain markets — actually work.

Why Slippage Exists

Imagine a farmer's market with one apple seller. She has ten apples at $1 each. You buy two — easy, $2 total. Now imagine you want fifteen apples. You buy all ten at $1, then have to find another seller who might charge $1.50 for the extra five. That $0.50 premium is your slippage.

Every market works this way. There's...

Continue reading...
0
0
pixel

Bitcoin Capitulation Deepens Near $64K as Holders Exit: Can BTC Avoid a Deeper Drop?

Bitcoin Capitulation Deepens Near $64K as Holders Exit: Can BTC Avoid a Deeper Drop?

million,

Bitcoin’s BTCUSD ... recent slide toward $64,000 has amplified losses among investors with short-term positions and brought key technical support levels into sharp focus. Data from CryptoQuant indicates that Bitcoin short-term holder market capitalization declined to $236.2 billion, reaching its lowest level since mid-2024 and signaling intensified selling pressure from recent buyers.

Contents

  1. Short-term holder losses mount as capitalization nears multi-year low

  2. Key technical support: $63,800-$62,400 zone outlines next BTC move

Short-term holder losses mount as capitalization nears multi-year low

CryptoQuant’s on-chain metrics confirm that net realized profit and loss for Bitcoin holders have remained negative in recent weeks. This pattern reflects sustained selling below cost by those who purchased amid recent volatility, coinciding with repeated spikes in realized losses during the ongoing market retreat.

The steep drop in short-term holder capitalization suggests that market participants with positions opened over the last several months are continuing to exit. Despite these outflows, ownership trends after the sell-off remain unclear based on available blockchain data.

At $236.2 billion, the current value controlled by short-term holders is approaching its lowest level in more than a year. This contraction illustrates diminished purchasing enthusiasm among investors who entered the market in 2025 and 2026.

Technical analysts are paying close attention to several chart levels under pressure. Ali Charts highlighted $63,800 as a crucial decision point on the four-hour time frame, identifying it as immediate support and marking $67,000 as a potential upside target if this level holds.

Price action shows short-term holders realizing losses as Bitcoin approaches $64,000, with market attention focused on the $63,800 support. If support is maintained, recovery toward $67,000 is possible, but a break below could expose $60,000 as the next key level.

Should Bitcoin fail to hold the $63,800 mark, the next major technical target sits at $60,000, escalating the...

Continue reading...
0
0

Hey this is the reason u lost that money.

Hey this is the reason u lost that money.

Why Most Forex Traders Lose Money (And How You Can Avoid Their Mistakes)

Make we tell ourselves the truth. Almost everybody that enters forex gets one dream: "Before this year ends, I go don cash out."

No be bad dream. The problem be say, many people think forex na quick money.

You open Instagram and see one guy post, "Made $500 before breakfast." Another person dey show Lamborghini keys. Before you know am, you don fund your account with plenty confidence.

Then market happen.

Your first week fit even sweet you. Maybe you make two or three winning trades. You begin feel say you don understand the market pass everybody. Na there wahala dey start.

One bad trade enters.

Instead of accepting the loss, you tell yourself, "E go reverse."

It no reverse.

You add another trade.

Still nothing.

Before you know wetin dey happen, the account wey you dey protect yesterday don disappear. Omo, that kind pain different.

The funny thing be say, the market no hate anybody. E no even know your name. Most people lose because of the same mistakes, and if care no dey taken, you fit join them.

The first mistake na entering every trade wey your eye see.

Price just move small, you don press Buy.

Price drop small, you don press Sell.

Calm down na.

No be every movement be opportunity. Sometimes the best thing you fit do as a trader na to close your app and go drink cold water. Opportunities no dey finish for forex.

Another thing wey dey wound many traders na greed.

You make $20 profit, but instead of closing the trade, you say, "Make e reach $100."

Few minutes later, the market changes direction. That $20 profit don turn to $10.

You still refuse to close.

Before long,...

Continue reading...
0
0

How to build confidence as a new trader

How to build confidence as a new trader

How to Build Confidence as a New Forex Trader

Every trader starts somewhere. No one opens a trading account on Monday and becomes consistently profitable by Friday. Yet many beginners expect exactly that. When the first few trades don't go as planned, confidence disappears almost overnight. Some people begin doubting themselves, while others jump from one strategy to another, hoping the next one will finally be the answer.

The truth is that confidence in trading isn't something you're born with. It isn't luck either. Real confidence is built over time through experience, preparation, and discipline. The traders who seem calm during market swings weren't always that way. Most of them have made mistakes, blown trades, and learned difficult lessons before reaching where they are today.

One of the biggest reasons beginners lose confidence is because they compare themselves to experienced traders on social media. Every day, it's easy to find screenshots showing massive profits or videos claiming someone turned a small account into a fortune. What you rarely see are the losing trades, the missed opportunities, or the months of frustration behind those success stories.

Never I compare yourself to older traders,that's u being unfair to urself,try to master ur own trading, follow ur journey and allow ur steps to build up over time.

I can as well grow or build ur confidence by mastering one method of trading at a time,stop switching to another method just because I lost a trade,rather take a biro, and ur book,take not of what happened and try again,this time avoid ur previous mistakes

Confidence comes from identifying your mistakes during ur trading session, and never blamed your self,just take out some time and study ur mistakes,ur loss and identify what went wrong.

It is going to help u prepare for the next trade...

Continue reading...
0
0

Learn about GBPUSD and trade this currency pair like a pro.

Learn about GBPUSD and trade this currency pair like a pro.

GBPUSD is the goat,wants to learn how to analyse GBPUSD?

Here is an article that takes you through that route.

If you have been trading,then I should have come across GBPUSD,it is among the oldest currency pairs still actively traded in the industry today, because it appreciate very well and the prediction mostly stays consistant,we traders calls it -cable-

Many beginners are drawn to GBP/USD because it offers strong price movements and plenty of trading opportunities. At the same time, its volatility means traders need a solid plan before risking real money. Understanding what drives this pair can make a noticeable difference in your trading decisions.

One of the biggest influences on GBP/USD is the economic health of the United Kingdom and the United States. Investors closely follow reports such as inflation, employment figures, retail sales, manufacturing data, and gross domestic product (GDP). Positive economic news often strengthens a country's currency because it signals a healthy economy. On the other hand, disappointing data may weaken the currency as investors become less confident.

Interest rates are another major factor. The Bank of England and the U.S. Federal Reserve regularly review monetary policy to control inflation and support economic growth. When a central bank raises interest rates, its currency often becomes more attractive to investors looking for better returns. However, market expectations also matter. Sometimes a currency falls even after a rate hike if traders were expecting an even more aggressive decision.

Technical analysis is widely used when trading GBP/USD. Instead of focusing only on economic news, technical traders study price charts to identify trends and possible turning points. They may use support and resistance levels, moving averages, trend lines, RSI, or MACD to help confirm trading ideas. Candlestick patterns, such as engulfing candles, pin bars, and doji formations, can also provide...

Continue reading...
0
0
joy

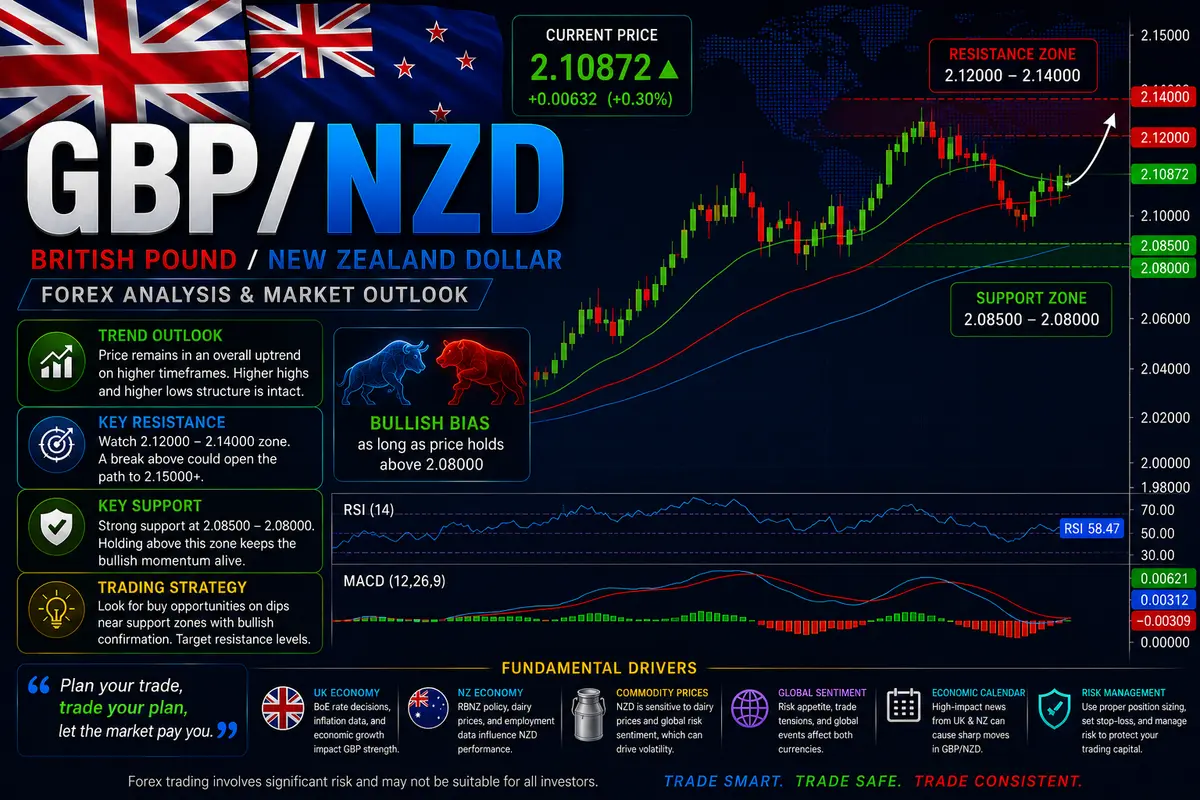
GBP/NZD – The Flying Kiwi, Massive Pip Spikes, and Navigating Thin Liquidity

GBP/NZD – The Flying Kiwi, Massive Pip Spikes, and Navigating Thin Liquidity

If you thought GBP/AUD was violent, wait until you watch GBP/NZD move.

Known across dealing desks as "The Flying Kiwi" or "The Beast’s Twin," GBP/NZD sits right at the extreme end of the forex volatility spectrum. It is not unusual for this pair to carve out a 300 to 400-pip range in a single 24-hour cycle. When a major central bank surprise or global commodity shock hits, that daily range can easily explode past 600 pips.

Because of this sheer velocity, GBP/NZD is an absolute landmine for beginner traders using tight stop losses. But for disciplined traders who know how to size down, handle wide wicks, and exploit the illiquid hand-off between Wellington and London, it offers some of the most profitable trend expansions on the entire market.

The Fundamental Divergence: Sterling Sentiment vs. The Global Milk Machine

To understand why GBP/NZD moves with such terrifying speed, you have to look at the massive fundamental disconnect between the United Kingdom and New Zealand.

1. New Zealand’s Agricultural Export Engine

New Zealand is a small island economy whose exchange rate is tied directly to agricultural exports—specifically whole milk powder and dairy products.

  • When global dairy demand is hot and milk prices surge at the bi-weekly Global Dairy Trade (GDT) auctions, the Reserve Bank of New Zealand (RBNZ) gets hawkish and capital floods into the Kiwi Dollar.

  • When dairy prices slump or Chinese import demand cools off, the Kiwi bleeds value fast.

2. Great Britain’s Service & Rate Differential Mechanics

Sterling, meanwhile, reacts aggressively to UK inflation metrics, Bank of England (BoE) policy shifts, and European trade flows.

3. The Cross-Rate Formula

GBP/NZD isn't an isolated ticker—it's calculated directly by dividing GBP/USD by NZD/USD:

GBP/NZD=NZD/USDGBP/USD​

When GBP/USD rallies on hawkish Bank of England comments at the exact same moment NZD/USD crashes due...

Continue reading...
0
0
joy

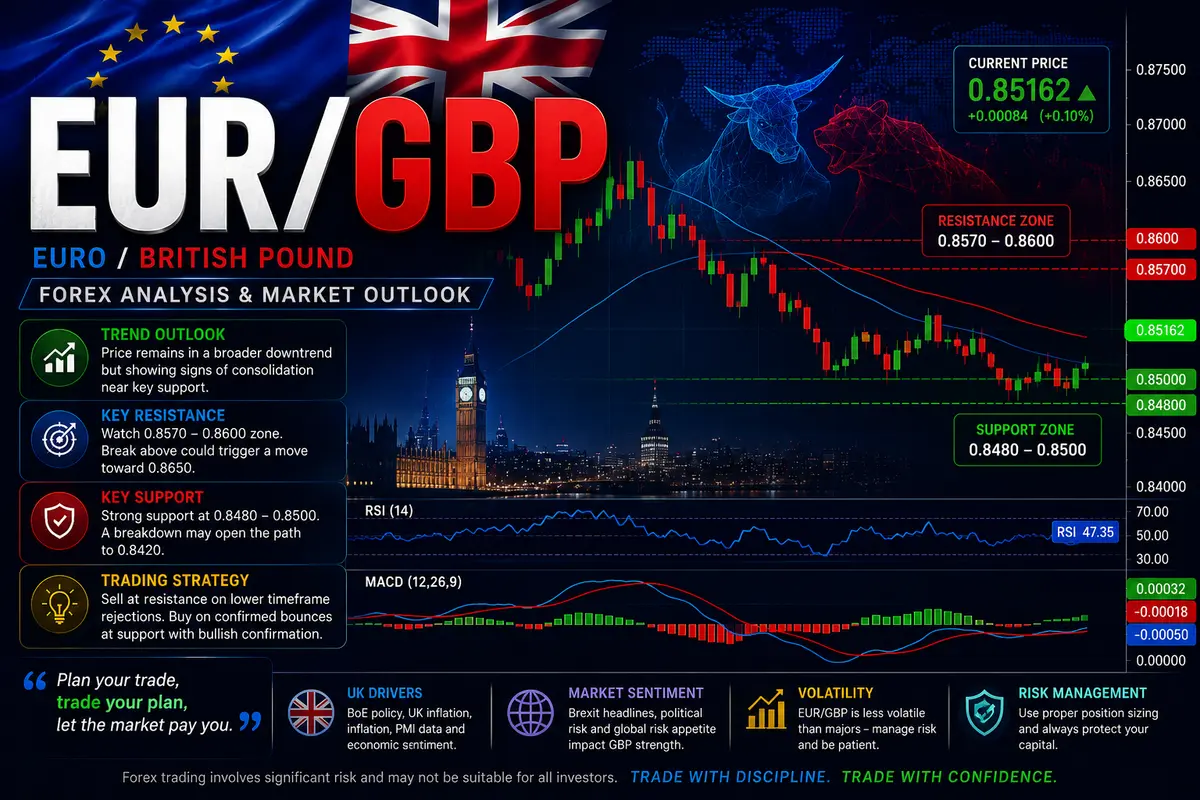
EUR/GBP – The Border Crosser, Range Trading, and Central Bank Relative Strength

EUR/GBP – The Border Crosser, Range Trading, and Central Bank Relative Strength

EUR/GBP is known across institutional trading desks as one of the most stubborn, low-volatility cross pairs on the planet. Unlike explosive pairs like GBP/JPY or news-driven majors like EUR/USD, EUR/GBP spends the vast majority of its existence locked in tight, highly structured horizontal ranges.

When traders move from fast-moving trend assets to EUR/GBP without adjusting their expectations, they usually end up frustrated. They get chopped up buying breakouts that immediately fail, or they close trades out of boredom right before a subtle 30-pip expansion completes.

However, for traders who understand range mechanics, institutional order matching, and relative strength between the European Central Bank (ECB) and the Bank of England (BoE), EUR/G

P is one of the most reliable mean-reversion assets in forex.

Why EUR/GBP Trades So Differently

To understand why EUR/GBP rarely produces 200-pip trend days, you have to look at the massive economic and geographic integration between Great Britain and the European Union.

1. The Geographic and Commercial Tether

The UK and Eurozone are primary trading partners. Millions of Euros and Pounds move between London, Frankfurt, Paris, and Amsterdam every single day to settle real-world corporate transactions. Because cross-border supply chains are so tightly linked, long-term valuation divergences between the two currencies create economic drag on both sides.

When EUR/GBP moves too high, European goods become expensive for British buyers; when it drops too low, UK exports get penalized. Commercial order flow naturally pulls this pair back toward a fair-value median over time.

2. The Shared US Dollar Factor

Because both the Euro and Sterling are priced heavily against the US Dollar in the spot market, global USD momentum hits both currencies at the exact same time.

If the US Dollar Index (DXY) surges or crashes, EUR/USD and GBP/USD usually move in the same direction. Because both leg-pairs are...

Continue reading...
0
0
Navigation menu
instaforex banner