Bar Pipa
We pay for a post of 10$

Trading

pixel

Why You Keep Exiting Winning Trades Too Early
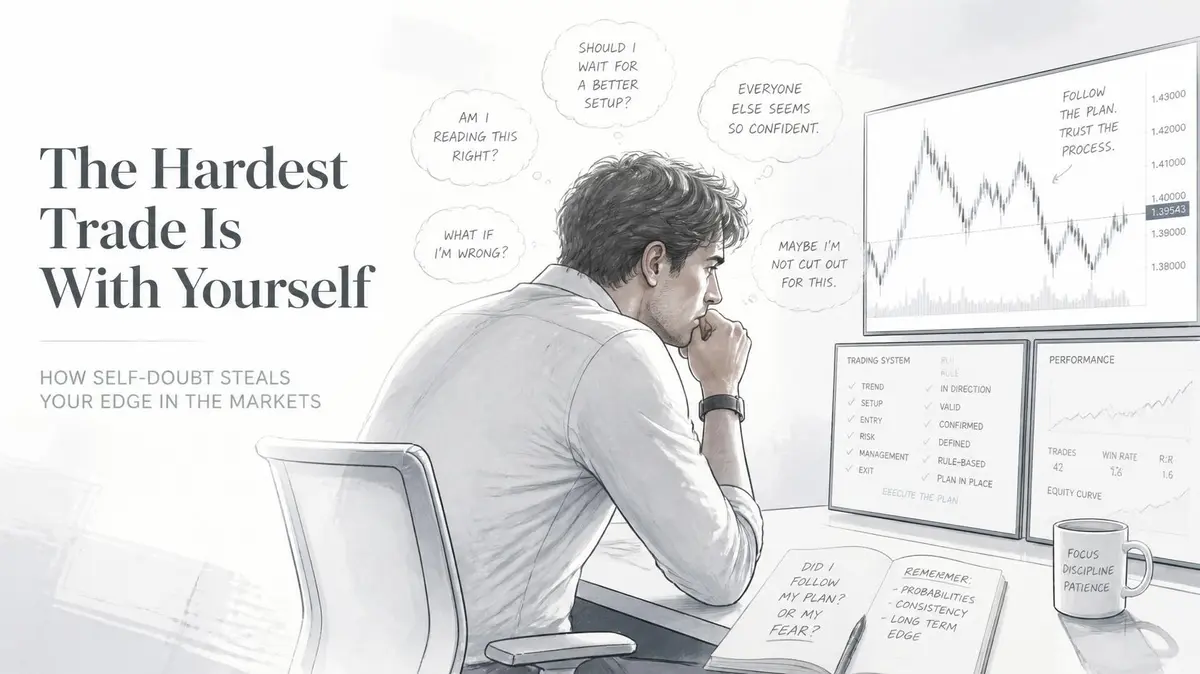
Why You Keep Exiting Winning Trades Too Early

Have you ever found yourself in a trade that’s working well, yet you still close it far too soon? Not because your stop loss was hit. Not because the chart broke your setup. Just a tight feeling in the chest, a wave of anxiety, and the quiet fear that it might reverse any second. That feeling does not come from the market. It comes from inside you. And most of the time it means one clear thing—you do not fully trust your own setup.

This is one of the most common and costly patterns among traders who understand charts yet still struggle with consistency. The problem is rarely the strategy. The real issue is the gap between knowing the rules and believing them enough to stay in the trade when it matters most.

What Really Causes Premature Exits?

Many traders blame the market for shaking them out. They talk about stop hunts or sudden volatility. While those things exist, they are rarely the main reason a trader exits early. The deeper cause is internal. When belief in the system is weak, even a normal pullback starts to look dangerous. A single red candle feels like a threat. A routine retracement begins to look like a full reversal. In that moment the mind chooses the temporary relief of closing the position over the discomfort of uncertainty.

This creates a painful cycle. You exit, the trade continues in your original direction, and you watch it reach the target you had planned. The regret that follows only deepens the lack of trust. The next time a similar setup appears, the fear is stronger. Over time the trader starts switching strategies after every few losing trades, searching for a “better” system that will somehow remove the need for patience.

The Psychological Mechanism Behind Early...

Continue reading...
0
0
pixel

The Blueprint to Consistent Capital Growth: Mastering Simplicity and Trading Psychology

The Blueprint to Consistent Capital Growth: Mastering Simplicity and Trading Psychology

Trading is often misconstrued as a game of highly complex algorithms and predictive superpowers. However, when you observe professional traders pulling apart the strategies of developing traders, a glaring truth emerges: beginners overcomplicate their charts, while professionals ruthlessly simplify theirs.

If your goal is to systematically grow your capital over a standard 20-day trading cycle, the secret does not lie in adding more indicators to your MetaTrader 5 interface. It lies in refining your trading psychology, aligning yourself with the higher timeframes, and executing a singular, masterfully understood edge. Here is the professional blueprint for tearing down a flawed trading model and rebuilding it for consistent profitability.

The Trap of Over-Complication

The most common hurdle for traders who understand the mechanics of the market but struggle to build their account balance is over-complication. More data does not equal more profit; it often results in analysis paralysis.

Confluences as a Coping Mechanism

Many developing traders stack confluences on top of each other — waiting for a liquidity sweep, an internal market structure shift, a 79% Fibonacci retracement, and a fair value gap all to align perfectly on the 1-minute chart. While this sounds incredibly precise, professionals recognize this behavior as a psychological coping mechanism.

By demanding a flawless setup, you are inadvertently protecting yourself from taking the trade and facing a potential loss. This extreme strictness drops your trade frequency to near zero. You end up missing the most explosive, high-probability moves because price simply tapped a 15-minute gap and ran without giving you that deep 79% pullback. Trading is an exercise in managing probabilities, not demanding perfection.

The Strategy Hopping Syndrome

Running two entirely different strategies concurrently — such as an EMA crossover model alongside a Smart Money Concepts (SMC) liquidity model — guarantees that you master neither. Conflicting signals...

Continue reading...
0
0

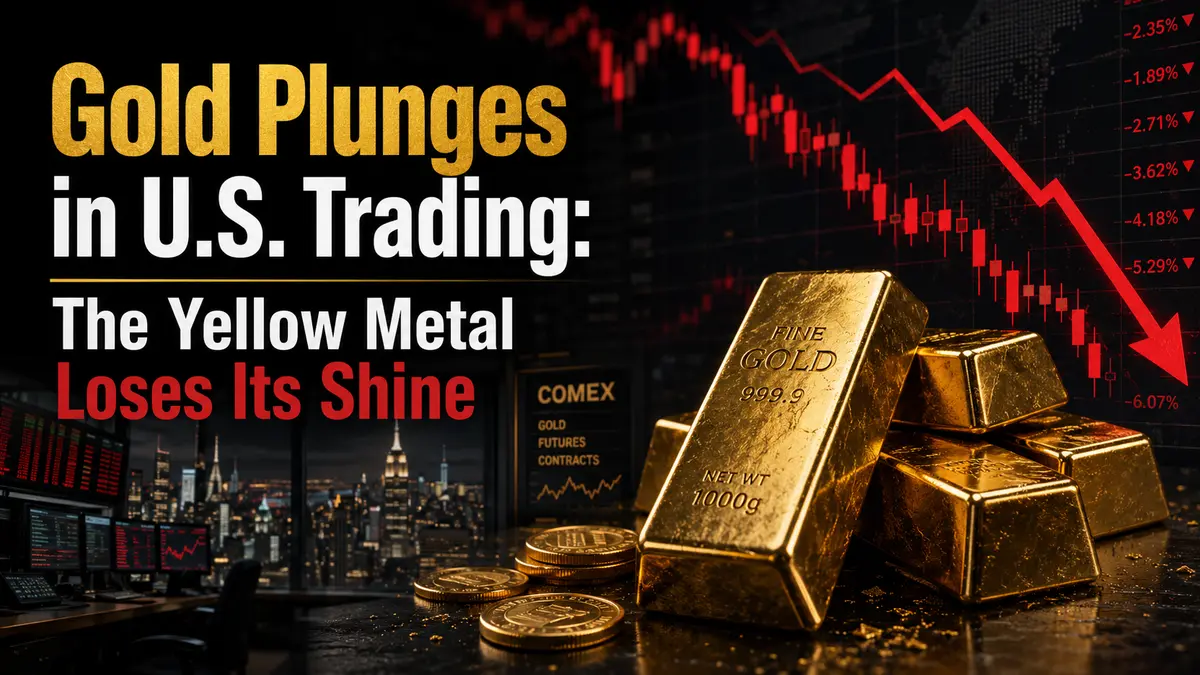
Gold Plunges in U.S. Trading: The Yellow Metal Loses Its Shine

Gold Plunges in U.S. Trading: The Yellow Metal Loses Its Shine

Introduction: The Wednesday When the Safe-Haven Asset Stopped Providing Safety

Wednesday, U.S. trading session. New York, COMEX. Traders who are used to seeing gold as a reliable safe haven during periods of uncertainty are now watching their confidence collapse. Gold futures for August delivery are plunging by 1.53% to $4,093.80 per troy ounce. This is not just a correction — it is the sharpest decline in recent weeks.

What happened? The yellow metal, which usually rises on geopolitical risks, is today ignoring the escalation of the conflict between the United States and Iran. Instead of rising, gold is falling. Silver, gold’s loyal companion, is falling even harder — down 3.92% to $58.93 per ounce. Copper is losing 1.48% to $6.13 per pound.

The technical picture is also discouraging. Gold found support at $4,032.37 and resistance at $4,215.50. The current price of $4,093.80 is closer to the lower boundary of this range. If gold continues to decline, it may test support at $4,032.37. If it reverses, resistance at $4,215.50 will become the next target.

The U.S. Dollar Index fell by 0.05% to 100.73 points. This is a minor decline, but it is not helping gold. The reason for the fall is not the dollar. It is something else.

Let’s examine why gold has plunged despite the geopolitical crisis and what this means for the precious metals market.

Why Gold Is Falling: Solving the Paradox

Inflation Expectations and Interest Rates

The main reason for gold’s decline is inflation expectations. The geopolitical crisis in the Middle East has led to higher oil prices. Higher oil prices mean higher inflation. Higher inflation means higher interest rates. Higher interest rates mean a stronger dollar. And a stronger dollar weighs on gold.

Gold is traditionally considered a hedge against inflation. But when inflation leads to higher...

Continue reading...
0
0
Lin Brings

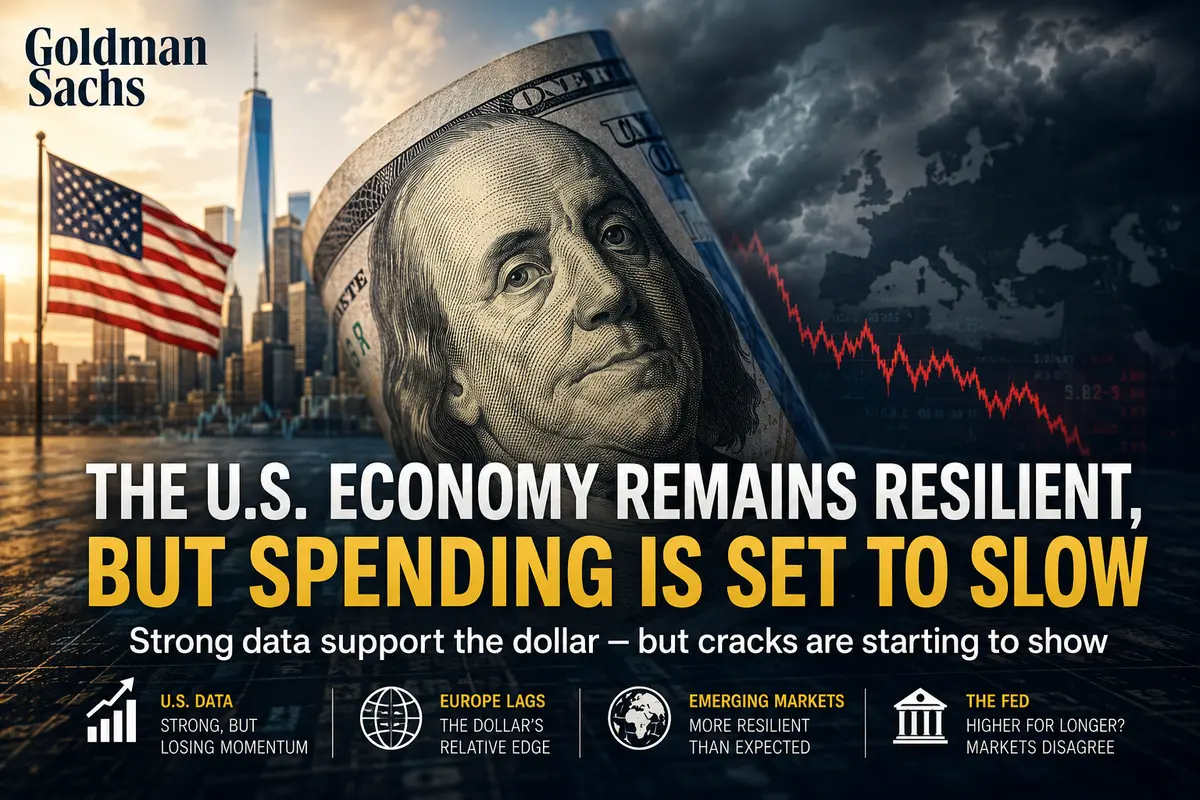
Goldman Sachs: The U.S. Economy Remains Resilient, but Spending Is Set to Slow

Goldman Sachs: The U.S. Economy Remains Resilient, but Spending Is Set to Slow

America Is Holding Up — But It’s Not Bulletproof

Goldman Sachs, one of the most influential voices in global finance, recently released a detailed assessment of the U.S. dollar and the American economy. The bank’s conclusions are both encouraging and cautionary. On one hand, the U.S. economy continues to demonstrate remarkable resilience. On the other, there are growing signs that this resilience is beginning to show cracks—not fatal or catastrophic cracks, but noticeable ones for those who know how to read between the lines of economic reports and data.

According to Goldman Sachs, the U.S. dollar remains supported by strong economic fundamentals and rising interest-rate expectations. This has been the foundation underpinning the currency for the past eighteen months. However, the bank’s analysts warn that improving global risk sentiment and the resilience of foreign currencies could limit further dollar gains. In other words, the dollar is no longer as attractive as it once was. It remains strong, but its advantage over other currencies is gradually narrowing.

Goldman’s assessment of the latest U.S. economic data is particularly noteworthy. Friday’s employment report exceeded expectations, while resilient ISM business activity indexes pointed to continued economic expansion. Together, these factors support higher Treasury yields and wider interest-rate differentials in favor of the dollar. Europe, Japan, and China continue to lag behind. America remains ahead, and the dollar is reaping the benefits of that leadership.

Yet Goldman also sees the other side of the story. Strong employment and inflation data are positive for the dollar, but they can be negative for equities because they encourage the Federal Reserve to maintain a restrictive monetary stance. And restrictive policy increases recession risk. There is no recession today, but the possibility remains on the horizon—and investors are aware of it.

U.S. Data: Resilience with Signs of Fatigue

What...

Continue reading...
0
0
NorthRay

I Wanted a Robot to Trade for Me. I Almost Bought the “Magic Button.” Good Thing I Stopped in Time.

I Wanted a Robot to Trade for Me. I Almost Bought the “Magic Button.” Good Thing I Stopped in Time.

Hi, this is NorthRay.💪

Do you know what I was looking for in my first days of trading?

Not a strategy. Not knowledge. Not discipline.

I was looking for a magic button.

A button that would open trades for me. One that never sleeps, never gets scared, and never makes stupid mistakes. One that makes money while I drink coffee or sleep.

And I found one. Or rather, someone offered it to me.

  • “Trading robot with a 95% win rate.”

  • “Copy trading — copy professional traders and earn money.”

  • “Passive income of 30% per month.”

I almost fell for it because it sounded perfect.

But then I asked myself one question:

“If it’s really that simple and profitable, why isn’t every trader already a millionaire?”

So I started digging. And here’s what I learned.

What Are Trading Robots (Expert Advisors)?

A trading robot (or Expert Advisor) is a program that automatically opens and closes trades according to a predefined algorithm.

You install it in MetaTrader 4, turn it on, and the robot analyzes the chart, presses Buy and Sell, and sets stop-losses by itself.

No involvement from you. 24/5. No emotions. No fear. No greed.

Sounds like a beginner’s dream, right?

I downloaded a free robot, installed it on a demo account, and turned it on.

It opened a trade. Then another. Then another.

An hour later, I checked the results: three losing trades and one winning trade. Overall result: negative.

I thought:

“Maybe I downloaded a bad robot. Maybe I should buy a paid one?”

That’s when I started doing real research.

How I Almost Bought a Robot (And Why I’m Glad I Didn’t)

I visited a website selling a “super robot with 90% accuracy.”

Beautiful website. Equity growth charts. Reviews (probably fake). A 70% discount “today only.”

Price:...

Continue reading...
0
0

XAUUSD Technical Outlook – 4 June 2026

XAUUSD Technical Outlook – 4 June 2026


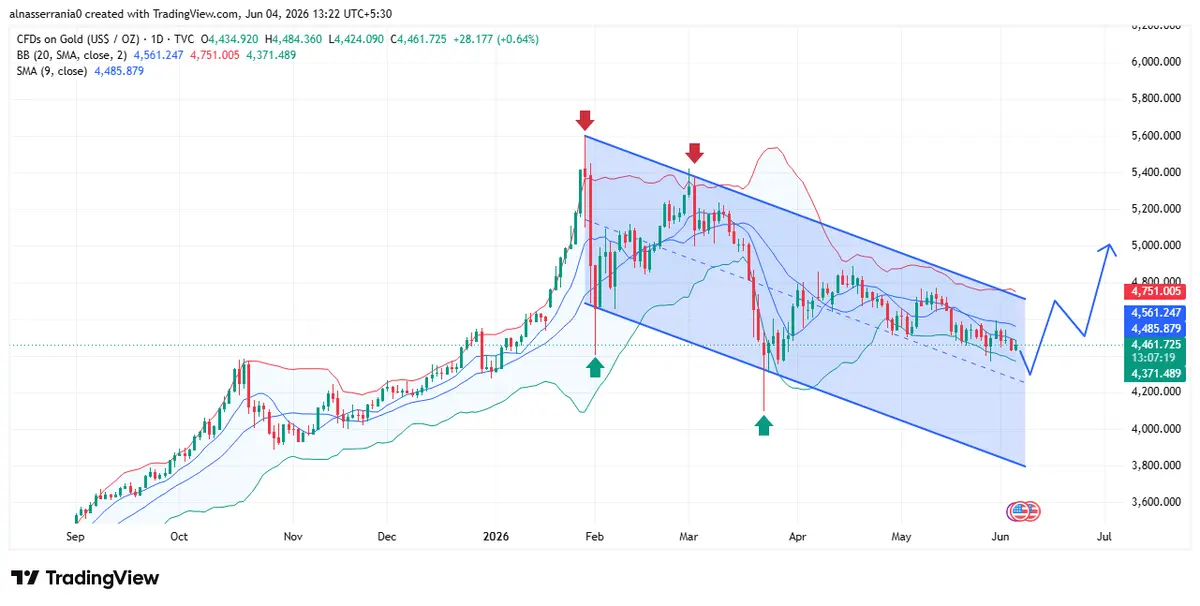
Descending channel, the dominant structure since February peak

Gold peaked sharply near $5,500+ in early February 2026 and has been carving a clear descending channel (drawn in blue on the chart) ever since. Both the upper and lower channel lines are well-respected, price has tested both boundaries multiple times. The channel is sloping down from top-right to bottom-left, which tells you the sellers have been in control for 4+ months

Price is sandwiched, squeezed between channel support and SMA9

At $4,461, price is sitting right at the lower boundary of the descending channel a historically significant bounce zone. Both prior green arrows on the chart (February and March) marked rebounds from this exact region. The SMA9 ($4,485) is overhead acting as immediate dynamic resistance. Price needs to close above SMA9 on a daily basis to even hint at recovery. Until that happens, this is a range-bound squeeze with downside risk still alive.

Key Levels to watch

  • Channel top / BB upper - $4,751 Major resistance — unlikely near-term

  • SMA20 midline - $4,561 Bears defend this level

  • SMA9 dynamic resistance - $4,485 Immediate ceiling today

  • Current price - $4,461 At channel lower support

  • BB lower / channel floor - $4,371 Critical support — bounce or break

  • Breakdown target - $3,800 If $4,371 fails decisively

Continue reading...
0
0
NorthRay

Economic Calendar: Why My Trade Died After the Words “Fed Rate” (and How I Started Looking at It Differently)

Economic Calendar: Why My Trade Died After the Words “Fed Rate” (and How I Started Looking at It Differently)

Hi, this is NorthRay.🎉

Remember when I told you about the time I opened a trade, and an hour later the price suddenly shot in the opposite direction — and I had no idea why?

I sat there staring at the chart thinking:

“What just happened? Did someone drop a nuclear bomb? Has the market gone insane?”

Then I checked the news.

Turns out that exact same hour, the head of the U.S. Federal Reserve (Fed) said a couple of sentences about interest rates.
The market reacted.
My trade died.

That was the first time I heard about the economic calendar.

And I realized: opening trades blindly without knowing what news is coming out today is like walking through a minefield blindfolded.🧐

What Is an Economic Calendar? (In Simple Words)

An economic calendar is a schedule of all major economic events around the world.

When the U.S. unemployment report comes out.
When the European Central Bank announces interest rates.
When Germany publishes industrial data.
When world leaders make important agreements.

All of it is in the calendar.

Simple analogy:

Imagine you want to cross the street. You look at the traffic light.
Green — you walk.
Red — you stop.

The economic calendar is your traffic light. It tells you:

“Be careful now, an important report is coming out.”
Or:
“The market is calm right now, it’s okay to trade.”

Without a calendar, you’re crossing the street with your eyes closed.
Maybe you’ll get lucky. Maybe not.🧠

Why News Affects the Market So Much (I Learned This the Hard Way)

The market is not just a chart. It’s people. Millions of traders around the world.

They read the news.
And they make decisions.

Good economic news → people buy the country’s currency → price goes up.

Bad news → people...

Continue reading...
0
0
NorthRay

Buy and Sell: Two Buttons That Control the World (and My Nerves)

Buy and Sell: Two Buttons That Control the World (and My Nerves)

Hi, this is NorthRay.

Remember how in my first post I was afraid to press “New Order”?

I sat there staring at the terminal thinking:
“Should I buy or sell? What if I click the wrong thing? What if I choose incorrectly and get arrested?”

Spoiler: you won’t get arrested.

But back then, those two buttons — Buy and Sell — felt like magic to me. I didn’t understand what they did. I was just clicking randomly.

Then I figured it out.

And now I’ll explain it so simply that even my grandma would understand (she still doesn’t get why I stare at charts all day, but at least now she knows what the buttons mean).

What Buy Means in Simple Terms

Buy means buying. You’re betting that the price will go UP.

Simple example:

Imagine you’re at an apple market.

Today, an apple costs $1.

You think:
“Tomorrow apples will cost $2.”

So you buy an apple now for $1.

Tomorrow the price becomes $2.

You sell the apple. Your profit is $1.

That’s Buy.
You bought cheap and sold expensive.

Trading works the same way:

— You open a Buy trade.
— The price goes up.
— You close the trade and keep the difference.

When to press Buy:
When you think the price will rise.

What Sell Means in Simple Terms

Sell means selling. But not the usual kind. Here, you sell something you don’t actually own yet.

Sounds weird? Let me explain.

Simple example:

You’re at the same apple market.

Today, an apple costs $2.

You think:
“Tomorrow apples will drop to $1.”

You don’t have any apples. But the broker says:
“I’ll lend you an apple. Sell it now for $2. Tomorrow, buy a cheaper apple for $1 and return it to me.”

So you...

Continue reading...
0
0
John Madnes

Gold Pulls Back During Asian Trading

Gold Pulls Back During Asian Trading

Gold futures headed lower during the Asian session on Wednesday, snapping a recent stretch of choppy trading near the elevated levels reached earlier. The COMEX division of the New York Mercantile Exchange recorded a decline in June gold contracts, which settled at roughly $4,707.57 per troy ounce, down about 0.45% at the time of writing.

The session kicked off with the metal searching for a foothold. The intraday low plunged well below the opening levels, and gold was forced to test support around the 4,646.01. A narrow corridor emerged, and the metal spent the entire morning trading within this confined range.

Why is this happening now? Gold is highly sensitive to the mood surrounding the U.S. dollar, and the greenback was sending mixed signals on Wednesday. The U.S. Dollar Index, which measures the dollar's strength against a basket of six major currencies, was barely changed — trading at 98.20, down just 0.02%. On the surface, any slight dollar weakness should nudge gold higher. Instead, investors seemed to hit the pause button, clearly unwilling to pile into aggressive positions ahead of the next batch of macroeconomic news.

Silver and Copper: A Sharp Divergence

While gold was slipping moderately, the silver market was undergoing a far steeper correction. July silver futures tumbled 1.59%, hitting $86.95 per troy ounce. For silver, which often moves in gold's wake but with larger swings, this kind of drop wasn't a shock. When the market gets jittery, industrial demand forecasts for the white metal often get revised downward, and speculators rush to lock in profits.

The copper market told a completely different story. July contracts on this key industrial metal instead rose by 0.26%, climbing to $6.65 per pound. Copper has been living a life of its own lately, paying...

Continue reading...
0
0
NorthRay

How Charts Affect Sleep and Nerves: Is Trading About Health?

How Charts Affect Sleep and Nerves: Is Trading About Health?

Hey, this is NorthRay.

You know what no one told me before I opened my first order?

That trading isn't just about charts, strategies, and green candles.

It's also about sleepless nights. And the anxious "uh oh, why did the price go the wrong way?" And the urge to close the laptop and never open it again.

I thought the hardest part was learning to read the market.

Turns out, the hardest part is learning not to lose your mind while doing it.


My first "hello" from insomnia

Remember that 0.50 lot trade I wrote about last time?

Well, I didn't close it all day. Or all evening. Or all night.

I lay in bed, stared at the ceiling, and thought, "I wonder what's happening with EUR/USD right now?"

I grabbed my phone. Opened the terminal.

The price dropped 20 pips.

I closed my phone. Lay down. Five minutes later, I opened it again. The price went up 10 pips.

This went on for about two hours.

I didn't sleep. I couldn't sleep. Because it wasn't an alarm clock ticking in my head — it was the chart.

The next morning, I looked like a zombie. Drank three cups of coffee. And asked myself: "Are you going to trade or destroy your health?"


Is trading about money? Or about nerves?

I started with the thought: "Once I learn, I'll start making money."

But now I'm starting to understand something else.

Trading isn't about money.

Trading is about self-control.

Because the market doesn't care about you. About your sleep. About your nerves. About the fact that you have work tomorrow or that you have a headache.

The market goes where it goes. And you either handle it emotionally, or you crash.

And you can crash not just financially —...

Continue reading...
0
0
Navigation menu
instaforex banner