Pound Holds Firm, Euro Strengthens: Currency Markets Pause Ahead of Inflation Data

Introduction: The Calm Before the Storm
Tuesday was a day of cautious optimism for the British pound EURGBP ... and the euro. Both currencies posted modest gains as markets paused to reassess the pace of the US dollar’s appreciation. Geopolitical tensions in the Persian Gulf continue to support demand for the American currency, but investors are reluctant to make sharp moves ahead of key US inflation data.
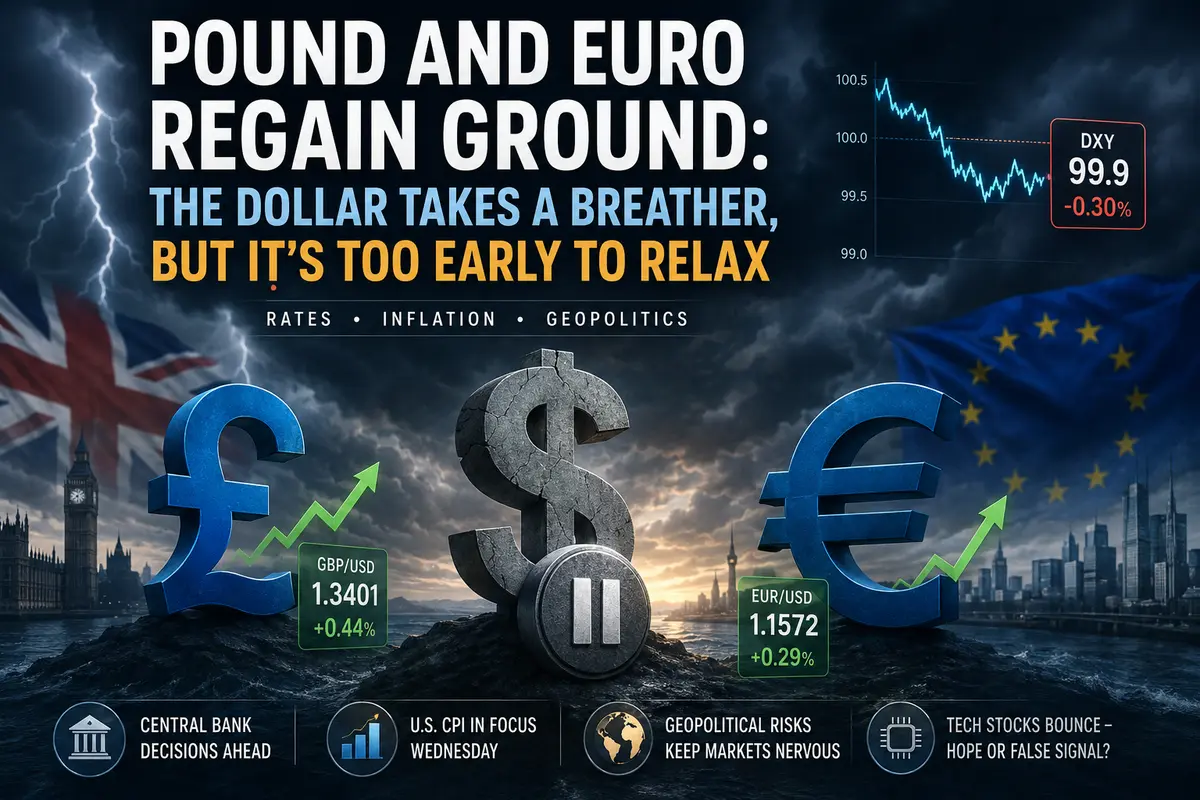
The pound sterling rose to $1.3375, gaining 0.20%. The euro strengthened to $1.1395, adding 0.13%. These are modest moves, but they reflect an important shift in market sentiment: the dollar, which has dominated the markets in recent weeks, is beginning to lose momentum.
However, pressure from the dollar remains the dominant force. The renewed blockade of the Strait of Hormuz pushed Brent crude oil to $84 per barrel, providing additional support for the US currency. In this article, we will examine all the factors affecting the pound and the euro, assess their prospects, and attempt to determine where these currencies may move in the coming days.
The Pound: Modest Growth Driven by Broader Dollar Dynamics
A 0.20% Increase
The pound sterling rose to $1.3375, gaining 0.20%. This was a relatively small increase, but it occurred against the backdrop of a broader weakening of the dollar ahead of the release of inflation data.
The pound’s advance was driven by general US dollar dynamics rather than any factors specific to the United Kingdom. British political and economic developments had almost no impact on Tuesday’s trading.
Lack of Domestic Drivers
No significant UK economic data were published on Tuesday, and there were no notable comments from Bank of England officials. The pound moved primarily in line with broader US dollar trends.
This means that any movements in the pound over the coming days will depend on external...