Bar Pipa
We pay for a post of 10$

Pip Bar - blogs with payment for posts. Quotes, forum, and analysis

joy

Auction Mechanics — Open/Close Crosses and Volatility Halts

Financial markets do not operate as a continuous, uninterrupted stream of uniform activity. Instead, they function through distinct auction phases that transition from periods of intense price discovery to formal market closures and back again. Understanding the auction mechanics that govern market opens, market closes, and regulatory volatility halts is essential for any trader seeking to avoid the severe execution traps that occur during these transition windows.

Unlike standard intraday trading where liquidity is continuously matched across the order book, auction mechanics rely on centralized call auctions designed to aggregate unexecuted orders and determine a single, fair clearing price for the entire market.

The Opening Cross: Price Discovery and Overnight Accumulation

The transition from the overnight closed market to the official cash session open is managed through an opening auction, frequently referred to as the Open Cross.

Throughout the overnight session, news releases, geopolitical developments, and macroeconomic data accumulate. Institutional and retail participants submit orders that sit in the limit order book as unexecuted instructions. During the pre-market phase, these orders are accumulated without executing immediately. The exchange matching engine constantly calculates an indicative clearing price—the exact price level where the maximum volume of buy and sell orders can be matched simultaneously.

As the official open approaches, trading desks flood the system with market-on-open (MOO) and limit-on-open (LOO) orders. This massive influx of accumulated liquidity creates a volatile supply and demand imbalance. When the opening bell rings, the matching engine executes all eligible orders at a single opening price.

For active traders, attempting to trade the immediate open is hazardous. The opening cross often produces aggressive price spikes that immediately reverse once the initial backlog of overnight orders is cleared. Waiting for the initial opening range to establish—typically the first fifteen to thirty minutes of the session—allows the market to...

Continue reading...
0
0
John Madnes

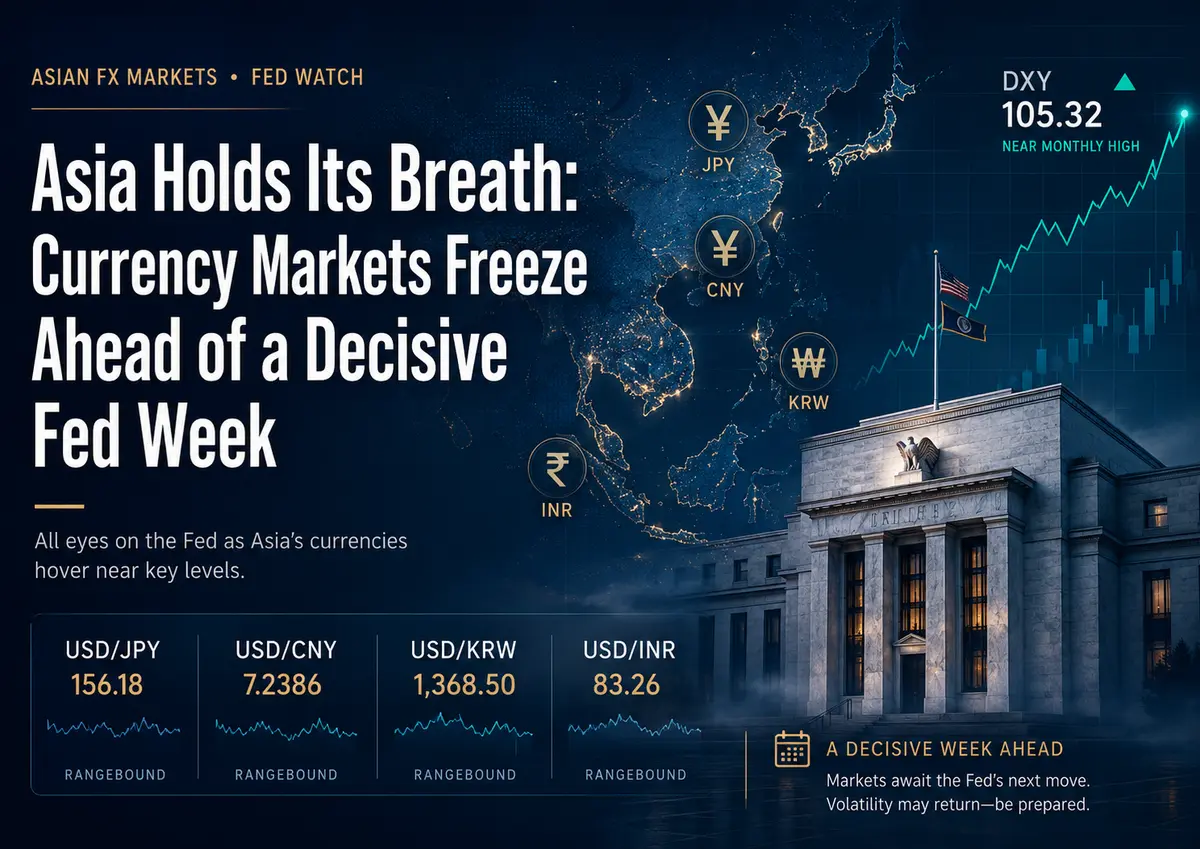
Asia Holds Its Breath: Currency Markets Freeze Ahead of a Decisive Fed Week

Asia Holds Its Breath: Currency Markets Freeze Ahead of a Decisive Fed Week

Tuesday Morning: The Calm Before the Storm

Tuesday 28.07.2026 began across Asian currency markets with the kind of unusual silence that typically precedes major events. Most regional currencies traded within narrow ranges, as though holding their breath ahead of the US Federal Reserve meeting scheduled for Wednesday. Meanwhile, the US dollar remained close to a one-month high, creating tension that could be felt in every movement of the exchange rates.

The US Dollar Index fell by 0.1% to 101.46. The decline was barely noticeable, but it highlighted the market’s indecision. Investors were reluctant to open new positions, preferring to wait for signals from the Fed. Even the decline in oil prices, which normally reduces inflation concerns and may put pressure on the dollar, failed to move the market out of its standstill. Traders remained frozen in anticipation.

Markets currently estimate the probability of a 25-basis-point Fed rate increase on Wednesday at approximately 38%. This is not the dominant scenario, but the probability is high enough to make investors cautious. Should the Fed raise rates, the decision could surprise many market participants and trigger sharp movements across global markets. Should rates remain unchanged, attention will shift to comments from Chair Kevin Warsh, who may provide signals regarding the future direction of monetary policy.

Additional uncertainty comes from the upcoming US GDP and core PCE inflation data, which are also scheduled for release this week. These indicators may provide further guidance on monetary policy and influence investor expectations.

The Yen Near Multi-Year Lows: Awaiting the Bank of Japan

The Japanese yen remains the main victim of the current market environment. USDJPY ... was virtually unchanged at 163.72 yen, keeping the Japanese currency close to multi-year lows. Traders are eagerly awaiting the Bank of Japan’s decision on Friday, hoping to receive new guidance regarding...

Continue reading...
0
0
BCR

Daily Analysis 28 July 2026 | Oil Drops 6%, Gold Trades Below $4,100 as Dollar Stays Supported

Daily Analysis 28 July 2026 | Oil Drops 6%, Gold Trades Below $4,100 as Dollar Stays Supported

Currency & Commodity Analysis:


US Dollar Index:


The US dollar recorded its largest weekly gain since mid-June last week, rising 0.7%. The US dollar index rose to 101.45 last week, mainly supported by rising oil prices and inflation concerns. A stronger dollar pressured non-dollar currencies, while the yen continued to struggle near 40-year lows. The dollar index closed around 101.45, with high oil prices reshaping inflation expectations, which in turn reinforced bets on interest rate hikes, providing support for the dollar. The dollar's recent support has primarily come from oil prices. A new round of attacks in the Iranian conflict pushed Brent crude to $102 a barrel, reigniting inflation concerns. Market pricing for a rate hike at this week's Fed meeting surged from 12.8% a week ago to 35.8%, although June inflation data had briefly eased market expectations, but escalating geopolitical tensions quickly reversed this optimism. The perception that the US economy is more resilient to energy price shocks than Europe and Japan further solidifies the dollar's relative advantage.


The Fed is expected to keep interest rates unchanged this week, but at least two members are expected to vote hawkishly against it, as some members are losing patience with persistently high inflation. This assessment suggests that even if rates remain unchanged, the signals from the meeting may lean hawkish, providing additional support for the dollar. The US dollar index has rebounded from its low of 95.56 at the beginning of the year to a high of 101.80 in June, currently trading around 101.40, between 101.53 (last week's high) and the psychological level of 101. The MACD indicator is near the zero line, lacking a clear directional signal in the short term, and maintaining an overall slightly bullish oscillating pattern. On the upside, watch the 101.53 (last week's...

Continue reading...
0
0
joy

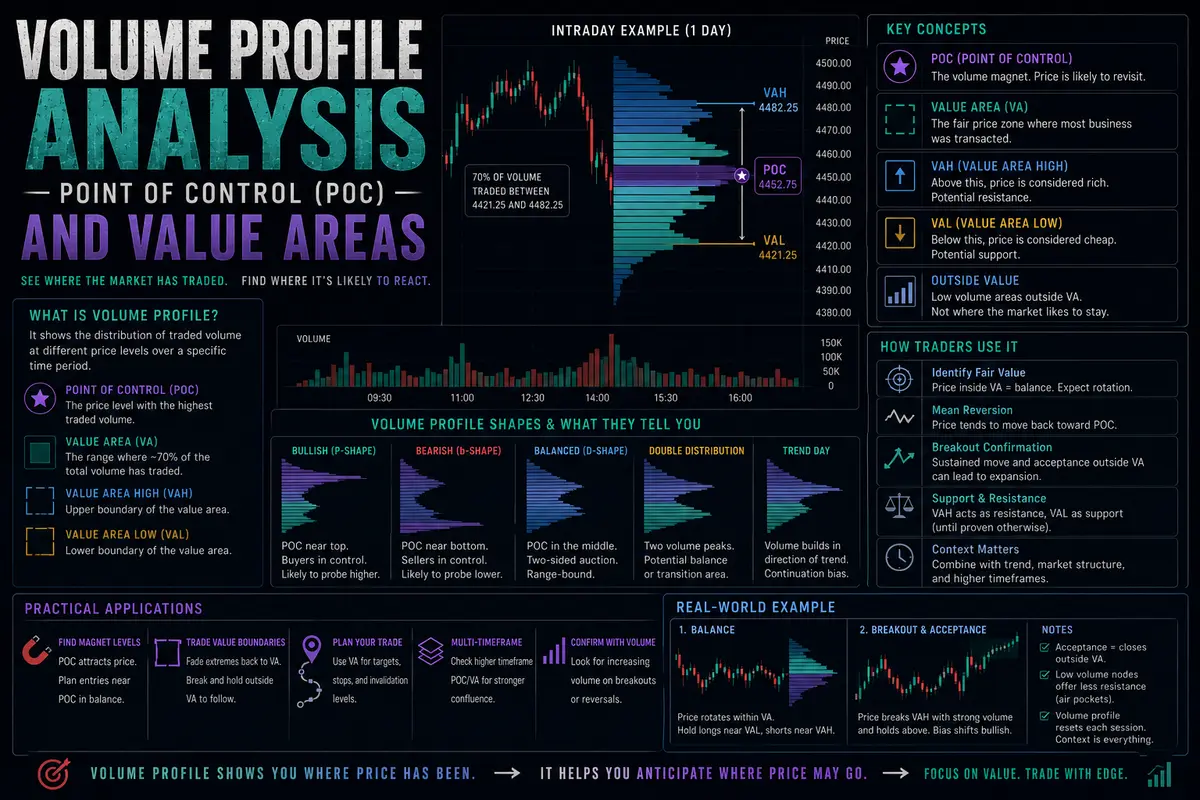
Volume Profile Analysis — Point of Control (POC) and Value Areas

Volume Profile Analysis — Point of Control (POC) and Value Areas

When standard technical analysis relies exclusively on time-based volume charts displayed along the bottom of a price graph, it measures trading activity horizontally. This approach tells you how much volume was traded during a specific 5-minute or 1-hour candle, but it obscures where volume was distributed relative to absolute price levels. Volume Profile flips this paradigm entirely by plotting trading activity on the vertical axis, revealing precisely how much volume accumulated at every specific price tier over a given session or multi-day period.

By mapping volume against price rather than time, Volume Profile shifts a trader's focus from when trades occurred to where fair value was established and accepted by the market. Mastering key volume profile concepts—such as the Point of Control, Value Area, and Volume Nodes—transforms structural chart reading into an auction market analysis framework.

The Core Architecture of Volume Profile

Unlike a standard time-based volume histogram that extends vertically beneath each candle, a Volume Profile histogram extends horizontally outward from the price scale. Every horizontal bar represents the total volume of contracts or shares traded at that exact price level, regardless of whether those trades occurred during the morning session or late in the afternoon.

This structural display identifies how market participants negotiate value over time:

  • Auction Market Theory Principle: Markets are continuous auctions designed to facilitate trade. When buyers and sellers agree on price, volume accumulates heavily. When price is deemed unfair or too high/low, volume thins out rapidly, leading to fast price rejection or acceptance.

  • The Value Area: Statistical theory dictates that a normal distribution accounts for roughly 68% of all data points. In Volume Profile analysis, the Value Area represents the price range where 70% (or standard exchange conventions of 68%) of all total volume was transacted during the specified timeframe.

Key Volume Profile Components...

Continue reading...
0
0
joy

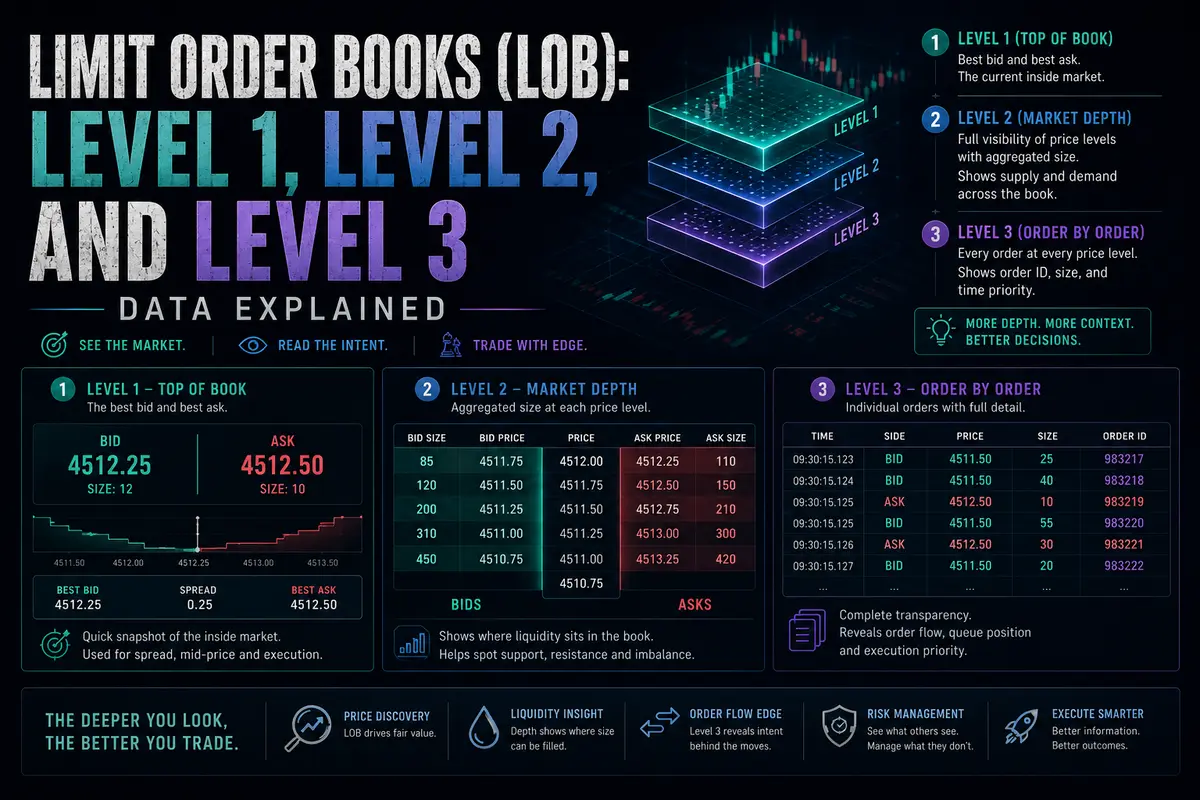
Limit Order Books (LOB): Level 1, Level 2, and Level 3 Data Explained

Limit Order Books (LOB): Level 1, Level 2, and Level 3 Data Explained

When most retail market participants look at financial data feeds, they rely on basic candlestick charts and volume histograms. While these tools provide a visual history of past price action, they obscure the micro-structure of the market happening in real time. Beneath every chart lies the Limit Order Book (LOB)—a dynamic, centralized electronic ledger where all active buy and sell orders are queued, matched, and executed.

To gain an informational edge in modern electronic markets, a trader must understand how market data is structured across different tiers. Market data feeds are universally broken down into three distinct levels: Level 1, Level 2, and Level 3. Each tier provides a progressively deeper window into the mechanics of institutional execution, liquidity distribution, and matching engine operations.

Level 1 Data: Top-of-Book Pricing and Basic Quotes

Level 1 data, commonly referred to as Top-of-Book data, represents the most basic feed available to retail traders. It provides real-time information regarding the absolute best prices currently available on both sides of the market.

An L1 data feed displays three core metrics:

  1. The Best Bid: The highest price any passive market participant is currently willing to pay to buy the asset.

  2. The Best Ask (or Offer): The lowest price any passive market participant is currently willing to accept to sell the asset.

  3. The Last Sale Price and Volume: The exact price and size of the most recently executed transaction.

While Level 1 data is sufficient for swing traders or long-term investors who execute infrequently, it is entirely inadequate for active short-term traders. L1 hides the actual volume of resting liquidity behind the top price quote. For example, if the best bid is $100.00, an L1 feed tells you that buyers are willing to pay $100.00, but it completely conceals whether there are 10 shares or 10,000 shares...

Continue reading...
0
0
joy

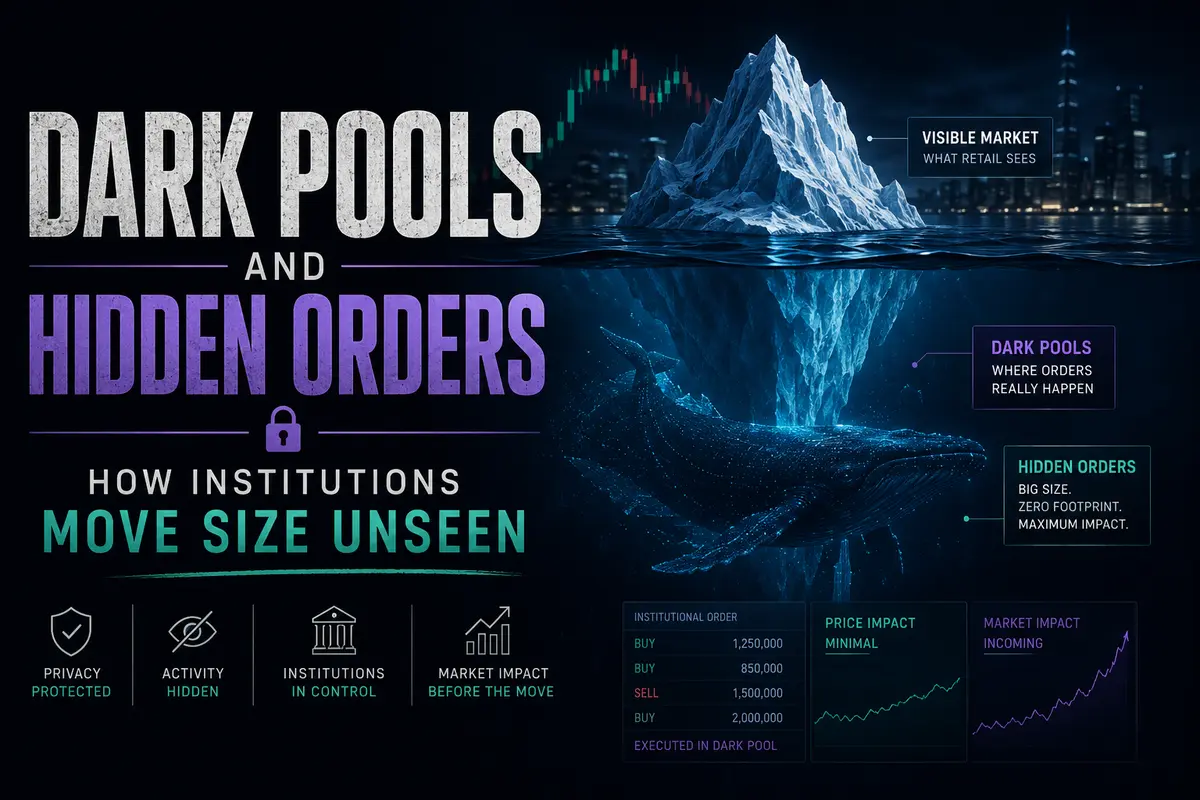
Dark Pools and Hidden Orders — How Institutions Move Size Unseen

Dark Pools and Hidden Orders — How Institutions Move Size Unseen

When a large institutional asset manager needs to acquire or liquidate millions of shares in a publicly traded company, they face a severe execution dilemma. If the fund manager dumps a massive multi-million-dollar order directly onto a lit exchange like the New York Stock Exchange or NASDAQ, the transparent order book immediately reveals their intentions. High-frequency trading algorithms and opportunistic retail participants will detect the size imbalance, front-run the order, buy up all the available asks, and force the institution to execute at drastically inflated average prices.

To prevent this severe market impact, institutional capital turns to alternative execution venues. These venues are known as dark pools, and the orders executed within them rely on hidden order types designed to mask intentions from public scrutiny. Understanding how dark pools and hidden orders operate provides a critical window into institutional execution dynamics that never show up on a standard public price chart.

The Architecture of Lit Exchanges vs. Dark Pools

To understand why dark pools exist, you have to contrast them with standard lit exchanges. A lit exchange operates under a completely transparent mandate. Every single bid, ask, and completed trade is published in real time via public market data feeds. Anyone sitting at a retail trading terminal can view the Level 2 order book, see the resting limit orders, and track volume as it happens.

A dark pool, officially classified as an Alternative Trading System (ATS), is a private financial exchange or forum for matching security trades where pre-trade transparency is completely eliminated.

  • Pre-Trade Anonymity: When an institution places an order into a dark pool, no other market participant can see the price, size, or direction of the order. The resting liquidity is entirely invisible.

  • Post-Trade Reporting: Trades executed inside a dark pool are eventually reported to public tape...

Continue reading...
0
0
joy

Market Makers vs. Taker Orders — The Mechanics of Spread Capture and Execution Friction

Market Makers vs. Taker Orders — The Mechanics of Spread Capture and Execution Friction

Every transaction in a centralized financial market boils down to a fundamental compromise between price and time. When you interact with an exchange matching engine, you are forced to make a choice: do you want to guarantee your execution price, or do you want to guarantee your execution speed? You cannot demand both. This exact friction point divides all market participants into two distinct categories: Liquidity Makers and Liquidity Takers.

Understanding the structural relationship between these two forces is not just a theoretical exercise. It directly dictates the fees you pay, the slippage you suffer, and the underlying reasons why order books thin out during volatile periods.

The Market Maker: Capitalizing on Patience

A market maker is any participant who provides resting liquidity to the order book. While the term often conjures images of massive high-frequency trading firms or tier-one bank dealing desks, the mechanical definition is much simpler. The moment you place a passive limit order that sits inside the queue waiting to be filled, you are acting as a market maker. You are adding depth to the market.

Professional market makers operate by simultaneously quoting limit orders on both sides of the book—stacking bids below the current price and offers above it. Their primary objective is to capture the bid-ask spread. If a market maker successfully buys at the bid and sells at the ask thousands of times a day, they harvest the fractional difference between those two prices, accumulating massive, low-risk profits over time.

However, providing liquidity carries a severe structural vulnerability: Inventory Risk. When a market maker places passive limit orders, they are essentially offering a free option to the rest of the market. They are stating, "I am willing to transact at this price whenever you are ready." If macroeconomic news breaks or an...

Continue reading...
0
0
joy

The Anatomy of a Liquidity Sweep — Stop Runs vs. Genuine Breakouts

The Anatomy of a Liquidity Sweep — Stop Runs vs. Genuine Breakouts

To the untrained eye, financial markets often appear chaotic and unpredictable. Price consolidates within a tight range for hours, suddenly spikes aggressively past a clear resistance level, and then abruptly reverses, dumping back into the range and leaving breakout traders trapped in losing positions. Retail traders routinely view this price action as a targeted manipulation directed at their personal stop loss. In reality, this dynamic is the natural consequence of institutional execution constraints operating within a central limit order book.

Large institutional market participants—such as hedge funds, sovereign wealth funds, and algorithmic market makers—face a fundamental challenge: they cannot simply enter a massive multi-million-dollar position at a single market price without driving execution costs catastrophically against themselves. To fill large orders, institutions require deep pools of counterparty liquidity. A liquidity sweep is the deliberate or structural process by which price is pushed into dense clusters of resting orders to unlock the volume required to fill institutional size.

The Mechanics of Structural Liquidity Accumulation

Every technical chart pattern is a map of liquidity distribution. Whenever price forms a obvious swing high, a double top, or a prolonged consolidation boundary, retail trading rules dictate standard risk management behaviors:

  • Traders holding short positions place their protective stop loss orders just above prominent technical high points. A protective stop loss on a short position is a stop-buy order.

  • Breakout traders place pending buy-stop orders above those same resistance levels, intending to buy as soon as momentum confirms a breakout.

This concentration of stop-buy and entry-buy orders creates a dense pool of resting buy liquidity sitting just beyond obvious technical swing highs. Conversely, beneath prominent swing lows or support levels lies a matching pool of sell liquidity, composed of protective sell-stops from long positions and sell-stop entry orders from breakout short sellers.

For a...

Continue reading...
0
0
joy

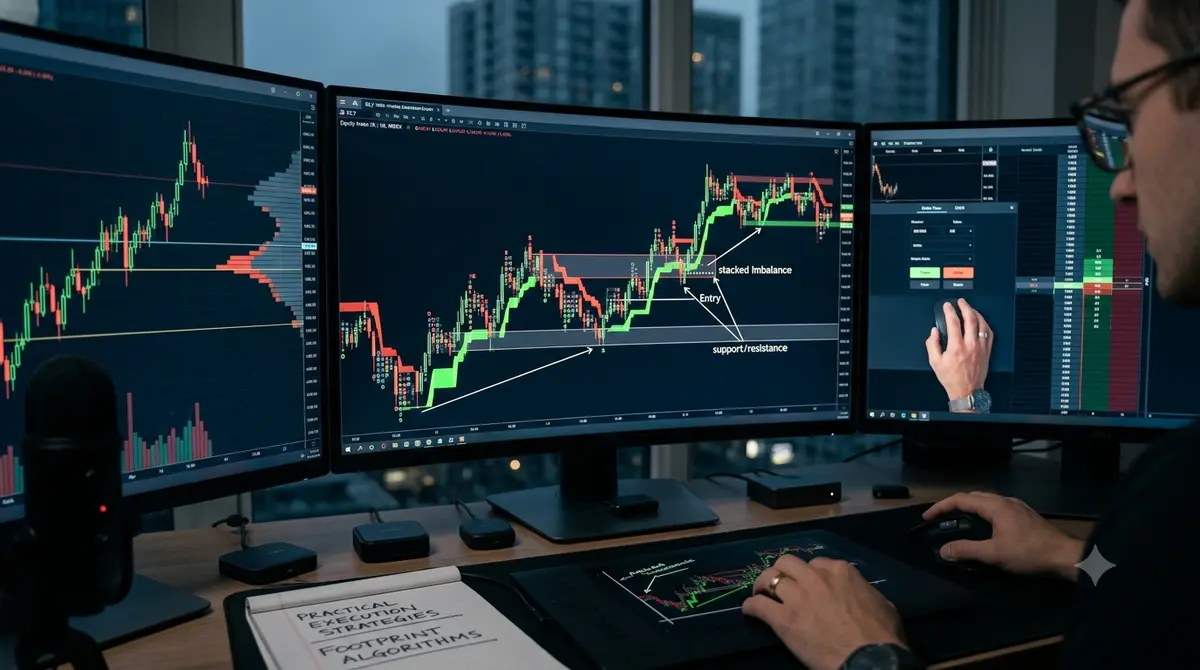
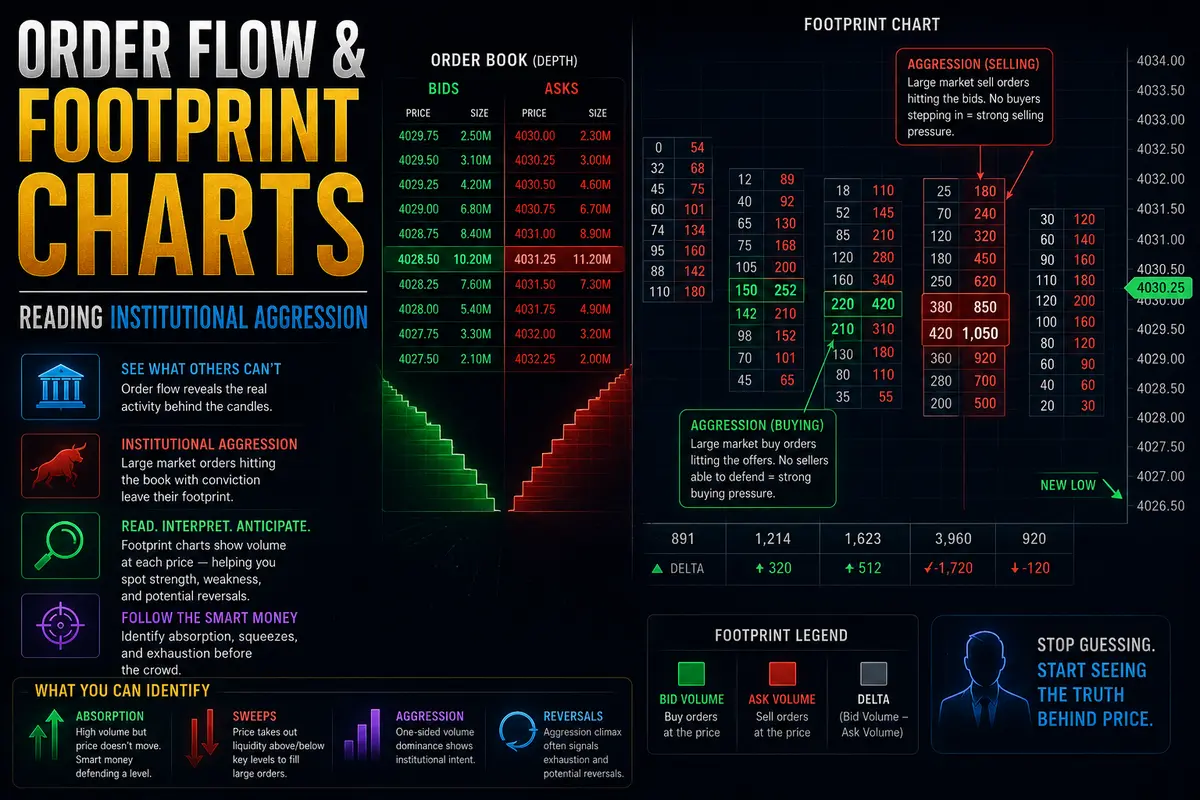
Order Flow & Footprint Charts — Reading Institutional Aggression

Order Flow & Footprint Charts — Reading Institutional Aggression

Standard candlestick charts tell you where price went over a fixed period, but they hide the internal mechanics of how it got there. A green candle shows that the close was higher than the open, but it obscures whether that move was driven by a wave of aggressive market buyers lifting the offer or simply by passive sellers pulling their liquidity out of the book. Order flow trading, particularly through footprint charts, opens up the interior of every candle to reveal the exact volume executed at every price level on both sides of the spread.

By analyzing the real-time interaction between aggressive market orders and passive limit orders, footprint charts provide a granular view of market participant intent. Mastering this tool allows traders to spot institutional accumulation, identify true absorption at key support and resistance zones, and enter trades alongside aggressive flow rather than reacting to lagging indicators.

The Footprint Mechanics: Bids, Asks, and Diagonal Matching

A footprint chart (also known as a cluster chart or volume footprint) displays two primary columns of numerical data inside each individual candlestick body at every price level. To read these numbers accurately, you must understand how orders are filled on an electronic exchange matching engine.

On a standard central limit order book, transactions are completed diagonally:

  • The Left Column (Executed on the Bid): Displays the total volume of contracts or shares traded via aggressive market sell orders hitting passive limit buy orders at that specific price.

  • The Right Column (Executed on the Ask): Displays the total volume of contracts or shares traded via aggressive market buy orders lifting passive limit sell orders at that specific price.

Because the bid sits one tick lower than the offer, the matching engine compares the aggressive market sell volume at price $X$ against the aggressive market buy...

Continue reading...
0
0
pixel

Stablecoins Cost Banks Their Deposits: 9 Reasons Banks Are Building Tokenized Deposits

Stablecoins Cost Banks Their Deposits: 9 Reasons Banks Are Building Tokenized Deposits

Stablecoins, tokenized deposits, and deposit tokens are all digital dollars, but they are not the same instrument even though many institutions talk about them like they are.

In April, the FDIC proposed something that received minimal coverage outside of law firm memos and discussion from those in the industry. In short, it said, the underlying technology used to record a liability is irrelevant to deposit insurance. Whether a deposit is tracked on a distributed ledger or within a legacy core banking database, it receives identical treatment as long as it satisfies the statutory definition of a deposit.

Two months later, JPMorgan, Citi, Bank of America, Wells Fargo and a dozen others said they were building a shared tokenized deposit network run by The Clearing House, targeting the first half of 2027. A separate group of regionals (Huntington, First Horizon, KeyCorp, M&T, Old National) is piloting a retail version this quarter.

The question used to be whether any of this was real, but now it's which digital asset instrument, for which client, on which rail. That's a harder question, because the three things people keep lumping together do very different things to your balance sheet.


WHAT BANKS GET FROM STABLECOINS

For permitted issuers, holding the underlying cash and Treasuries represents a sticky, low-risk balance that generates fee income. When building an internal business case, however, it is critical to note that these reserves lack pass-through insurance for token holders, a point explicitly detailed in the FDIC proposal.

Because GENIUS envisions issuance via bank subsidiaries, white-labeling offers an accelerated route for institutions possessing distribution channels but lacking a native product. Capitalizing on fiat conversion and the associated remittance corridors presents clear fee opportunities. Furthermore, a distinct customer segment (including crypto exchanges, crypto treasuries, PSPs, and market makers) already functions using stablecoins and...

Continue reading...
0
0
Navigation menu
instaforex banner