Bar Pipa
We pay for a post of 10$

Gold Falls Amid Tensions Surrounding Iran

Gold Falls Amid Tensions Surrounding Iran
When War Stops Being Precious

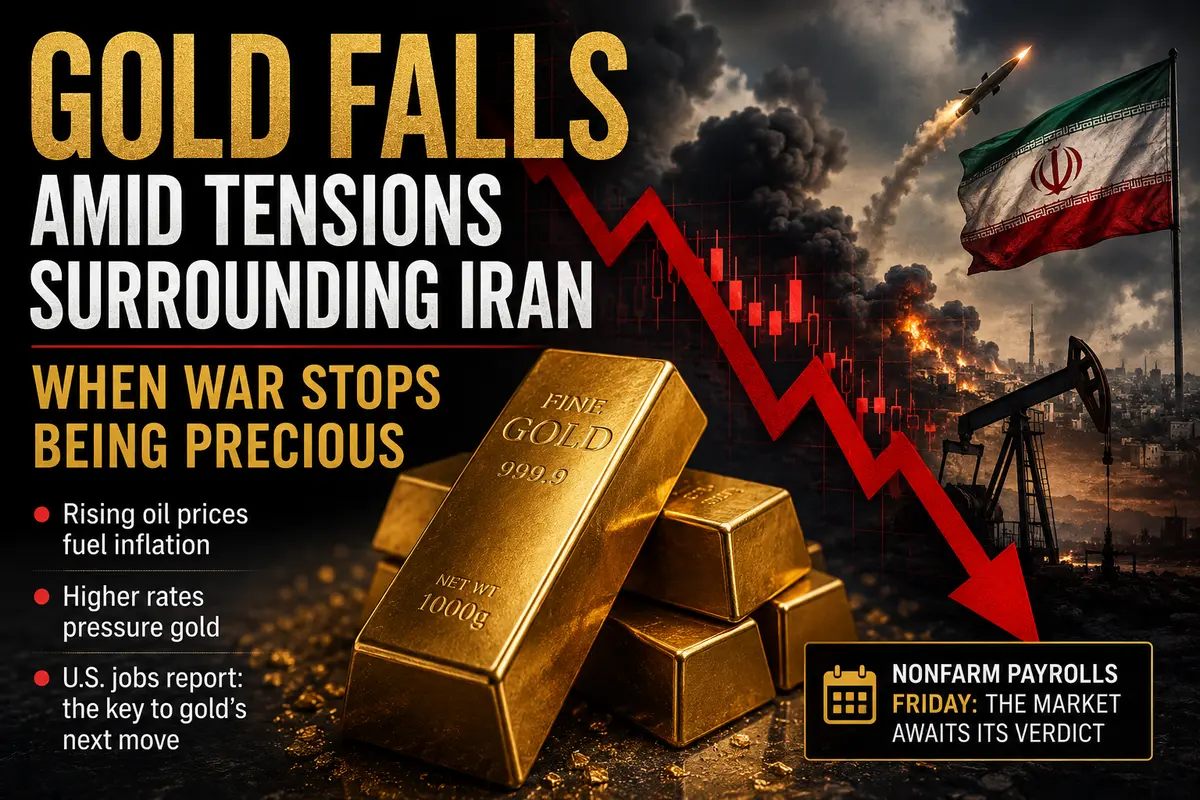
Friday began on a disappointing note for precious metals markets in Asia. Gold, which has already been struggling this week, moved lower once again. Spot gold fell 0.8% to $4,440.84 per ounce, while futures declined by the same margin to $4,467. And this is happening even as the Middle East remains engulfed in conflict.

At first glance, war, missile strikes, military operations, and stalled negotiations should provide the perfect environment for gold to rally. Investors are traditionally expected to flock to the yellow metal as a safe haven. That is how it has always worked. That is what textbooks teach. That is what market logic suggests. But not today—and not this week.

The paradox has a simple explanation. The conflict between the United States and Iran, which has been ongoing for several months, has ceased to be a source of uncertainty. Instead, it has become a source of inflation. And inflation means higher interest rates. Higher interest rates, in turn, are a major headwind for gold.

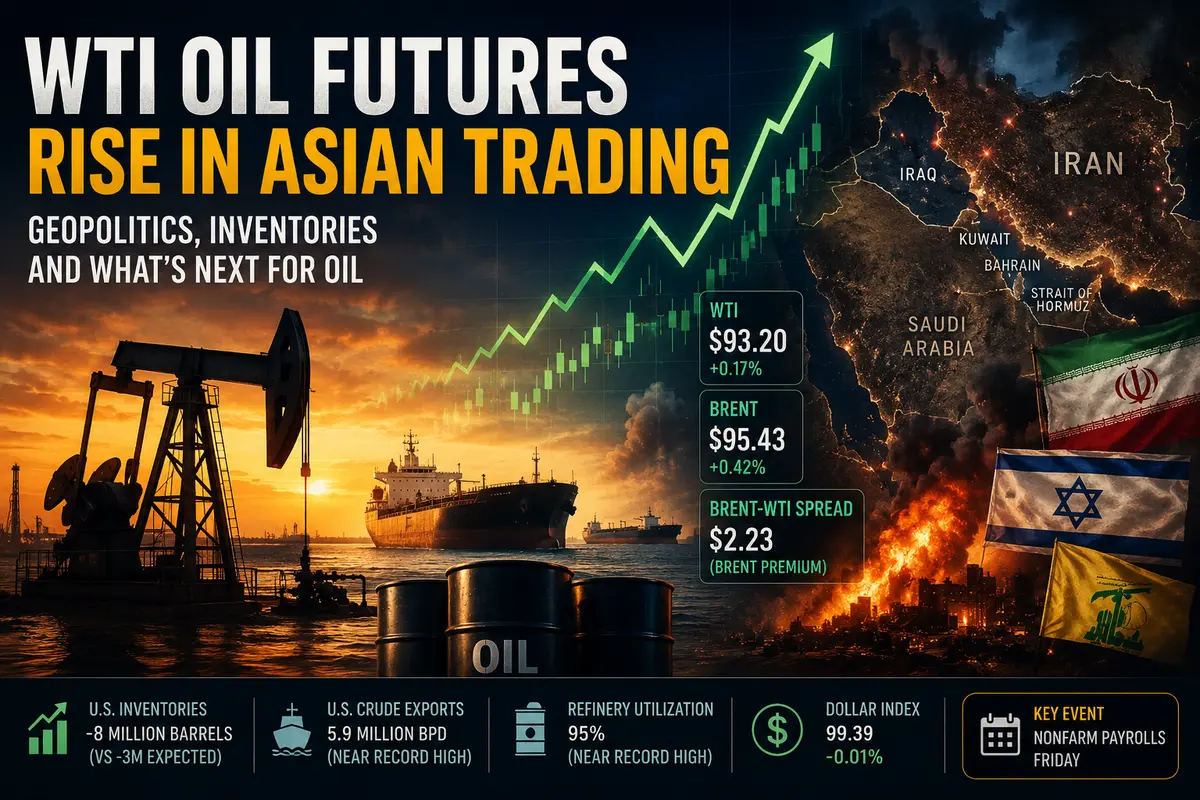
Gold is down approximately 2.2% for the week, marking its worst performance since early May. The reason is not the absence of geopolitical risks, but rather their abundance. The market is no longer afraid of war itself. It is afraid of what war does to oil prices and, through oil, to inflation and interest rates.

Let’s examine how a conflict in the Middle East has become a bearish factor for gold—and what may lie ahead for the yellow metal following the release of key U.S. employment data.

Middle East: Hope Is Gone, Long Live Inflation

Developments in the Middle East have been rapid and, for those hoping for peace, discouraging. Hopes for a U.S.–Iran agreement, which still seemed realistic earlier in the week, had all but vanished by Friday.

...

Continue reading...
0
0

WTI Crude Oil Futures Rise in Asian Trading

WTI Crude Oil Futures Rise in Asian Trading
A Morning That Began with Hope

Friday’s Asian oil markets opened with cautious but steady gains. Futures for West Texas Intermediate (WTI) crude oil, the primary benchmark for the U.S. market and beyond, rose 0.17% to $93.20 per barrel. It is hardly a spectacular rally—just seventeen hundredths of a percent, more of a tremor than a surge. But after several days of volatile price swings, traders are willing to welcome any green number on their screens.

The European benchmark, Brent crude, appeared somewhat stronger. The August Brent contract gained 0.42%, climbing to $95.43 per barrel. The price spread between Brent and WTI widened to $2.23 per barrel in Brent’s favor. A week ago, the spread was narrower, below $2. The widening gap suggests that geopolitical risks concentrated around key Brent supply routes continue to weigh more heavily on Brent than on WTI, which is produced in the relatively secure environment of Texas.

The U.S. dollar, which has pressured commodity markets in recent days, weakened slightly on Friday morning. The U.S. Dollar Index futures slipped 0.01% to 99.39. The decline is tiny and almost imperceptible, but even such a modest move gives oil prices some breathing room.

The technical picture remains tense. WTI support stands at $88.45, a level sellers failed to break in recent sessions. Resistance is located at $97.00. With WTI trading at $93.20, prices sit roughly in the middle of that range, leaving traders with room for maneuver.

The key question is what will trigger the next move. Geopolitics? U.S. inventory data? Or perhaps long-awaited news regarding negotiations between Iran and the United States? As usual, Asian traders were the first to react and have already begun positioning themselves ahead of developments.

Middle East: The Calm Before the Storm

The geopolitical backdrop remains the...

Continue reading...
0
0

Sterling Gains, but Its Position Looks Fragile

Sterling Gains, but Its Position Looks Fragile
A Small Green Ray Through the Clouds

Thursday brought a modest sense of relief to holders of British pounds and euros. After several days in which the U.S. dollar bulldozed its way through virtually every major currency, the market finally paused. Sterling gained 0.27% against the dollar, reaching 1.3459. The euro performed slightly better, rising 0.35% to 1.1640.

These are modest, almost symbolic moves. Yet after the previous day's decline, even such gains felt like a welcome gift.

Still, don't be fooled by the green numbers on the screen. The pound and the euro remain on extremely shaky ground. They resemble a person walking across thin ice—every next step could be the last. The fundamental drivers behind these currencies have not changed. The dollar remains strong. Geopolitical risks remain severe. And economic data from Europe and the UK continue to disappoint.

On Thursday, the dollar merely took a breather. Investors paused ahead of Friday's key event—the U.S. nonfarm payrolls report. This release could either reinforce the dollar's recent momentum or call it into question. Few traders are willing to establish major positions ahead of such uncertainty. As a result, the dollar stood still while the pound and euro managed a modest rebound.

But let's take a closer look. Why does sterling remain so vulnerable? Why is the euro struggling to strengthen despite its gains? And what lies ahead for these currencies after the U.S. employment data is released?

Sterling: Recovering After a Blow

Let's begin with the pound. Thursday's modest rise followed a sharp decline the previous day.

On Wednesday, sterling fell heavily after disappointing UK services-sector PMI data.

The figures were alarming. For the first time in more than a year, the index dropped below the psychologically important 50-point threshold. A reading above 50 signals expansion; below 50 indicates...

Continue reading...
0
0

Asia Defends Its Currencies Amid a Strong Dollar and Expensive Oil

Asia Defends Its Currencies Amid a Strong Dollar and Expensive Oil
A Storm That Won’t Let Up

Asia wakes up on Thursday, and the first thing traders see on their screens is red once again. Regional currencies have fallen for a fourth consecutive day. Bloomberg’s Asian currency index—a barometer of the financial health of hundreds of millions of people across the region—continues its relentless slide. The biggest losers are the South Korean won and the Indonesian rupiah, but few others are faring much better.

Behind these numbers lies a simple and uncomfortable story. The dollar is strong. Oil is expensive. Capital is flowing out of Asia and into the United States. Meanwhile, local central banks are trying to preserve what they can. Interventions, warnings, interest-rate hikes—every tool is being deployed. So far, however, the results have been limited.

Asian countries have found themselves in a perfect storm. Two powerful forces are putting simultaneous pressure on their currencies. The first is the policy stance of the U.S. Federal Reserve. The American economy has remained stronger than expected, inflation remains stubborn, and the Fed is not only delaying rate cuts but is even considering further hikes. The second factor is the Middle East. Rising tensions between the United States and Iran are pushing oil prices higher. For Asia, which imports most of the oil it consumes, expensive oil delivers a triple blow: higher inflation, worsening trade balances, and weaker currencies.

Regional authorities are fighting back. Some are intervening directly, selling dollars from their reserves and buying local currencies. Others are raising interest rates to make their currencies more attractive to investors. Some are imposing administrative measures to limit capital outflows. Yet the U.S. dollar remains a formidable opponent. It is difficult to fight when domestic economies are slowing and inflation is rising.

South Korea: Words and Actions

South Korea, Asia’s fourth-largest economy and...

Continue reading...
0
0
NorthRay

I Wanted a Robot to Trade for Me. I Almost Bought the “Magic Button.” Good Thing I Stopped in Time.

I Wanted a Robot to Trade for Me. I Almost Bought the “Magic Button.” Good Thing I Stopped in Time.

Hi, this is NorthRay.💪

Do you know what I was looking for in my first days of trading?

Not a strategy. Not knowledge. Not discipline.

I was looking for a magic button.

A button that would open trades for me. One that never sleeps, never gets scared, and never makes stupid mistakes. One that makes money while I drink coffee or sleep.

And I found one. Or rather, someone offered it to me.

“Trading robot with a 95% win rate.”

“Copy trading — copy professional traders and earn money.”

“Passive income of 30% per month.”

I almost fell for it because it sounded perfect.

But then I asked myself one question:

“If it’s really that simple and profitable, why isn’t every trader already a millionaire?”

So I started digging. And here’s what I learned.

What Are Trading Robots (Expert Advisors)?

A trading robot (or Expert Advisor) is a program that automatically opens and closes trades according to a predefined algorithm.

You install it in MetaTrader 4, turn it on, and the robot analyzes the chart, presses Buy and Sell, and sets stop-losses by itself.

No involvement from you. 24/5. No emotions. No fear. No greed.

Sounds like a beginner’s dream, right?

I downloaded a free robot, installed it on a demo account, and turned it on.

It opened a trade. Then another. Then another.

An hour later, I checked the results: three losing trades and one winning trade. Overall result: negative.

I thought:

“Maybe I downloaded a bad robot. Maybe I should buy a paid one?”

That’s when I started doing real research.

How I Almost Bought a Robot (And Why I’m Glad I Didn’t)

I visited a website selling a “super robot with 90% accuracy.”

Beautiful website. Equity growth charts. Reviews (probably fake). A 70% discount “today only.”

Price:...

Continue reading...
0
0
BCR

Daily Analysis 5 June 2026 | Dollar Strength, Oil Rally And NFP In Focus

Daily Analysis 5 June 2026 | Dollar Strength, Oil Rally And NFP In Focus

Currency & Commodity Analysis:


US Dollar Index


The US dollar index traded around 99.40 on Thursday, near a two-month high, as stronger-than-expected US labor market data reinforced expectations of a tightening Federal Reserve policy. The latest ADP report showed that private sector employment increased by 122,000 in May, exceeding expectations and marking the strongest reading since January 2025. Earlier this week, Jolts data revealed that job openings rose to their highest level since November 2024 in April. Investors are now awaiting Friday's non-farm payroll report for further insight into labor market conditions. The dollar also continues to be supported by escalating tensions in the Middle East, which have kept oil prices high and added to inflationary pressures. The market currently assesses an 85% probability of a 25 basis point rate hike by the Fed before the end of the year, up from 60% a week ago.


After months of consolidation near multi-month lows, the US dollar index may be entering a broader recovery phase. If inflation remains high and the Middle East conflict continues to disrupt energy markets, the likelihood of the US dollar returning above the 100.00 level in the coming weeks will increase. The US dollar index is currently trading near a high of 99.50, with short-term resistance at the previous high of 99.55. The medium-term resistance is at 100.00 (a psychological level), while support lies at the psychological level of 99.00 and the 99.18 area (the 9-day moving average). The MACD remains above the zero line, with the DIFF above the DEA, indicating a slight continuation of bullish momentum. The RSI is at 58, above the 50 level, indicating bullish dominance but not yet overbought.


Today, consider shorting the US dollar index at 99.52, with a stop-loss at 99.65 and targets at 99.20...

Continue reading...
0
0

Meta Delays Release of New AI Model for Developers

Meta Delays Release of New AI Model for Developers
Promises That Haven’t Materialized

The world of artificial intelligence has grown accustomed to a relentless pace. Every week brings a new breakthrough. Every month sets a new benchmark. Companies compete to launch smarter models, more convenient APIs, and cheaper tokens. In this race, Meta Platforms has occupied the position of a confident middle-ground player—not the fastest, but not the slowest either.

Until now.

According to information published by The Wall Street Journal on Wednesday, Meta has repeatedly postponed the release of its latest AI model for developers. The delay has stretched to nearly two months, and more importantly, the company still has not committed to a new release date.

What is behind this delay? Why has a company that recently promoted its openness and rapid development suddenly gone quiet and started pushing back deadlines?

As is often the case in technology, the answer is more complicated than it appears. This is not simply a matter of unfinished code. It is a strategic pause—perhaps even a reassessment of the company’s entire approach.

The story began in April, when Meta unveiled its newest AI model, Muse Spark, with considerable fanfare. The company promised a model capable of competing with OpenAI’s GPT-4 and Google’s Gemini while remaining partially open, consistent with Meta’s broader philosophy. Developers around the world eagerly anticipated the launch of an API that would allow them to integrate Muse Spark’s capabilities into their own applications. The expected timeline was ambitious: the API would be released alongside the model itself.

April came and went. Then May.

The API never arrived.

A Promise Left Unfulfilled

According to sources cited by The Wall Street Journal, the head of Meta’s AI division assured developers that the release was coming “soon.” That statement was made nearly two months ago.

“Soon” has stretched considerably.

Developers who...

Continue reading...
0
0
Lin Brings

Nvidia and Hyundai Discuss an AI Center in South Korea

Nvidia and Hyundai Discuss an AI Center in South Korea
When Two Giants Sit Down at the Same Table

In the world of high technology, some developments make markets pause and watch closely. The ongoing talks between Nvidia and Hyundai Motor Group are one of those moments. Not because the two companies have never worked together before—they have, and quite extensively. Rather, it is because the scale of what is now being discussed goes far beyond a standard business partnership.

At the center of the discussions is the creation of an artificial intelligence technology hub in South Korea. Not merely an office or a university-affiliated research lab, but a full-scale R&D center that could become Nvidia’s third major base in Asia, alongside its existing hubs in Singapore and Taiwan.

Reports that negotiations have entered their final stage emerged Thursday in The Korea Economic Daily, citing government and industry officials. There has been no official confirmation yet. A Hyundai Motor Group spokesperson stated that no final decisions have been made regarding the project, its timeline, or its location. However, the fact that details surfaced just before Nvidia CEO Jensen Huang’s visit to Seoul is telling.

The timing is significant. In October 2025, Hyundai, Nvidia, and South Korea’s Ministry of Science and ICT signed a memorandum of understanding. Nvidia committed to supplying GPUs to Hyundai and jointly developing AI facilities in the country. Six months later, the partnership appears to be moving from broad commitments to concrete implementation.

Now attention has shifted to the final details: site selection, project structure, and strategic alignment. Huang is expected to arrive in Seoul on Friday and meet Hyundai Motor Group Executive Chair Euisun Chung. According to reports, an informal dinner is planned in Seoul’s Seongsu-dong district, with executives from SK Group, LG Group, and Naver also expected to attend.

The rumored menu? Korean pork belly...

Continue reading...
0
0

Asian Stocks Fall as Chip Rally Cools

Asian Stocks Fall as Chip Rally Cools
When the Party Ends

Thursday began with a hangover across Asian equity markets. After several days of record-breaking gains in technology and semiconductor stocks, reality set in. Indexes drifted lower—not in a panic, not in a crash, but steadily enough to leave little doubt: the rally is taking a pause.

Several factors contributed to the shift. The main one is simple exhaustion. After the Nikkei reached a fresh all-time high and South Korea’s KOSPI approached its own peaks, investors decided it was time to take profits—especially against a backdrop of increasingly unsettling news.

There were also more concrete triggers. Comments from the Governor of the Bank of Japan regarding possible interest-rate hikes. Mixed results from Broadcom that weighed on the entire semiconductor sector. Ongoing uncertainty surrounding U.S.-Iran negotiations. Together, these factors created a cocktail that Asian markets found hard to stomach.

S&P 500 futures, which often set the tone for global trading, fell 0.4% in after-hours trading. American investors are taking profits as well. The example is contagious.

Japan: Records Give Way to Losses

The Japanese market, which was celebrating only yesterday, found itself deep in the red today. The Nikkei 225 lost 1.9%, while TOPIX, the broader Tokyo Stock Exchange index, fell 1.4%. These are significant moves—the kind that prompt analysts to revisit their forecasts.

What happened?

First, profit-taking. The Nikkei hit record highs this week, and many investors who bought stocks a month or two ago saw their portfolios rise by 20–30%. The temptation to lock in real gains rather than admire paper profits proved stronger than faith in further upside.

Second—and perhaps more importantly—there were comments from Bank of Japan Governor Kazuo Ueda. Speaking at a seminar on Wednesday, he said something markets were not expecting, at least not yet.

Ueda warned that inflation in Japan could...

Continue reading...
0
0

XAUUSD Technical Outlook – 4 June 2026

XAUUSD Technical Outlook – 4 June 2026


Descending channel, the dominant structure since February peak

Gold peaked sharply near $5,500+ in early February 2026 and has been carving a clear descending channel (drawn in blue on the chart) ever since. Both the upper and lower channel lines are well-respected, price has tested both boundaries multiple times. The channel is sloping down from top-right to bottom-left, which tells you the sellers have been in control for 4+ months

Price is sandwiched, squeezed between channel support and SMA9

At $4,461, price is sitting right at the lower boundary of the descending channel a historically significant bounce zone. Both prior green arrows on the chart (February and March) marked rebounds from this exact region. The SMA9 ($4,485) is overhead acting as immediate dynamic resistance. Price needs to close above SMA9 on a daily basis to even hint at recovery. Until that happens, this is a range-bound squeeze with downside risk still alive.

Key Levels to watch

Channel top / BB upper - $4,751 Major resistance — unlikely near-term

SMA20 midline - $4,561 Bears defend this level

SMA9 dynamic resistance - $4,485 Immediate ceiling today

Current price - $4,461 At channel lower support

BB lower / channel floor - $4,371 Critical support — bounce or break

Breakdown target - $3,800 If $4,371 fails decisively

Continue reading...
0
0
Navigation menu
instaforex banner