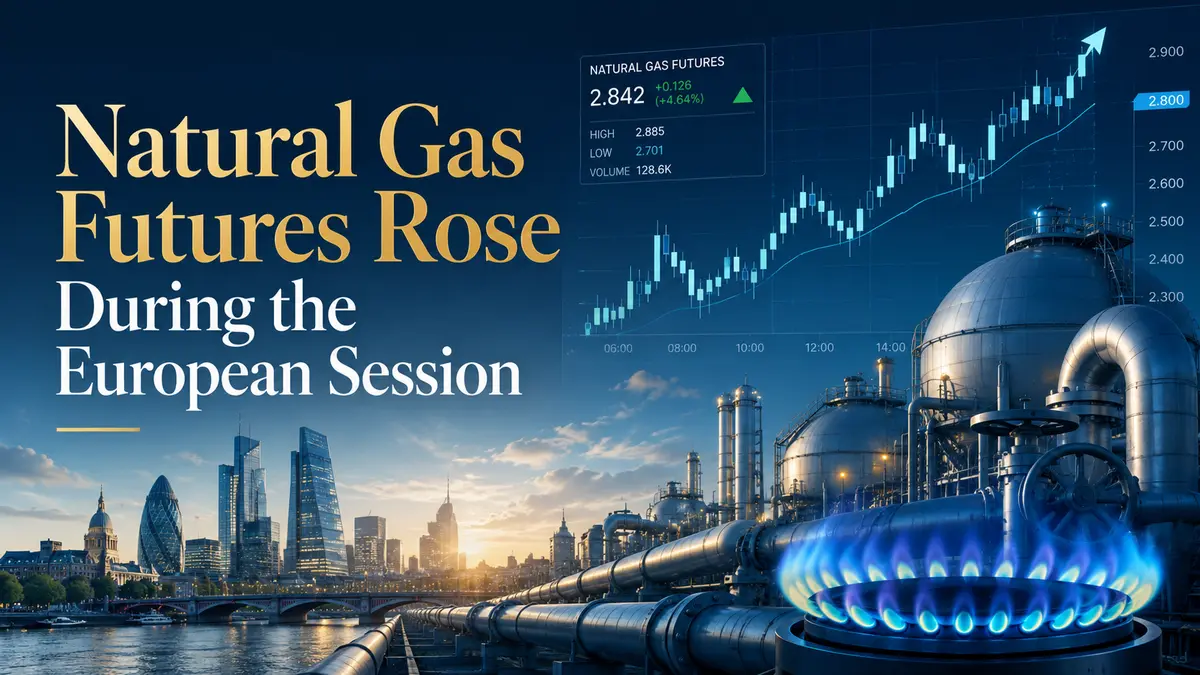
Natural Gas Futures Rose During the European Session
Introduction: Friday’s Gas Rebound
Friday, European trading session. Traders in London, Frankfurt, and Amsterdam open their terminals and see that natural gas is once again in the spotlight. NYMEX futures for August delivery rise to $3.24 per million British thermal units, gaining 1.35% compared with the previous close. This is not a dramatic surge, not a rally rewriting history, but it is a confident move that brings gas back into investors’ focus.
0.35% is not the most impressive figure, but in the context of recent weeks, when gas has been moving between support and resistance, any gain is perceived as a positive signal. Especially against the backdrop of WTI crude oil, which on Friday remained practically unchanged — 0.00% growth at $68.69 per barrel. Gas decided to break ahead, showing that it has its own drivers independent of the oil market.
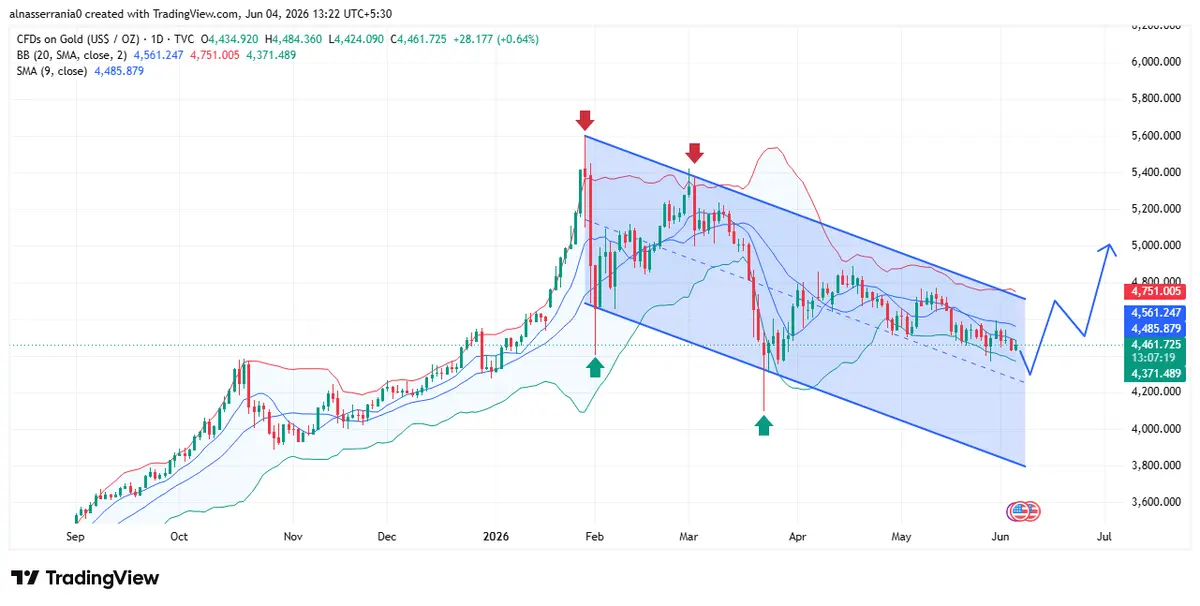
The technical picture also gives reason for discussion. Support is located at $3.151, while resistance stands at $3.328. The current price of $3.24 is slightly above the middle of this range, which suggests that traders have room to maneuver. If gas manages to break through resistance at $3.328, this will open the way toward $3.50 and higher. If it pulls back toward support, this will signal that the upward momentum has faded.
The dollar index, which often affects commodity prices, fell by 0.04% to 100.58 points. This is a minor decline, but even it works in favor of gas, making it slightly cheaper for holders of other currencies. However, the dollar remains strong, and its influence on gas is still limited.
So what is behind this growth? Summer cooling demand, lower production, geopolitical instability, or simply a technical rebound after oversold conditions? Let’s examine what is really driving natural gas this Friday and what to expect from it in...