Don’t rush to accept a leverage from any broker, until u read this.
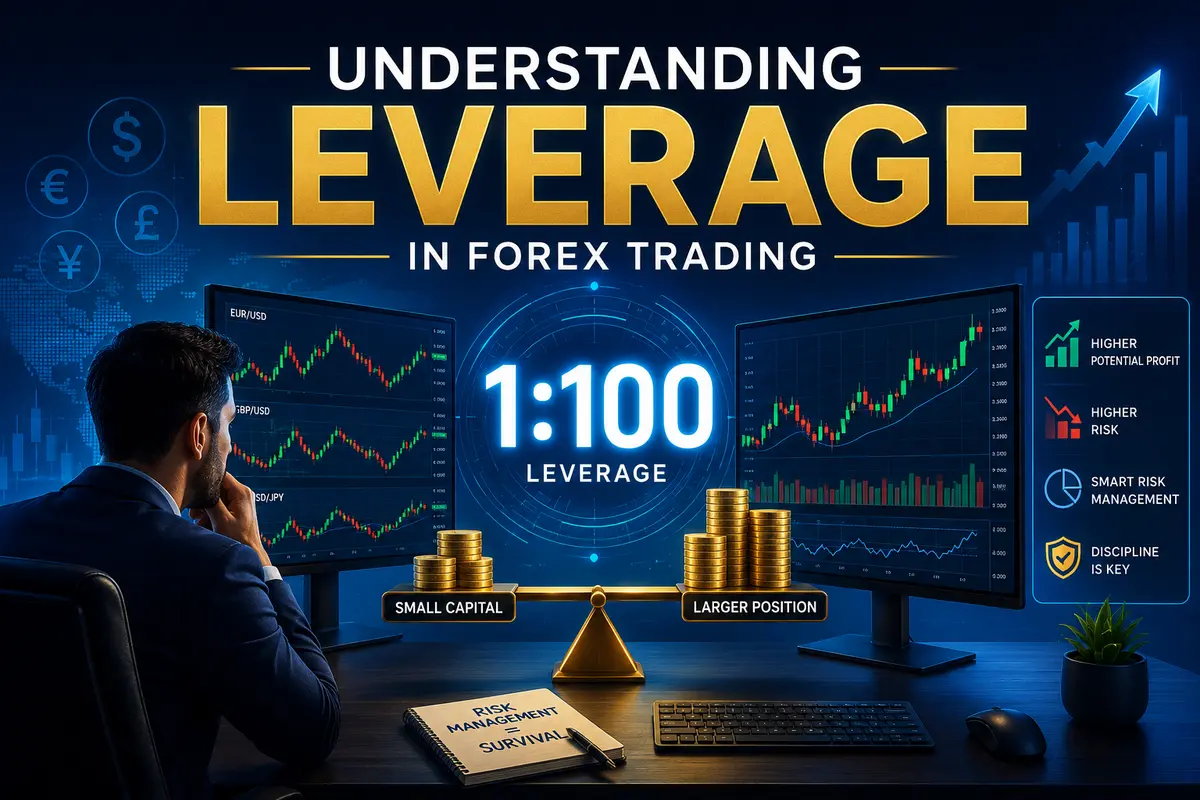
What Is Leverage in Forex Trading?
Leverage is one of the most important concepts every forex trader must understand before placing a trade. Many beginners hear that leverage can help them make bigger profits, but they often ignore the fact that it can also increase losses. Learning how leverage works is essential because it helps traders make informed decisions and manage risk effectively.
In simple terms, leverage is borrowed money provided by a broker that allows traders to control a larger trading position with smaller amount of their own money. Instead of paying the full value of a trade, the trader only needs to deposit a small percentage called the margin. The broker temporarily provides the remaining amount needed to open the position.
For example, imagine you have only $100 in your trading account. Without leverage, you can only trade up to the value of your account. However, if your broker offers 1:100 leverage, your $100 can control a position worth as much as $10,000. This gives traders the opportunity to participate in larger trades than they could afford with their own funds alone.
Leverage is usually written as a ratio, such as 1:10, 1:50, 1:100, or 1:500. The first number represents your own capital, while the second number shows how much buying power the broker is providing. A higher leverage ratio means you can control a larger position with less money, but it also means your account is exposed to greater risk if the market moves against you.
Many new traders are attracted to high leverage because they believe it guarantees higher profits. While leverage can increase potential returns, it can also magnify losses. If a trade moves in your favor, your profit will be larger than it would have been without leverage. On the other hand, if the...