Bar Pipa
We pay for a post of 10$

ECB Eve Jitters, Euro Firms on Inflation Data & CAC 40 Steadies Friday, 5 June 2026 | European Session — London Open | Capital Street FX Research Desk

ECB Eve Jitters, Euro Firms on Inflation Data & CAC 40 Steadies Friday, 5 June 2026 | European Session — London Open | Capital Street FX Research Desk

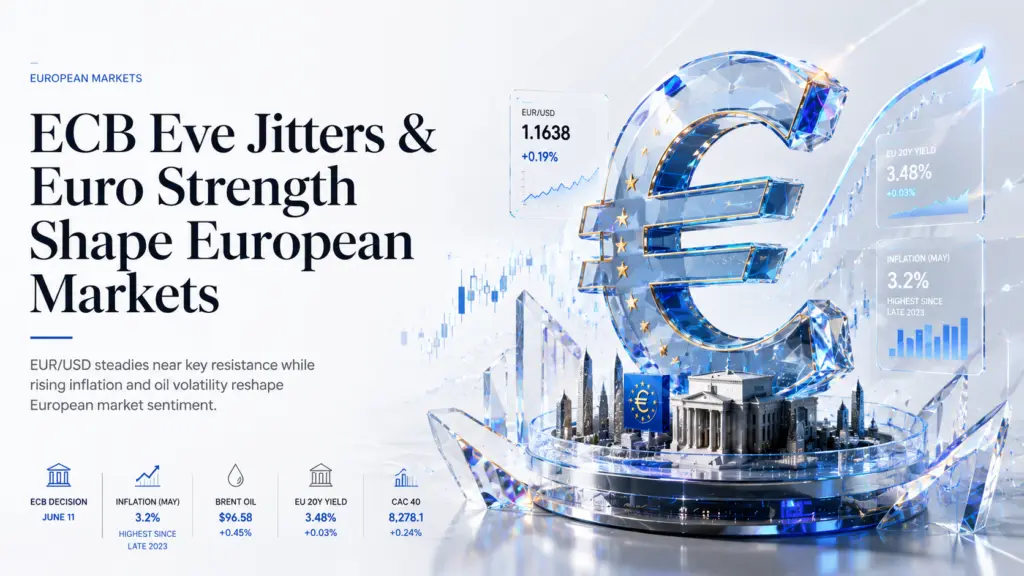
KEY EVENT: ECB Rate Decision — June 11  |  25bp Hike 90% Priced  |  ECB Deposit Rate 2.00%  |  Euro CPI 3.2% (May, highest since late 2023)

EUR/USD 1.1638  ·  EUR/GBP 0.8644  ·  Lead $2,014.51/T  ·  Corn 420.56¢/bu  ·  CAC 40 8,278.1  ·  AstraZeneca £13,150  ·  EU 20Y 3.48%  ·  USDT $1.0001  ·  BNB/USD $594.5


Session Overview — European Markets

Friday's European session opens with an unusual and defining tension: the euro is firming ahead of a rate hike that is already almost fully priced — a reminder that in modern markets, anticipation can both deliver and disappoint. With the European Central Bank's June 11 decision six days away and May eurozone inflation confirmed at 3.2%, the question is no longer whether the ECB will hike, but how hawkish the guidance will be and what comes next.

The macro backdrop is dense. Eurozone inflation rose to 3.2% in May — its highest reading since late 2023, with core at 2.5% and services inflation surging to 3.5%. These data points have pushed money markets to price a near-certain 25 basis-point hike at the June 11 meeting, lifting the ECB deposit rate from 2.00% to 2.25%, with a second hike priced for September and a third increasingly likely before year-end. ECB Governing Council member Isabel Schnabel on Monday added a hawkish note: it is too early to determine the exact number of rate hikes — a deliberate signal that the ECB is not inclined to front-run market guidance. Bank of Italy Governor Fabio Panetta was equally pointed: the forward-looking picture calls for a recalibration to counter the risk of persistent inflationary tensions.

Beneath the ECB narrative, the geopolitical picture remains the dominant risk overlay. Iran hostilities continue to disrupt oil supply chains and push energy-driven inflation across Europe. A conditional Lebanon...

Continue reading...
0
0

Yen Crosses 160, BOJ Rate-Hike Odds Surge as Nikkei Slips Friday, 5 June 2026 | Asian Session Report | Capital Street FX

Yen Crosses 160, BOJ Rate-Hike Odds Surge as Nikkei Slips Friday, 5 June 2026 | Asian Session Report | Capital Street FX
The Yen Is the Story

Friday's Asian session opens with a single dominant narrative: the Japanese yen is in crisis, and Tokyo is running out of patience.

USD/JPY crossed 160 per dollar intraday — the threshold that previously triggered $73 billion in official intervention — before verbal warnings from Finance Minister Satsuki Katayama pushed it fractionally back to 159.87, up 0.15% on the session. Markets are not convinced. The probe is deliberate. Traders have tested this ceiling before and found it painful. They are testing it again.

What makes today different from previous yen-weakness episodes is the paradox sitting beneath the surface. At the exact moment the yen is depreciating toward intervention levels, BOJ rate-hike expectations are intensifying. Japan's real wages rose for a fourth consecutive month — the domestic demand evidence that BOJ Governor Ueda has repeatedly cited as the precondition for further tightening. Markets now assign a meaningful probability to a BOJ rate hike at the June 16–17 meeting, which would mark the second hike of 2026 and the first time since 2018 that the Fed and BOJ would be tightening simultaneously.

The irony is sharp: a BOJ hike — which would normally strengthen the yen — could theoretically eliminate the very condition that makes intervention necessary. But before that hike arrives, the market has to survive tonight's U.S. Non-Farm Payrolls, and that is where every trade in this session ultimately leads.

The Nikkei's AI Rout — SoftBank's Worst Day Since 2020

The Nikkei 225 extended its Thursday decline, falling a further 1.28% to 66,636 in early Tokyo trade. The damage is concentrated but severe. SoftBank Group collapsed 11.3% — its worst single-day loss since 2020 — as its heavy exposure to AI-related investments, including Arm Holdings and OpenAI, became a liability rather than an asset.

The trigger...

Continue reading...
0
0
Tom Maffin

Bitcoin: What the Capitulation of the Coin’s Top Holders Is Telling Us

Bitcoin: What the Capitulation of the Coin’s Top Holders Is Telling Us
The Strongest Hands Have Finally Given Up

The world of Bitcoin has its own hierarchy of resilience. Newcomers buy at the top and sell at the bottom. Experienced traders try to time the market but often get it wrong. And then there is a special class of investors: long-term holders. These are the people who buy coins and leave them untouched in their wallets for months or years. They do not react to the news. They do not stare at charts every hour. They simply believe.

They believe that Bitcoin is the future of money, that the current price is irrelevant, and that sooner or later everything will pay off.

These people form the backbone of the Bitcoin community. They are often called “diamond hands.” As long as they hold, the market has a floor. As long as they are not selling, a decline does not turn into a collapse.

But in recent weeks, something has broken. Long-term holders—those who have held their coins for at least 155 days—have become sellers. And they are selling a lot. A very large amount.

According to analysts at Compass Point, they sold roughly $2.4 billion worth of Bitcoin over the past two days. Two and a half billion dollars in just 48 hours. This is not profit-taking. This is an exodus. This is capitulation.

Ed Engel, a Compass Point analyst who tracks long-term holder behavior, notes that these investors were largely inactive from February through April. They sat on their coins, watched Bitcoin fall from its October highs above $126,000, and did not budge. They endured. They hoped for a reversal.

But hope has faded. The price has fallen below $64,000. The conflict in the Middle East is not ending—it is escalating. Institutional investors have withdrawn money from Bitcoin ETFs for twelve consecutive...

Continue reading...
0
0
John Madnes

Cardano Cryptocurrency Plunges 10% in a Bearish Market Pullback

Cardano Cryptocurrency Plunges 10% in a Bearish Market Pullback
Friday the 13th for ADA Holders

Friday turned into a bloodbath for Cardano supporters. Cardano, once among the world's top three cryptocurrencies and a contender for the throne, fell 10.17% in a single day. The price dropped to $0.1728, marking its sharpest decline since June 4 and coming at a time when the broader market was already on edge.

The numbers confronting ADA holders are enough to break the heart of even the most resilient crypto enthusiast. Cardano’s market capitalization shrank to $6.28 billion. That sounds enormous until you remember that at its peak in 2021, Cardano was worth nearly $95 billion. Since then, its value has evaporated like morning mist. The token has lost 94% of its value from its all-time high of $3.10 reached on September 2, 2021.

Over the past week, Cardano has fallen 26%. Twenty-six percent in seven days is not a correction—it is a collapse. Trading volume over the last 24 hours reached nearly $937 million, accounting for 0.69% of the entire cryptocurrency market's turnover. People are selling in panic. Some are cutting their losses; others are simply leaving and may never return to the asset.

At the time of writing, Cardano ranks 15th among all cryptocurrencies by market capitalization. It was once third. That decline in ranking is perhaps the clearest indication of how much has gone wrong.

But the most frightening aspect for holders is not the numbers themselves. It is the news accompanying them. Project founder and spiritual leader Charles Hoskinson announced that he is taking a “creative break.” Just four words posted on X: “I'm taking a break. TTYL.” The market heard those words—and collapsed.

Four Words That Wiped Out Billions

It is difficult to overstate Hoskinson’s influence on Cardano. He is not merely the founder; he is the face, voice,...

Continue reading...
0
0
Lin Brings

Gold Falls Amid Tensions Surrounding Iran

Gold Falls Amid Tensions Surrounding Iran
When War Stops Being Precious

Friday began on a disappointing note for precious metals markets in Asia. Gold, which has already been struggling this week, moved lower once again. Spot gold fell 0.8% to $4,440.84 per ounce, while futures declined by the same margin to $4,467. And this is happening even as the Middle East remains engulfed in conflict.

At first glance, war, missile strikes, military operations, and stalled negotiations should provide the perfect environment for gold to rally. Investors are traditionally expected to flock to the yellow metal as a safe haven. That is how it has always worked. That is what textbooks teach. That is what market logic suggests. But not today—and not this week.

The paradox has a simple explanation. The conflict between the United States and Iran, which has been ongoing for several months, has ceased to be a source of uncertainty. Instead, it has become a source of inflation. And inflation means higher interest rates. Higher interest rates, in turn, are a major headwind for gold.

Gold is down approximately 2.2% for the week, marking its worst performance since early May. The reason is not the absence of geopolitical risks, but rather their abundance. The market is no longer afraid of war itself. It is afraid of what war does to oil prices and, through oil, to inflation and interest rates.

Let’s examine how a conflict in the Middle East has become a bearish factor for gold—and what may lie ahead for the yellow metal following the release of key U.S. employment data.

Middle East: Hope Is Gone, Long Live Inflation

Developments in the Middle East have been rapid and, for those hoping for peace, discouraging. Hopes for a U.S.–Iran agreement, which still seemed realistic earlier in the week, had all but vanished by Friday.

...

Continue reading...
0
0
Rose Gramit

WTI Crude Oil Futures Rise in Asian Trading

WTI Crude Oil Futures Rise in Asian Trading
A Morning That Began with Hope

Friday’s Asian oil markets opened with cautious but steady gains. Futures for West Texas Intermediate (WTI) crude oil, the primary benchmark for the U.S. market and beyond, rose 0.17% to $93.20 per barrel. It is hardly a spectacular rally—just seventeen hundredths of a percent, more of a tremor than a surge. But after several days of volatile price swings, traders are willing to welcome any green number on their screens.

The European benchmark, Brent crude, appeared somewhat stronger. The August Brent contract gained 0.42%, climbing to $95.43 per barrel. The price spread between Brent and WTI widened to $2.23 per barrel in Brent’s favor. A week ago, the spread was narrower, below $2. The widening gap suggests that geopolitical risks concentrated around key Brent supply routes continue to weigh more heavily on Brent than on WTI, which is produced in the relatively secure environment of Texas.

The U.S. dollar, which has pressured commodity markets in recent days, weakened slightly on Friday morning. The U.S. Dollar Index futures slipped 0.01% to 99.39. The decline is tiny and almost imperceptible, but even such a modest move gives oil prices some breathing room.

The technical picture remains tense. WTI support stands at $88.45, a level sellers failed to break in recent sessions. Resistance is located at $97.00. With WTI trading at $93.20, prices sit roughly in the middle of that range, leaving traders with room for maneuver.

The key question is what will trigger the next move. Geopolitics? U.S. inventory data? Or perhaps long-awaited news regarding negotiations between Iran and the United States? As usual, Asian traders were the first to react and have already begun positioning themselves ahead of developments.

Middle East: The Calm Before the Storm

The geopolitical backdrop remains the...

Continue reading...
0
0
Tim Drening

Sterling Gains, but Its Position Looks Fragile

Sterling Gains, but Its Position Looks Fragile
A Small Green Ray Through the Clouds

Thursday brought a modest sense of relief to holders of British pounds and euros. After several days in which the U.S. dollar bulldozed its way through virtually every major currency, the market finally paused. Sterling gained 0.27% against the dollar, reaching 1.3459. The euro performed slightly better, rising 0.35% to 1.1640.

These are modest, almost symbolic moves. Yet after the previous day's decline, even such gains felt like a welcome gift.

Still, don't be fooled by the green numbers on the screen. The pound and the euro remain on extremely shaky ground. They resemble a person walking across thin ice—every next step could be the last. The fundamental drivers behind these currencies have not changed. The dollar remains strong. Geopolitical risks remain severe. And economic data from Europe and the UK continue to disappoint.

On Thursday, the dollar merely took a breather. Investors paused ahead of Friday's key event—the U.S. nonfarm payrolls report. This release could either reinforce the dollar's recent momentum or call it into question. Few traders are willing to establish major positions ahead of such uncertainty. As a result, the dollar stood still while the pound and euro managed a modest rebound.

But let's take a closer look. Why does sterling remain so vulnerable? Why is the euro struggling to strengthen despite its gains? And what lies ahead for these currencies after the U.S. employment data is released?

Sterling: Recovering After a Blow

Let's begin with the pound. Thursday's modest rise followed a sharp decline the previous day.

On Wednesday, sterling fell heavily after disappointing UK services-sector PMI data.

The figures were alarming. For the first time in more than a year, the index dropped below the psychologically important 50-point threshold. A reading above 50 signals expansion; below 50 indicates...

Continue reading...
0
0
Tom Maffin

Asia Defends Its Currencies Amid a Strong Dollar and Expensive Oil

Asia Defends Its Currencies Amid a Strong Dollar and Expensive Oil
A Storm That Won’t Let Up

Asia wakes up on Thursday, and the first thing traders see on their screens is red once again. Regional currencies have fallen for a fourth consecutive day. Bloomberg’s Asian currency index—a barometer of the financial health of hundreds of millions of people across the region—continues its relentless slide. The biggest losers are the South Korean won and the Indonesian rupiah, but few others are faring much better.

Behind these numbers lies a simple and uncomfortable story. The dollar is strong. Oil is expensive. Capital is flowing out of Asia and into the United States. Meanwhile, local central banks are trying to preserve what they can. Interventions, warnings, interest-rate hikes—every tool is being deployed. So far, however, the results have been limited.

Asian countries have found themselves in a perfect storm. Two powerful forces are putting simultaneous pressure on their currencies. The first is the policy stance of the U.S. Federal Reserve. The American economy has remained stronger than expected, inflation remains stubborn, and the Fed is not only delaying rate cuts but is even considering further hikes. The second factor is the Middle East. Rising tensions between the United States and Iran are pushing oil prices higher. For Asia, which imports most of the oil it consumes, expensive oil delivers a triple blow: higher inflation, worsening trade balances, and weaker currencies.

Regional authorities are fighting back. Some are intervening directly, selling dollars from their reserves and buying local currencies. Others are raising interest rates to make their currencies more attractive to investors. Some are imposing administrative measures to limit capital outflows. Yet the U.S. dollar remains a formidable opponent. It is difficult to fight when domestic economies are slowing and inflation is rising.

South Korea: Words and Actions

South Korea, Asia’s fourth-largest economy and...

Continue reading...
0
0
NorthRay

I Wanted a Robot to Trade for Me. I Almost Bought the “Magic Button.” Good Thing I Stopped in Time.

I Wanted a Robot to Trade for Me. I Almost Bought the “Magic Button.” Good Thing I Stopped in Time.

Hi, this is NorthRay.💪

Do you know what I was looking for in my first days of trading?

Not a strategy. Not knowledge. Not discipline.

I was looking for a magic button.

A button that would open trades for me. One that never sleeps, never gets scared, and never makes stupid mistakes. One that makes money while I drink coffee or sleep.

And I found one. Or rather, someone offered it to me.

“Trading robot with a 95% win rate.”

“Copy trading — copy professional traders and earn money.”

“Passive income of 30% per month.”

I almost fell for it because it sounded perfect.

But then I asked myself one question:

“If it’s really that simple and profitable, why isn’t every trader already a millionaire?”

So I started digging. And here’s what I learned.

What Are Trading Robots (Expert Advisors)?

A trading robot (or Expert Advisor) is a program that automatically opens and closes trades according to a predefined algorithm.

You install it in MetaTrader 4, turn it on, and the robot analyzes the chart, presses Buy and Sell, and sets stop-losses by itself.

No involvement from you. 24/5. No emotions. No fear. No greed.

Sounds like a beginner’s dream, right?

I downloaded a free robot, installed it on a demo account, and turned it on.

It opened a trade. Then another. Then another.

An hour later, I checked the results: three losing trades and one winning trade. Overall result: negative.

I thought:

“Maybe I downloaded a bad robot. Maybe I should buy a paid one?”

That’s when I started doing real research.

How I Almost Bought a Robot (And Why I’m Glad I Didn’t)

I visited a website selling a “super robot with 90% accuracy.”

Beautiful website. Equity growth charts. Reviews (probably fake). A 70% discount “today only.”

Price:...

Continue reading...
0
0
BCR

Daily Analysis 5 June 2026 | Dollar Strength, Oil Rally And NFP In Focus

Daily Analysis 5 June 2026 | Dollar Strength, Oil Rally And NFP In Focus

Currency & Commodity Analysis:


US Dollar Index


The US dollar index traded around 99.40 on Thursday, near a two-month high, as stronger-than-expected US labor market data reinforced expectations of a tightening Federal Reserve policy. The latest ADP report showed that private sector employment increased by 122,000 in May, exceeding expectations and marking the strongest reading since January 2025. Earlier this week, Jolts data revealed that job openings rose to their highest level since November 2024 in April. Investors are now awaiting Friday's non-farm payroll report for further insight into labor market conditions. The dollar also continues to be supported by escalating tensions in the Middle East, which have kept oil prices high and added to inflationary pressures. The market currently assesses an 85% probability of a 25 basis point rate hike by the Fed before the end of the year, up from 60% a week ago.


After months of consolidation near multi-month lows, the US dollar index may be entering a broader recovery phase. If inflation remains high and the Middle East conflict continues to disrupt energy markets, the likelihood of the US dollar returning above the 100.00 level in the coming weeks will increase. The US dollar index is currently trading near a high of 99.50, with short-term resistance at the previous high of 99.55. The medium-term resistance is at 100.00 (a psychological level), while support lies at the psychological level of 99.00 and the 99.18 area (the 9-day moving average). The MACD remains above the zero line, with the DIFF above the DEA, indicating a slight continuation of bullish momentum. The RSI is at 58, above the 50 level, indicating bullish dominance but not yet overbought.


Today, consider shorting the US dollar index at 99.52, with a stop-loss at 99.65 and targets at 99.20...

Continue reading...
0
0
Navigation menu