ECB Eve Jitters, Euro Firms on Inflation Data & CAC 40 Steadies Friday, 5 June 2026 | European Session — London Open | Capital Street FX Research Desk
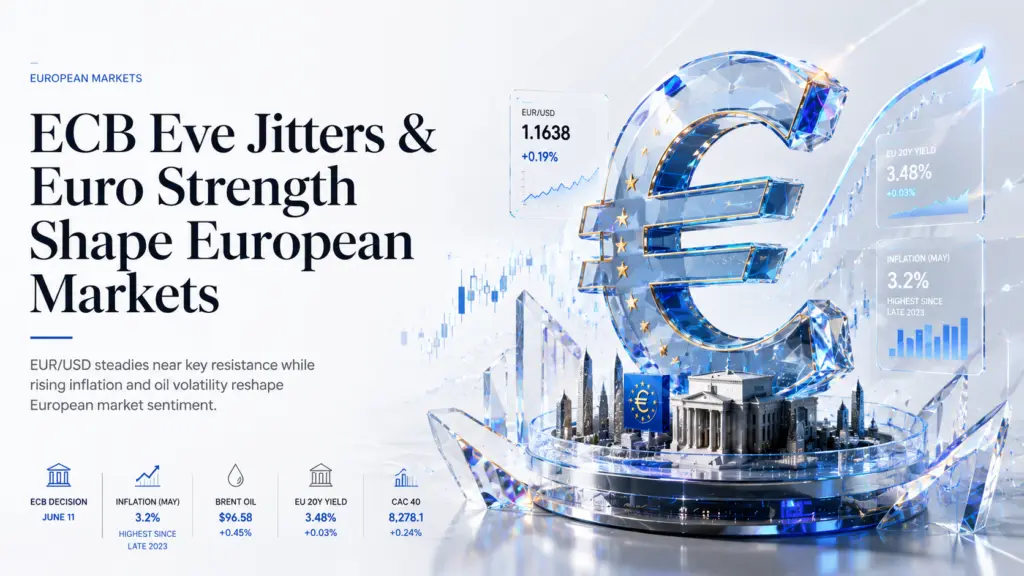
KEY EVENT: ECB Rate Decision — June 11 | 25bp Hike 90% Priced | ECB Deposit Rate 2.00% | Euro CPI 3.2% (May, highest since late 2023)
EUR/USD 1.1638 · EUR/GBP 0.8644 · Lead $2,014.51/T · Corn 420.56¢/bu · CAC 40 8,278.1 · AstraZeneca £13,150 · EU 20Y 3.48% · USDT $1.0001 · BNB/USD $594.5
Session Overview — European Markets
Friday’s European session opens with an unusual and defining tension: the euro is firming ahead of a rate hike that is already almost fully priced — a reminder that in modern markets, anticipation can both deliver and disappoint. With the European Central Bank’s June 11 decision six days away and May eurozone inflation confirmed at 3.2%, the question is no longer whether the ECB will hike, but how hawkish the guidance will be and what comes next.
The macro backdrop is dense. Eurozone inflation rose to 3.2% in May — its highest reading since late 2023, with core at 2.5% and services inflation surging to 3.5%. These data points have pushed money markets to price a near-certain 25 basis-point hike at the June 11 meeting, lifting the ECB deposit rate from 2.00% to 2.25%, with a second hike priced for September and a third increasingly likely before year-end. ECB Governing Council member Isabel Schnabel on Monday added a hawkish note: it is too early to determine the exact number of rate hikes — a deliberate signal that the ECB is not inclined to front-run market guidance. Bank of Italy Governor Fabio Panetta was equally pointed: the forward-looking picture calls for a recalibration to counter the risk of persistent inflationary tensions.
Beneath the ECB narrative, the geopolitical picture remains the dominant risk overlay. Iran hostilities continue to disrupt oil supply chains and push energy-driven inflation across Europe. A conditional Lebanon ceasefire, brokered overnight, has provided a tentative risk-on pulse — but Tehran has denied recent progress in direct US-Iran negotiations, and fighting persists. The CAC 40 has stabilised near 8,278 after a sharp two-session decline earlier this week. AstraZeneca trades softer at £13,150 amid a broad sector rotation away from defensives toward energy and materials. Lead is trading strongly at $2,014.51/T as global industrial demand begins to recover. Corn continues its liquidation spiral, bouncing sharply today on short-covering but with bear fundamentals entirely unchanged. The EU 20-year yield holds at 3.48%, reflecting markets’ repricing of the ECB cycle; German 10-year Bunds trade near 3.01%.
Key session levels at the London open: CAC 40 at 8,278.1 (+0.24%), FTSE 100 at 10,396.1 (-0.77%), DAX at 24,968.1 (+0.27%), EUR/USD at 1.1638 (+0.19%), EUR/GBP at 0.8644 (-0.07%), German 10Y Bund at 3.01%, Brent crude at $96.58 (+0.45%), Gold at $4,461.14 (-1.17%), BNB/USD at $594.5 (-8.24%).
Breaking News — European Session Headlines, 5 June 2026
ECB Rate Hike Countdown: June 11 Decision at 90% Probability, Hawkish Guidance Eyed
With eurozone CPI at 3.2% in May — the highest in over two years — markets price a near-certain 25bp hike to 2.25% next Wednesday. ECB’s Isabel Schnabel warned it is too early to determine the exact number of rate hikes, signalling the June meeting carries real two-way risk: the hike itself is priced, but hawkish forward guidance could still jolt EUR/USD toward 1.17 and beyond.
Lebanon Ceasefire Conditional; Iran Denies Peace Progress as Oil Stays Elevated
A conditional Israel-Lebanon ceasefire was agreed overnight, lifting cautious risk sentiment at the open. However, Iran denied recent progress in Washington talks, and fighting continues in Lebanon. Brent crude holds above $96 per barrel — a persistent inflationary headwind that complicates the ECB’s growth-inflation trade-off and keeps the euro area composite PMI in contraction territory.
Eurozone Inflation Hits 3.2% — Broadening Beyond Energy Into Core and Services
May’s final euro-area CPI confirmed headline at 3.2%, core at 2.5% and services at 3.5% — signals of entrenched price pressure that go well beyond oil. ECB’s Panetta cited persistent inflationary tensions as a reason for policy recalibration. Bloomberg’s economist poll had expected two ECB hikes this year; the inflation data now puts a third firmly on the table.
CAC 40 Steadies After Two-Session Decline; France PMI Composite Revised to 44.9
The CAC 40 recovered 1.1% on Thursday to close near 8,240 after Iran-driven selling earlier this week. Friday’s session opens cautiously higher near 8,278 but macro headwinds remain: France’s final composite PMI for May was revised upward only to 44.9 — still the sharpest contraction since January 2024. Services PMI at 44.3 confirmed the French economy is weakening as energy costs bite.
AstraZeneca SERENA-6 Trial Data Positive; FDA Approves Imfinzi for New Indication
AstraZeneca reported further positive Phase III SERENA-6 results showing camizestrant combined with CDK4/6 inhibitors maintained benefit in ER+ breast cancer. Additionally, the FDA approved Imfinzi (durvalumab) in a BCG-naive, high-risk bladder cancer indication. Despite the pipeline positives, AZN shares soften slightly today as broad sector rotation into energy names weighs on pharma.
Corn Bounces Sharply +6.7% to 420.56¢ on Short-Covering; Bear Fundamentals Unchanged
Corn futures are posting a sharp short-covering bounce to 420.56¢/bu after a seventh consecutive session of losses, with July contracts trading near 394¢ before today’s move. Brazilian corn exports surged to 250,449 MT in May, versus 38,928 MT in May 2025, swamping any ethanol-demand support from elevated crude. US planting at 93% complete with 67% good-to-excellent crop ratings amplifies the bearish supply picture. The bounce should be viewed as a selling opportunity, not a structural reversal.
Foreign Exchange Analysis — EUR/USD and EUR/GBP
EUR/USD — ECB Hike Optimism vs. Firm Dollar on NFP Beat
EUR/USD 1.1638 ▲ +0.19% | Bias: Cautiously Long — ECB Hawkish Guidance Catalyst Next Week
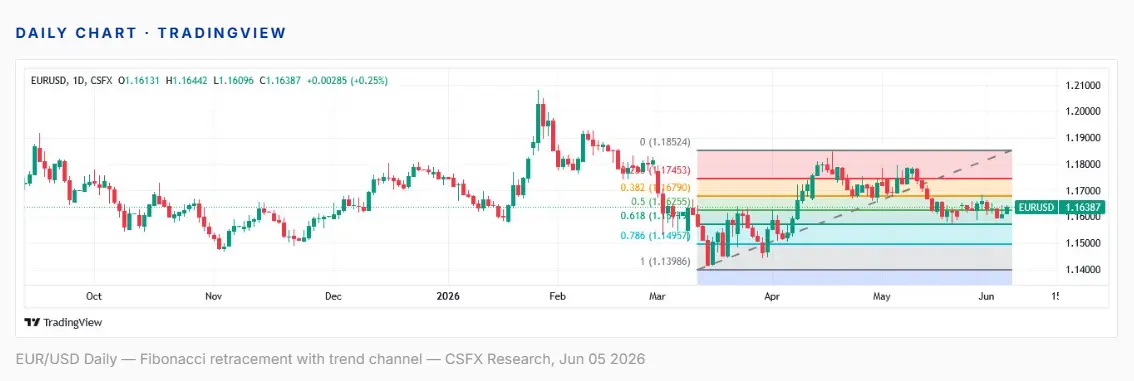
EUR/USD has traded in a 5.8% range during 2026, peaking at 1.2019 in late January before retreating to a trough of 1.1435 in March. The pair has since recovered and is now consolidating between 1.155 and 1.170 — a mid-range coil ahead of the definitive ECB catalyst next week. The daily RSI sits near 52, neither overbought nor oversold, consistent with a market in genuine two-way suspension. The 50-day moving average near 1.162 provides dynamic support near current levels; resistance at the 1.170 to 1.175 zone, the late-May high, is the first serious hurdle before the January peak comes back into play. A break below 1.155 would re-expose the March lows and shift bias back to neutral-to-bearish.
The euro faces a classic buy-the-rumour, sell-the-fact risk. A 25bp ECB hike on June 11 is 90% priced; merely delivering the hike without sufficiently hawkish forward guidance could disappoint a long-EUR market. The key swing factors are whether the ECB’s updated June projections raise the terminal rate above 2.75%, whether Lagarde’s post-meeting language explicitly signals a September hike, and whether today’s US NFP data surprises to the upside — which would reinforce Fed-hold expectations and provide a dollar tailwind. The structural backdrop is broadly supportive of the euro: the ECB is pivoting to a hiking cycle against a Fed that remains divided, and eurozone inflation is broadening in a way that argues against an early ECB pause.
Trade Signal — EUR/USD
Direction: Cautiously Long
Entry: 1.1625 — Buy pullbacks to intraday support
Stop Loss: 1.1555 — Below May 2026 key support
Take Profit: 1.1720 — Targets range midpoint; ECB catalyst
Key Risk: Strong US NFP above 100,000 would reinforce dollar strength and cap gains
EUR/GBP — Narrowing ECB-BoE Rate Gap Favours Euro Recovery
EUR/GBP 0.8644 ▼ -0.07% | Bias: Tactical Long — ECB Hike Closes BoE Rate Gap; Target 0.8720
EUR/GBP has traded in an extremely tight range all year, reflecting the stable but narrowing interest-rate differential between the ECB and the Bank of England. The 7-day range of 0.8638 to 0.8667 with just 0.10% volatility is unusually compressed, and compressed ranges typically precede breakouts. The 50-day SMA sits near 0.8694 — currently acting as resistance — while the 200-day SMA near 0.8720 represents the next meaningful upside level. The RSI at approximately 62 is mildly bullish without being extreme. A break above 0.8667 opens the door to 0.8694 and then 0.8720. Downside support at 0.8620 is robust given the structural rate-gap anchor.
The dominant driver of EUR/GBP is the interest-rate differential: the Bank of England’s Bank Rate is 3.75% against the ECB’s 2.00% deposit rate — a 175 basis-point gap that has kept sterling structurally strong against the euro throughout 2026. However, this gap is about to narrow. If the ECB hikes 25bp on June 11 to 2.25% while the BoE holds on June 18, as Governor Bailey’s no-hurry rhetoric implies, the differential compresses to 150bp. Each 25bp step brings the two central banks closer together; by September, if the ECB hikes again, the gap narrows further. The market consensus puts EUR/GBP in a gradual upward drift through year-end toward 0.90, as the ECB catches up. The key near-term risk is hawkish BoE language at the June 18 meeting — but this looks unlikely given the UK’s own weak PMI readings.
Trade Signal — EUR/GBP
Direction: Tactical Long
Entry: 0.8638 — Near lower bound of weekly range
Stop Loss: 0.8595 — Below May support floor
Take Profit: 0.8720 — Post-ECB hike target; analyst consensus
Rate Gap Context: BoE 3.75% vs ECB 2.00% — differential closing to 150bp post-June hike
Commodities Analysis — Lead and Corn
Lead (LME) — Battery Demand Meets Soft Industrial Output
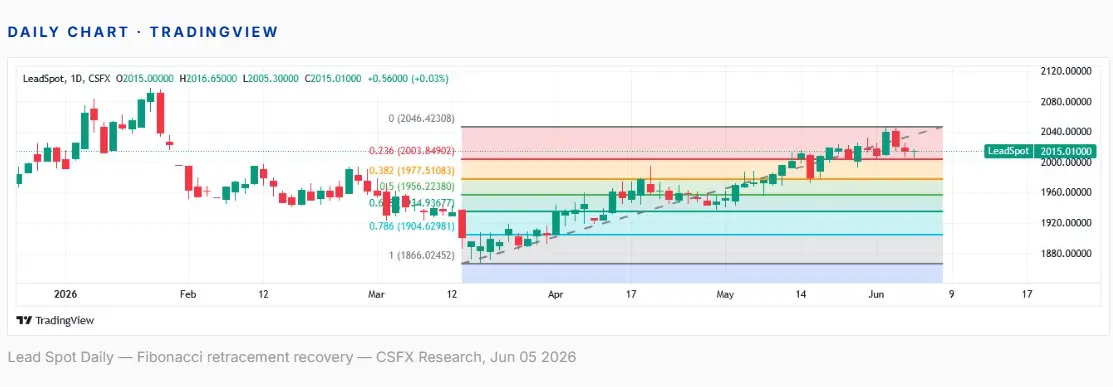
Lead $2,014.51/T ▲ +7.73% | Bias: Bullish — Break Above $1,950 Confirmed; Target $2,100 Zone
Lead has staged a sharp recovery, trading at $2,014.51 per tonne — reclaiming the key $1,950 resistance level that capped the Q2 range and closing within 2% of its January high of $2,056. The breakout above $1,950 is technically significant: this level acted as resistance for over two months, and a sustained hold above it confirms a bullish re-rating. Immediate support is now at $1,950 to $1,970, prior resistance turned support. A pullback to this zone offers a high-quality long entry. The upside target of $2,100 represents the next meaningful resistance above the January peak. The RSI has pushed into bullish territory, consistent with momentum continuation rather than an exhaustion top.
Lead’s primary demand driver — battery manufacturing, which represents approximately 80% of global usage — provides a long-term structural floor, but near-term conditions are soft. Europe’s composite PMI remains in contraction territory, China’s industrial output has disappointed in Q2, and elevated Brent crude prices weigh on automotive and freight activity that drives battery replacement cycles. At $2,014.51 per tonne, lead has already exceeded prior end-Q2 forecasts of approximately $1,946, suggesting the market is pricing a faster recovery than consensus expected. The current rally has genuine fundamental support rather than being purely speculative.
Trade Signal — Lead LME
Direction: Bullish
Entry: $1,990/T — Buy pullback to breakout retest
Stop Loss: $1,940/T — Below breakout retest support
Take Profit: $2,100/T — Next major resistance; January high zone
Key Level: $1,950 — Former resistance, now confirmed support on breakout
Corn (CBOT July Futures) — Supply Surge Overwhelms Biofuel Bid
Corn 420.56¢/bu ▲ +6.74% | Bias: Cautious Short — Short-Covering Bounce; Supply Surplus Still Intact
The July corn contract has staged a sharp short-covering rally of +6.74% to 420.56¢/bu, bouncing aggressively from contract lows near 394¢. This move is technically significant — it has reclaimed the 400¢ psychological level and pushed above the prior short-entry zone. However, the rally is best interpreted as an oversold bounce rather than a structural reversal: the RSI has recovered from deeply oversold territory but has not broken into bullish range, and managed-money positioning remains heavily net short. The 428 to 435¢ zone represents the next meaningful resistance, making it the optimal short re-entry zone if fundamentals remain bearish. A close above 442¢ would materially challenge the bear thesis.
The corn bear case is grounded in an extraordinary convergence of supply-side positives. US planting is 93% complete, ahead of the five-year average, with 67% good-to-excellent crop ratings — a reading that signals a near-record yield year absent a weather shock. Brazil’s corn exports surged 543% year-on-year in May, to 250,449 metric tonnes, reflecting the massive South American harvest hitting global markets simultaneously. Export Sales data this week showed 883,332 metric tonnes in old-crop corn sales — down 13% from the prior week and 6.3% below the same period last year — confirming soft demand from key buyers Japan and Mexico. The conventional argument that elevated oil prices support corn via ethanol biofuel demand is being overwhelmed by the supply narrative: there is simply too much corn in the world to sustain a sustained crude oil-corn price correlation at current levels. Without a crop scare — heatwave, early frost, drought — the path of least resistance remains lower.
Trade Signal — Corn ZC July Futures
Direction: Cautious Short — sell into extended bounce
Entry: 428¢ — Sell into extended bounce; prior support zone
Stop Loss: 442¢ — Above key structural resistance; invalidates bear thesis
Take Profit: 392¢ — Return to prior contract low support zone
Bear Thesis Driver: 93% US planting complete, 67% good/excellent ratings, Brazil exports +543% YoY
Equities Analysis — CAC 40 and AstraZeneca (AZN)
CAC 40 — French Large-Cap Benchmark
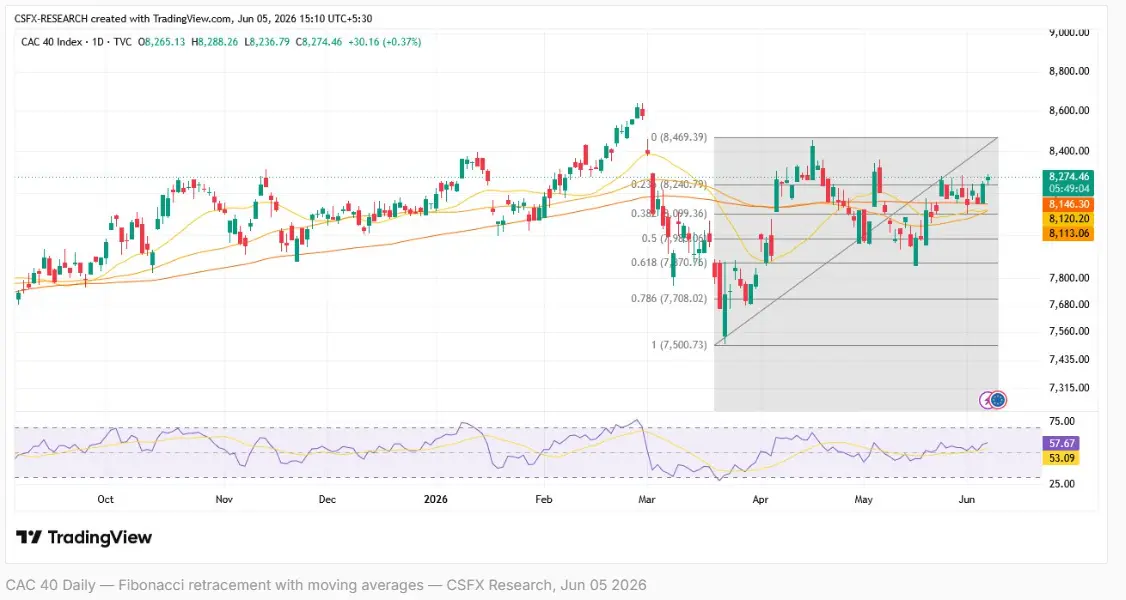
CAC 40 at 8,278.1 ▲ +0.24% | Bias: Neutral — ECB Catalyst Week Ahead; Range 8,100–8,450
The CAC 40 rallied approximately 1.1% on Thursday to 8,240 after two sessions of Iran-driven selling that pushed it to a low near 8,100. Today’s session opens slightly higher at 8,278, but the technical picture remains cautious. The index is below its 50-day and 100-day moving averages, which now act as resistance in the 8,380 to 8,420 zone. A sustained recovery requires a close above 8,320; without that, the index risks re-testing the 8,100 support floor if geopolitical news deteriorates. The May-June range of approximately 8,100 to 8,400 is a meaningful consolidation zone; a breakout in either direction will likely be driven by the ECB meeting on June 11 or material geopolitical developments. RSI near 43 is neutral, with no strong directional signal.
The CAC 40’s fundamental backdrop is challenging. France’s PMI composite confirmed at 44.9 is the sharpest contraction since January 2024, with the services sector at its weakest since November 2020 — a stark contrast to the apparent equity stability. The paradox is explained by CAC composition: the index carries significant weighting in luxury goods including LVMH and Hermes, energy through TotalEnergies, and defence via Thales and Airbus — sectors that have partially insulated the index from the domestic economic slowdown. TotalEnergies and energy peers are direct beneficiaries of elevated oil prices. Against this, consumer discretionary, real estate, and retail names face mounting pressure from high energy costs eroding household purchasing power. The ECB’s June hike raises borrowing costs and adds to refinancing pressure across French corporate balance sheets, a headwind for the index in the second half of 2026.
Trade Signal — CAC 40
Direction: Neutral — range-bound ahead of ECB
Entry (Long): 8,200 — Buy dip to prior week support
Stop Loss: 8,100 — Below June 3 closing low
Take Profit: 8,420 — Pre-Iran-crisis resistance zone
Key Risk Event: ECB June 11 — hawkish outcome bullish for index; dovish surprise bearish
AstraZeneca (LSE: AZN) — Pipeline Strength vs. Sector Rotation
AZN at £13,150 ▼ -0.49% | Bias: Bullish — Buy the Dip; Pipeline Value Intact
AstraZeneca reached an all-time high of £15,730 on February 18, 2026, and has since corrected approximately 16% to the current £13,150 level, in what appears to be a broad-market-driven pullback rather than a stock-specific deterioration. The 52-week low near £10,104 provides a distant but meaningful downside reference. Technically, AZN sits at a potentially interesting level: the £13,000 to £13,200 zone has acted as multiple-month support, and the stock has not broken below it despite the broad pharma sector rotation. The average 12-month analyst price target is £16,454 — implying 25% upside from current levels — with a consensus of 10 analysts at Strong Buy. RSI in the low 40s is approaching oversold territory for a quality mega-cap, suggesting the current level may offer an attractive entry for longer-term investors.
AstraZeneca’s fundamental case remains compelling. Q1 2026 oncology sales hit $6.8 billion, driven by key drugs including Tagrisso, Lynparza and Imfinzi. The SERENA-6 Phase III trial delivered further positive results for camizestrant in ER+ breast cancer — a blockbuster-scale opportunity. This week’s FDA approval of Imfinzi in BCG-naive bladder cancer adds another commercial indication. The ASCEND obesity trial completion signals AstraZeneca’s ambitions in the high-growth metabolic disease space. Near-term risks include the broader energy-driven sector rotation pulling capital from defensives into energy and materials. The July 27 earnings report will be a key catalyst: management guidance on pipeline timelines and 2026 revenue growth will reset the near-term trading range. The long-term valuation case — 1.78% dividend yield, dominant oncology franchise, expanding rare disease portfolio — supports a buy-the-dip stance at current levels.
Trade Signal — AstraZeneca AZN
Direction: Bullish — buy the dip
Entry: £13,100 — Near June support
Stop Loss: £12,600 — Below May structural support
Take Profit: £14,400 — Toward analyst consensus range
Next Catalyst: July 27, 2026 earnings — pipeline guidance and 2026 revenue growth
12M Analyst Target: £16,454 average — Strong Buy consensus
Fixed Income Analysis — EU 20-Year Bond
EU 20-Year Bond — ECB Hiking Cycle Repricing in the Back End
EU 20Y Yield 3.48% ▲ +0.03% | Bias: Bearish Duration — Sell Rallies; ECB Cycle Argues for Higher Yields
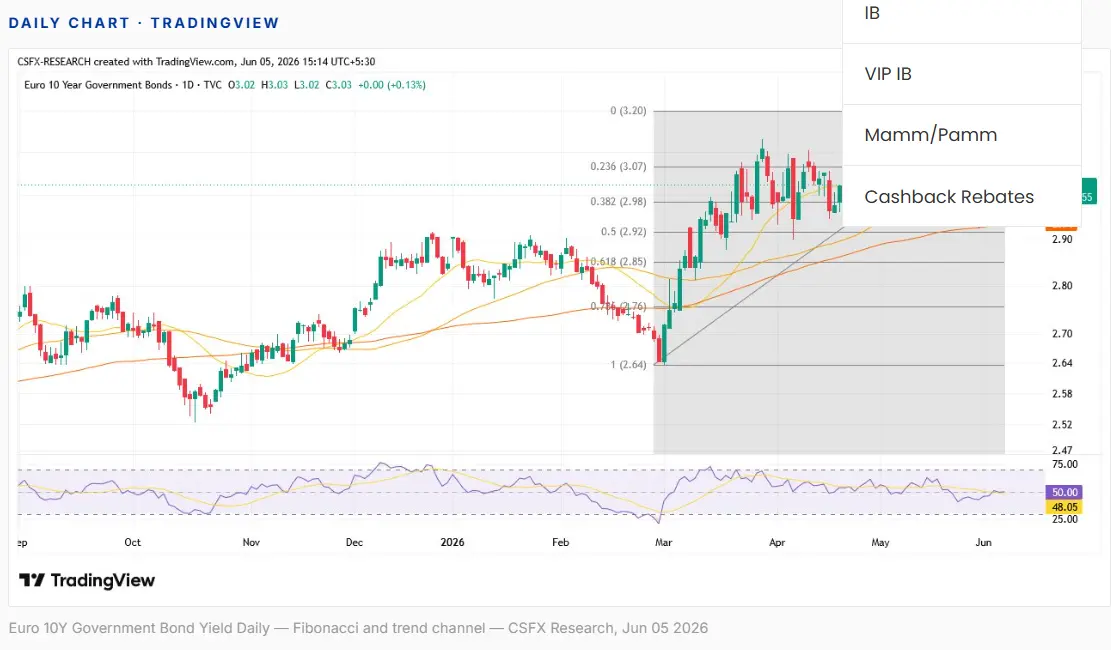
The German 10-year Bund yield has climbed from 2.50% in March to hover just above 3.00% in early June — a 50 basis-point move driven by inflation surprises and ECB repricing. The EU 20-year yield at 3.48% reflects the additional term premium on longer-duration European sovereign debt, and has tracked the Bund move with a modest lag. Technically, yields are in an uptrend channel; the 3.00 to 3.05% region for the 10-year and 3.40 to 3.48% for the 20-year represent intermediate consolidation zones. If the ECB delivers a hawkish surprise on June 11 — projecting two or three hikes in its updated staff forecasts — a break above 3.10% on the 10-year and 3.60% on the 20-year appears achievable in short order. The risk is a surprise dovish pivot, which looks unlikely given the inflation data, or a rapid Middle East peace deal that collapses energy prices and takes inflation expectations lower.
European long-duration bonds face a challenging regime. With eurozone CPI at 3.2% and the ECB explicitly signalling a hiking cycle, the carry from holding long-dated European sovereign bonds is increasingly insufficient to compensate for the mark-to-market risk of rising yields. The critical upcoming catalyst is the June 11 ECB meeting’s updated staff projections: if the ECB’s own 2026 to 2027 inflation forecasts remain above 2%, the market will price the hiking cycle higher and steeper. Conversely, if the Iran war shows material resolution signs by July, falling energy prices could rapidly deflate inflation expectations and trigger a sharp Bund rally. Position sizing and stop discipline are paramount in this environment.
Trade Signal — EU 20-Year Bond (Short Duration)
Direction: Bearish Duration — sell bond price rallies, i.e. yield dips
Entry (Short Duration): 3.40% yield — Sell bond price rallies
Stop Loss: 3.20% yield — Below key yield support; ceasefire risk
Take Profit: 3.75% yield — Post-ECB June/September twin hike target
Key Risk: Rapid Iran ceasefire — energy price collapse would trigger sharp Bund rally
Digital Assets — USDT Stablecoin and BNB/USD
USDT (Tether) — Stablecoin Peg Stability Under Legislative Scrutiny
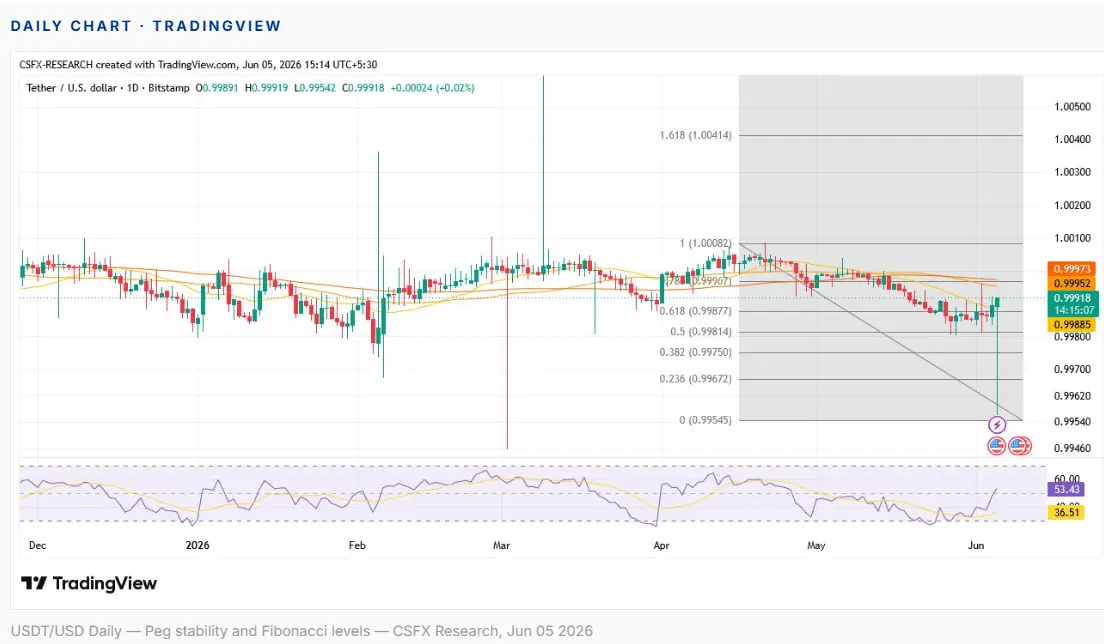
USDT at $1.0001 | Peg: Stable — within normal tolerance band of $0.9990–$1.0010
USDT’s peg remains stable at $1.0001, well within the normal operational tolerance band. In a week characterised by geopolitical volatility and broad crypto risk-off pressure — with BNB down over 8% and the broader market under stress — USDT’s stability reflects its function as a flight-to-safety vehicle within the digital asset ecosystem. On-chain flows suggest elevated USDT demand as crypto traders de-risk and move to stable denominations ahead of the ECB decision. This is a functionally normal pattern during macro risk events.
The principal risk to USDT’s peg is not operational but legislative. The US Stablecoin Clarity Act remains a live proposal with material implications for Tether’s operating model, reserve requirements, and potential competition from bank-issued digital dollars. JPMorgan CEO Jamie Dimon — himself publicly opposing the Act while deepening JPMorgan’s blockchain infrastructure — epitomises the institutional push to reshape stablecoin regulation around incumbent financial players. For market participants, the key monitoring item is not daily peg movements but progress in the US Senate on the Clarity Act. A passage or credible vote would be a structural inflection point for the entire stablecoin market, with Tether most directly exposed.
BNB/USD — Binance Coin Under Macro Risk-Off Pressure
BNB/USD at $594.5 ▼ -8.24% | Bias: Neutral — Range-Bound; Await NFP Macro Signal
BNB is trading inside a broad range on the daily chart with a weak overall structure. The token has been unable to sustain closes above its 100-day EMA, and each recovery attempt has been sold before a meaningful breakout. The $570 area provided bounce support; the $689.70 level represents the key bull trigger — a weekly close above this level would signal bullish momentum continuation. Current price near $594.5 sits near the lower end of the range, a technically neutral location. The H4 chart shows a series of higher lows following a strong bullish displacement, which could set up a Smart Money Concepts entry if price re-tests the $570 to $580 zone and forms a clean rejection. Bears hold a clear edge while BNB remains below the 100-day EMA and key $620 support.
BNB’s near-term price action is dominated by macro correlation rather than Binance-specific fundamentals. With the BTC-SPX correlation still elevated and equity markets in a risk-off mode ahead of the US NFP release and ECB decision, BNB faces the same headwind as other risk assets. A strong NFP would reinforce Fed-hold expectations, strengthen the dollar, and weigh on risk assets including crypto. A weak NFP would revive cut expectations, weaken the dollar, and provide a modest crypto tailwind. BNB’s utility case remains intact — it serves as the native token of Binance Smart Chain, used for transaction fees, staking, and DeFi participation. Position sizing should remain conservative until macro signals resolve post-NFP and post-ECB.
Trade Signal — BNB/USD
Direction: Neutral — await macro signal
Entry (Long): $575 — Near lower weekly range support
Stop Loss: $550 — Below structural support; capitulation risk
Take Profit: $640 — Weekly high breakout trigger
Bull Trigger: $689.70 weekly close — confirms momentum continuation
Bear Trigger: Break and hold below $570 — opens path to $530–$545
Economic Calendar — European Session and the Week Ahead
Today’s key releases begin at 08:00 BST with German Factory Orders for April, forecast at +0.3% month-on-month following the prior -0.7% reading — a medium-impact data point that will indicate whether Europe’s industrial engine is recovering. At 10:00 BST, the eurozone releases its Q1 2026 GDP final reading, forecast at +0.3% quarter-on-quarter versus a prior +0.2%, along with Employment Change data. The critical release of the day arrives at 13:30 BST: the US Non-Farm Payrolls for May, forecast at +85,000 against a prior +115,000. The unemployment rate is expected to tick up to 4.3% from 4.2%. Average Hourly Earnings are forecast at +0.3% month-on-month, unchanged from the prior reading. This is the dominant macro signal that will reset positioning across every market covered in this report.
Looking to the week ahead, the ECB Rate Decision on June 11 is the single most important European event in the near-term calendar, with a 25bp hike to 2.25% priced at 90% probability. The ECB press conference and updated staff projections will determine whether EUR/USD moves toward 1.17 or corrects back toward 1.155. On June 16 to 17, the FOMC Rate Decision is expected to result in a hold at 3.50 to 3.75%, with the dollar’s reaction depending primarily on the statement’s language around future hikes. On June 18, the Bank of England Rate Decision is forecast to hold at 3.75%, with GBP and EUR/GBP sensitive to any shift in the Bank’s forward guidance away from Governor Bailey’s current patient stance.
The setup for the remainder of today’s session is binary. A weak NFP print below 70,000 would revive Federal Reserve cut expectations, weaken the dollar, and provide relief across EUR/USD, gold, crypto, and risk assets broadly. A strong NFP above 100,000 would reinforce the Fed-hold narrative, support the dollar, cap EUR/USD gains near 1.160, and maintain pressure on BNB and the broader crypto complex. Corn remains structurally bearish regardless of macro data — no NFP print changes US crop ratings, Brazilian export volumes, or the supply glut. Reduce pre-NFP leverage and tighten stops across all live positions.
European Session Summary — 5 June 2026
Friday’s European session is defined by a central paradox: the European Central Bank is about to hike interest rates for the first time in this cycle — and yet the euro’s reaction is muted, the CAC 40 is barely positive, and AstraZeneca is drifting. The reason is not obscure: nearly everything about the June 11 ECB meeting is already priced. What is not yet priced is whether Christine Lagarde will deliver the hawkish guidance — specifically, an explicit September commitment — that would justify a more sustained EUR/USD rally toward 1.17 and beyond.
The actionable playbook for the remainder of the European session and into the US NFP release at 13:30 BST is bifurcated. In a weak NFP scenario of +70,000 or below, expect EUR/USD to push toward 1.170 to 1.175, EU 20-year yields to ease slightly, and BNB/USD to find temporary support above $590. In a strong NFP scenario of +110,000 or above, expect USD strength to cap EUR/USD near 1.160, Bund yields to push toward 3.08% as both central banks stay hawkish, and BNB to re-test the $560 support zone. Corn remains structurally bearish regardless of macro data. Lead is range-bound and patient.
The biggest near-term event risk remains the ECB on June 11, not today’s NFP. Reduce pre-NFP leverage, maintain EUR/USD long bias but tighten stops, and use any dip in AstraZeneca toward £13,000 as a medium-term accumulation opportunity ahead of the July 27 earnings catalyst. The EU 20-year bond remains a tactical short duration position — sell rallies, target 3.75% yield by September if the ECB hike cycle is confirmed as multi-move.
Full report available at Capital Street FX: https://www.capitalstreetfx.com/market-analysis/ecb-eve-euro-firms-cac-steadies-european-session-5-june-2026/

Comments
No comments yet. Be the first to share your thoughts!
Authentication Required
You must be logged in to post a comment.