Bar Pipa
We pay for a post of 10$

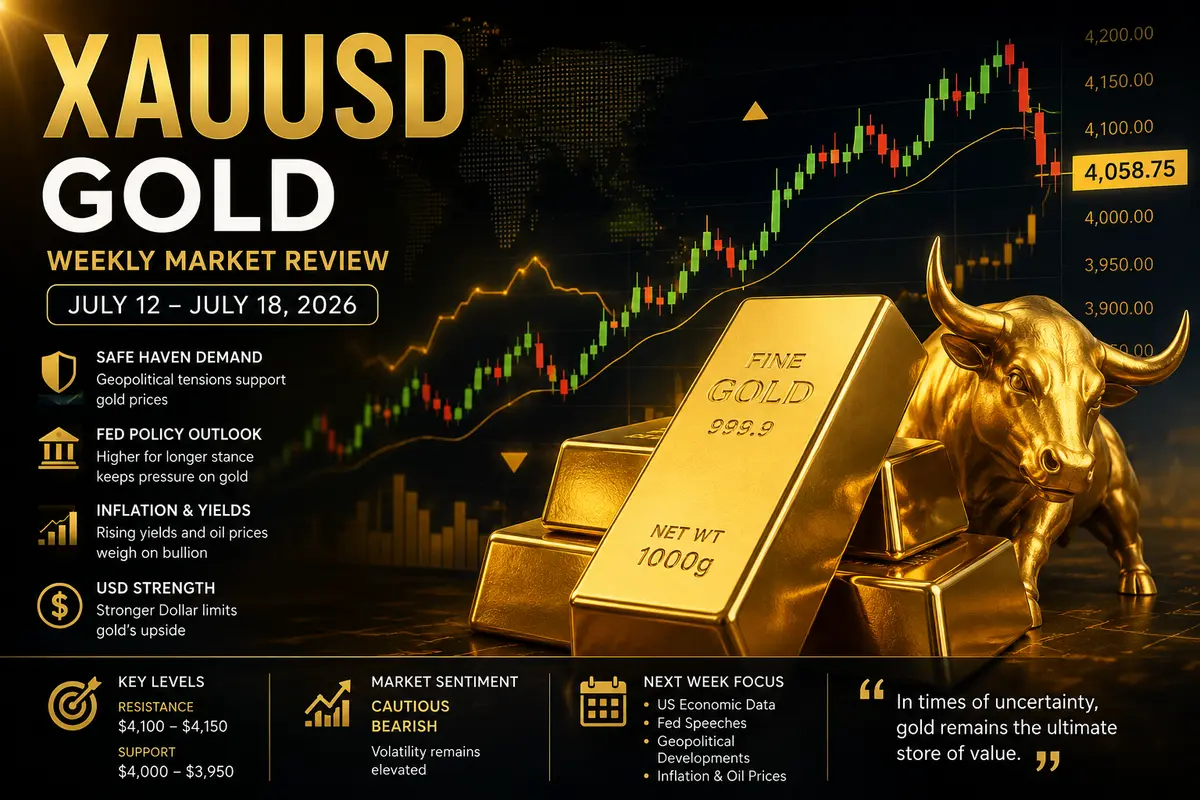
Gold (troy ounce) / U.S. Dollar

XAUUSD FOREX

4,091.3100
-0.93%

Key Statistics

Volume
298,190
Open
4,119.6350
Day Range
4,088.5600 - 4,141.2750
52W Range
3,268.1200 - 5,602.2250
Price AVG 50
4,197.9800
Prev Close
4,129.7600

About Gold (troy ounce) / U.S. Dollar

Gold (troy ounce) / U.S. Dollar is a foreign exchange currency pair. It represents the relative value between the two currencies and is traded on the global decentralized forex market.

Asset Type: Currency Pair
Base Currency: USD

Discussion

Authentication Required

You must be logged in to post a comment.

GFATHER

Session Liquidity & Killzones: Timing the Algorithmic Order Flow

Session Liquidity & Killzones: Timing the Algorithmic Order Flow

In financial markets, when you trade is just as critical as what you trade. You can identify a textbook Fair Value Gap or a pristine Order Block, but if you execute during a low-volume consolidation phase, price will likely drag sideways, chop you out, or fail to expand toward your target.

Institutional algorithms do not operate uniformly across 24 hours. Instead, they release massive liquidity injections during specific, highly predictable time windows known as Killzones.

Understanding the interplay between global trading sessions and session liquidity allows you to align your executions directly with the daily institutional cycle.

The Global Session Breakdown

The 24-hour trading day is split into three primary geographic sessions. Each session serves a distinct structural purpose within the Interbank Price Delivery Algorithm (IPDA):

1. The Asian Session (Accumulation Phase)

  • Role: Range Bound / Liquidity Generation

  • Characteristics: Asian trading volume is significantly lower compared to London or New York. The market typically forms a tight horizontal range, building up Asian Highs (Buy-Side Liquidity) and Asian Lows (Sell-Side Liquidity).

  • Trader Objective: Do not trade the Asian range breakout. Treat the Asian Session High and Low as prime targets to be swept later in the day.

2. The London Session (Manipulation Phase)

  • Role: The Judas Swing / True Low or High of the Day

  • Characteristics: London opens with a surge of volatility. Algorithms frequently engineer a false breakout—driving price past the Asian High or Low to hunt stop losses and tap into a higher-timeframe Point of Interest (POI).

  • Trader Objective: Look for liquidity sweeps of the Asian range during the London Killzone to catch the real reversal expansion.

3. The New York Session (Expansion & Distribution Phase)

  • Role: Macro Acceleration or Reversal

  • Characteristics: New York brings maximum liquidity as...

Continue reading...
0
0
pixel

The Blueprint to Consistent Capital Growth: Mastering Simplicity and Trading Psychology

The Blueprint to Consistent Capital Growth: Mastering Simplicity and Trading Psychology

Trading is often misconstrued as a game of highly complex algorithms and predictive superpowers. However, when you observe professional traders pulling apart the strategies of developing traders, a glaring truth emerges: beginners overcomplicate their charts, while professionals ruthlessly simplify theirs.

If your goal is to systematically grow your capital over a standard 20-day trading cycle, the secret does not lie in adding more indicators to your MetaTrader 5 interface. It lies in refining your trading psychology, aligning yourself with the higher timeframes, and executing a singular, masterfully understood edge. Here is the professional blueprint for tearing down a flawed trading model and rebuilding it for consistent profitability.

The Trap of Over-Complication

The most common hurdle for traders who understand the mechanics of the market but struggle to build their account balance is over-complication. More data does not equal more profit; it often results in analysis paralysis.

Confluences as a Coping Mechanism

Many developing traders stack confluences on top of each other — waiting for a liquidity sweep, an internal market structure shift, a 79% Fibonacci retracement, and a fair value gap all to align perfectly on the 1-minute chart. While this sounds incredibly precise, professionals recognize this behavior as a psychological coping mechanism.

By demanding a flawless setup, you are inadvertently protecting yourself from taking the trade and facing a potential loss. This extreme strictness drops your trade frequency to near zero. You end up missing the most explosive, high-probability moves because price simply tapped a 15-minute gap and ran without giving you that deep 79% pullback. Trading is an exercise in managing probabilities, not demanding perfection.

The Strategy Hopping Syndrome

Running two entirely different strategies concurrently — such as an EMA crossover model alongside a Smart Money Concepts (SMC) liquidity model — guarantees that you master neither. Conflicting signals...

Continue reading...
0
0
GFATHER

XAU/USD (Gold): The Market Is Moving Higher, but Is Momentum Starting to Hide a Bigger Story?

XAU/USD (Gold): The Market Is Moving Higher, but Is Momentum Starting to Hide a Bigger Story?

XAUUSD ... XAU/USD (Gold): The Market Is Moving Higher, but Is Momentum Starting to Hide a Bigger Story?

Gold has spent the last few sessions reminding traders why it remains one of the most watched markets in the world. Strong bullish candles, healthy buying pressure and steady advances have kept the overall structure pointing upward. Every dip has been met with fresh demand, and every attempt by sellers to slow the rally has been answered by another wave of buying. Looking at the chart alone, it would be easy to conclude that the only direction worth considering is higher.

I think the picture is a little more interesting than that.

Whenever a market trends strongly, there comes a stage where the conversation changes. It stops being about whether buyers are in control and starts becoming about whether buyers still have enough energy to keep pushing. That is where I believe gold is beginning to find itself.

The first thing that caught my attention wasn't the size of the recent rally. It was the way price has started behaving after reaching fresh highs. Earlier in the move, buyers appeared comfortable paying higher prices almost immediately after every small pullback. More recently, the market has started spending longer periods moving sideways before attempting another push. That doesn't necessarily mean the trend is over, but it does suggest the pace is changing.

Strong trends often slow down before they speed up again.

They also slow down before reversing.

The challenge is knowing which situation we're dealing with.

One reason I remain constructive on gold is because the broader market structure hasn't changed. Higher highs are still being followed by higher lows, and buyers continue defending important support levels whenever price begins to retrace. As long as that sequence remains intact, it becomes difficult to...

Continue reading...
0
0

Gold Climbs Back Above $4,000 as Geopolitical and Inflation Risks Push Prices Higher

Gold Climbs Back Above $4,000 as Geopolitical and Inflation Risks Push Prices Higher

Monday: The Precious Metal Returns to the Spotlight

XAUUSD ... Gold began the new trading week with solid gains. Prices of the precious metal climbed back above the psychologically important level of $4,000 per ounce, rising by 0.4% to $4,024.72. Gold futures performed even more strongly, gaining 0.5% to reach $4,029.87.

The recovery came after gold closed 0.2% lower on the previous Friday. The market has once again shifted its attention to geopolitical risks, which remain the main driving force behind demand for safe-haven assets. The conflict in the Middle East continues to escalate, prompting investors to seek protection in gold.

Silver also advanced, with XAGUSD ... rising by 0.9% to $56.93 per ounce. Platinum, however, declined by 0.2% to $1,594.30. This mixed performance suggests that investors are choosing gold as the most reliable safe-haven asset amid geopolitical uncertainty.

The Middle East: Escalation and Signs of Diplomacy

The situation in the Middle East remains tense. The United States continues to carry out strikes on Iranian targets, while President Donald Trump warned Tehran that it would “pay” for the deaths of three American service members in recent days. This tough statement leaves little doubt that Washington has no intention of backing down.

Regional uncertainty has been intensified by a threat from Yemen’s Iran-backed Houthi movement to impose a naval blockade on Saudi Arabia. This poses a serious risk to shipping in the Red Sea, one of the world’s key routes for energy supplies. In response, the Saudi-led military coalition has strengthened measures to protect maritime traffic.

However, there are also signs of hope for a diplomatic resolution. Iran said that mediators were discussing proposals aimed at de-escalating the conflict. Reuters reported on a proposed 10-day suspension of strikes, easing concerns about an immediate escalation. Markets breathed a sigh of relief, although only cautiously....

Continue reading...
0
0

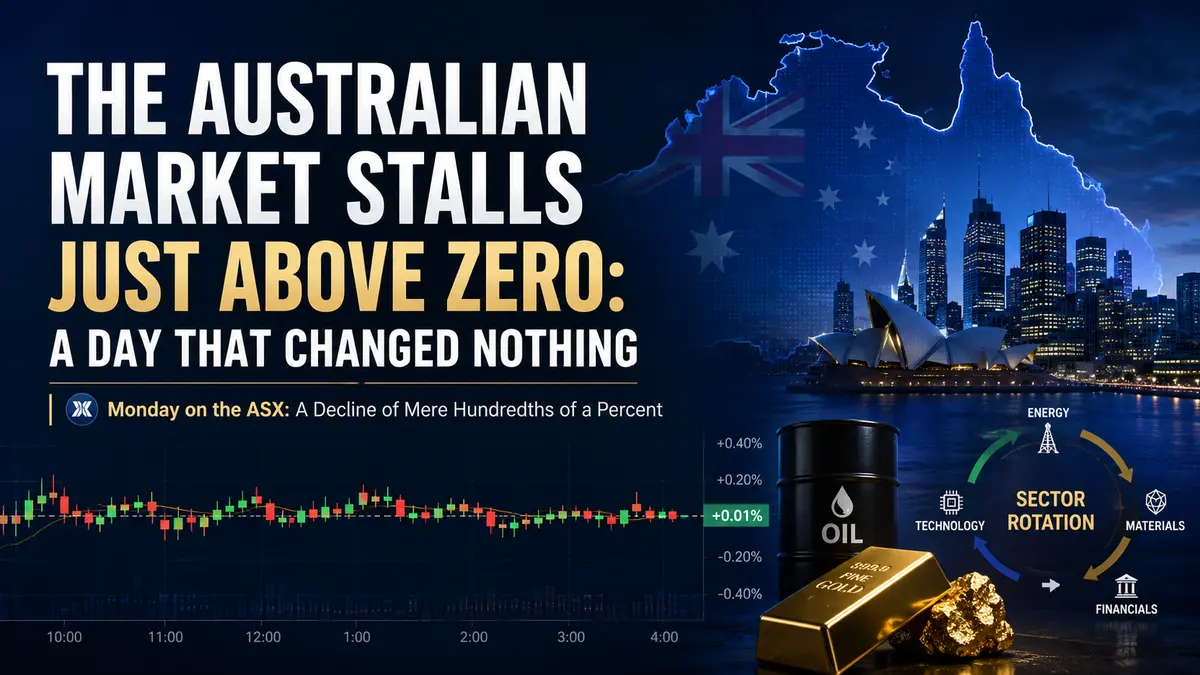
The Australian Market Stalls Just Above Zero: A Day That Changed Nothing

The Australian Market Stalls Just Above Zero: A Day That Changed Nothing

Monday on the ASX: A Decline of Mere Hundredths of a Percent

The Australian stock market ended the first trading day of the week with an almost imperceptible move lower. The S&P/ASX 200 Index lost just 0.06%—such an insignificant amount that it could easily be dismissed as statistical noise. Yet behind this microscopic decline was a day full of contrasts: some companies surged, others fell to record lows, while the overall result remained virtually unchanged.

Trading on the Sydney Stock Exchange was marked by a tug-of-war. The information technology, utilities, and healthcare sectors pushed the index lower, while other industries attempted to keep it afloat. In the end, the battle finished in a draw—but the apparent calm was deceptive. Within the market, a genuine drama was unfolding, with winners and losers changing places at a dizzying pace.

The final tally showed 583 declining stocks compared with 485 advancing stocks, while 389 shares remained virtually unchanged. This suggests that sellers outnumbered buyers, but the overall decline remained minimal because the day’s strongest performers delivered impressive gains.

The Top Three Performers: Who Pulled Ahead?

Against a backdrop of general stagnation, three companies posted impressive gains of more than 4%.

Yancoal Australia, a coal-mining company, took first place, rising 6.16% to AUD 5.69. The strength of the coal sector was no coincidence. Energy prices surged amid the escalation of the conflict in the Middle East, making coal increasingly attractive as an alternative source of energy. Investors concerned about potential disruptions to oil supplies have been shifting toward coal-related assets, placing Yancoal at the centre of this trend.

Contact Energy, a New Zealand energy company, ranked second after gaining 4.56% to AUD 7.80. Interestingly, Contact Energy is traded on the Australian exchange, although its core business is concentrated in New Zealand. The rise in...

Continue reading...
0
0

Oil Breaks Above $90: The Middle East Is on Fire Again

Oil Breaks Above $90: The Middle East Is on Fire Again

Monday in the Commodity Market: Oil Jumps 3%

The first day of the week began with a powerful surge in the oil market. Brent BZUSD ... crude futures jumped 3%, breaking through the psychologically important level of $90 per barrel and reaching $90.75. This was their highest level in more than five weeks. US West Texas Intermediate crude was not far behind, gaining 2.5% to reach $83.85 per barrel.

The reason for such a sharp move was not technical factors or inventory data, but the escalation of the military conflict between the United States and Iran, which entered a new and more dangerous phase over the weekend.

The conflict in the Middle East has already been underway for several weeks, but the events of the past weekend marked a turning point. The United States Central Command, or CENTCOM, confirmed that it carried out new strikes against Iranian targets on Sunday evening.

This was not simply another military operation. It was a response to an Iranian attack on a US base in Jordan that killed at least two American service members and injured many others. For the United States, this represented the crossing of a red line, and the response came quickly.

The most alarming development, however, is not the individual strikes themselves, but their geographical scope and intensity. According to reports, the US military is attacking a broader range of targets inside Iran rather than limiting its operations to border areas. Iran, in turn, has intensified its attacks on neighbouring Gulf states.

The conflict is no longer localised and is beginning to spread across the entire region.

The Strait of Hormuz: A Vital Artery Under Threat

The Strait of Hormuz remains at the centre of the military confrontation. It is a strategically important waterway through which approximately 30% of the world’s...

Continue reading...
0
0

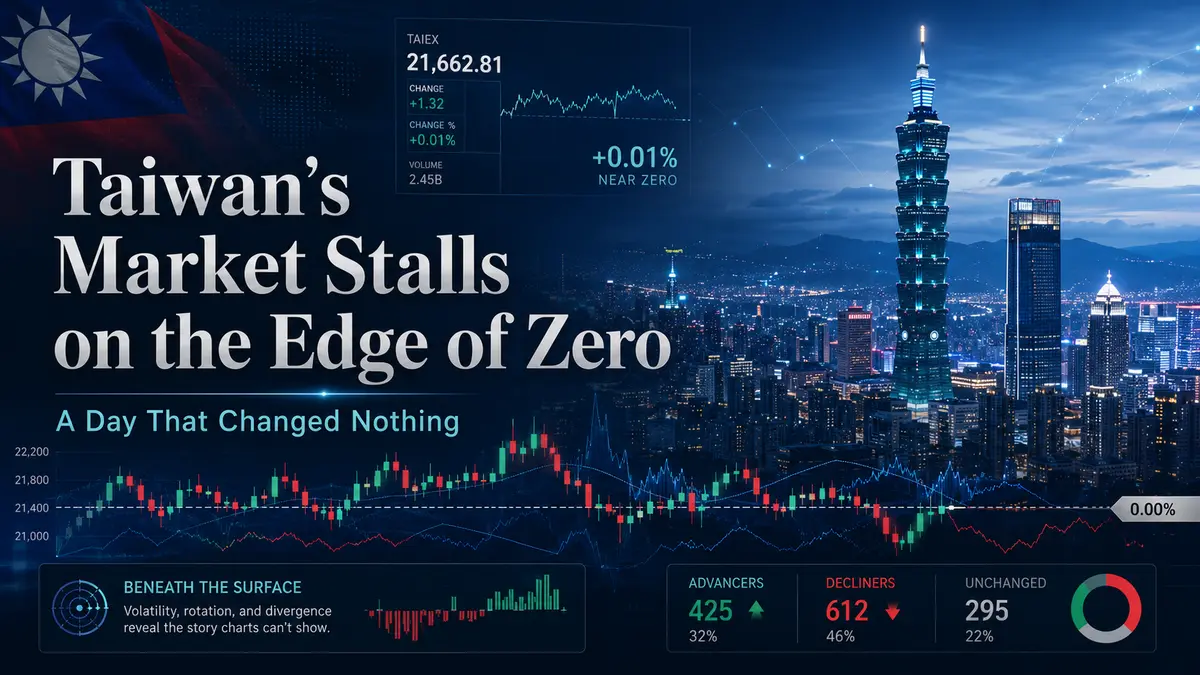
Taiwan’s Market Stalls on the Edge of Zero: A Day That Changed Nothing

Taiwan’s Market Stalls on the Edge of Zero: A Day That Changed Nothing

Friday on the Taiwan Stock Exchange: A Decline of Just Hundredths of a Percent

Taiwan’s stock market ended Friday’s trading session with an almost imperceptible move lower. The Taiwan Weighted Index lost just 0.01%—such an insignificant amount that it could easily be dismissed as a rounding error, were it not for the drama concealed behind it. This microscopic decline masked major sectoral shifts, record-breaking rallies in some stocks, and plunges to historic lows in others. In other words, it was a day when the market as a whole went nowhere, even though almost everything imaginable was happening beneath the surface.

Trading presented a classic picture of opposing forces. Shares in the glass manufacturing and plastics sectors dragged the market lower, while other industries attempted to keep it afloat. The battle ultimately ended in a draw, with the index remaining virtually unchanged. Yet behind this statistical tie was genuine chaos, as some companies soared while others plunged into the abyss. That was perhaps the most interesting feature of the day’s trading session.

The Top Three Performers: Who Pulled Ahead?

Against the backdrop of overall index stagnation, three companies posted impressive gains, with all three rising by exactly 10%. This may not have been a simple coincidence. Such synchronized performance suggests that common market factors were at work, or that the stocks simply reached their daily price increase limits at the same time.

Lee Chi Enterprises, a manufacturer of bicycle components, gained 1.10 points to close at 12.10. This 10% increase pushed the shares to new levels. The company, which specializes in producing bicycle parts, may have benefited from growing interest in green mobility or from the announcement of new contracts.

Giant Manufacturing, the internationally renowned bicycle producer, delivered an even more impressive move. Its shares climbed 8 points to 88.00, also...

Continue reading...
0
0

Gold Returns to Positive Territory as Asian Session Gives Investors Hope

Gold Returns to Positive Territory as Asian Session Gives Investors Hope

Friday’s Opening: The Yellow Metal Attempts to Recover Its Losses

Friday began on an encouraging note for the precious metals market. August gold futures XAUUSD ... on COMEX gained 0.24% and were trading at $3,982.45 per troy ounce. This is a modest but meaningful move after several days of pressure, during which the metal even fell below the psychologically important $4,000 level.

The gold market currently resembles an athlete who has just lost a race but is already gathering strength for the next one. The previous day’s decline was significant, and investors watched anxiously as the price moved further away from its recent highs. However, the morning rebound demonstrated that demand for gold has not disappeared—it was simply waiting for the right moment.

Notably, gold is rising despite a stronger U.S. dollar. The U.S. Dollar Index increased by 0.03% on Friday to 100.60. Although this movement is largely symbolic, a stronger dollar usually works against gold. In this case, however, the dollar weakness observed earlier in the week continues to support the metal, even as the U.S. currency attempts to recover. Investors appear to have concluded that geopolitical risks outweigh short-term currency fluctuations.

Technical Outlook: Support and Resistance Set the Rules

Technical indicators on Friday present a relatively clear picture. Support is located at $3,974.15, where buyers entered the market and prevented the price from falling further. Resistance is considerably higher at $4,112.50. The distance between these levels is almost $140, giving traders plenty of room to maneuver.

Interestingly, the current price of $3,982.45 is very close to the lower boundary of this range. This means buyers still have considerable work to do before gold can return to levels above $4,000. Nevertheless, the fact that the metal found support and rebounded from it suggests that many investors consider current prices attractive...

Continue reading...
0
0

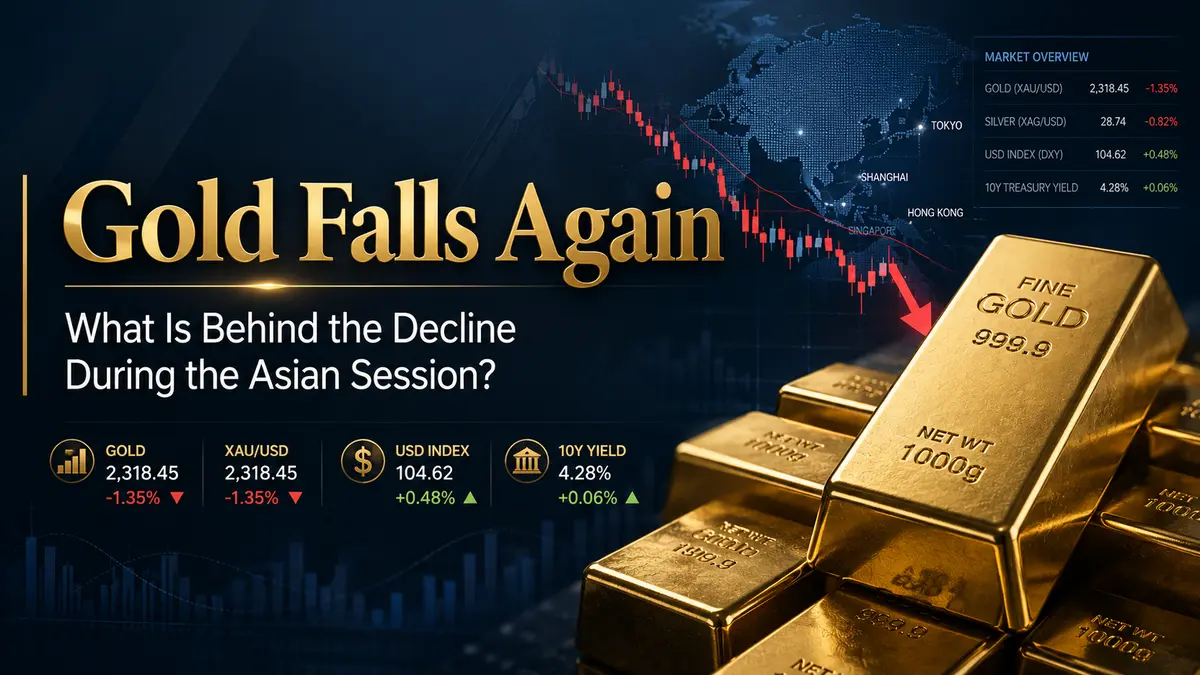
Gold Falls Again: What Is Behind the Decline During the Asian Session?

Gold Falls Again: What Is Behind the Decline During the Asian Session?

Thursday Morning: Gold Opens in Negative Territory

Asian trading on Thursday began with the gold market deciding to cool off slightly. COMEX gold futures for August delivery fell by approximately half a percent, settling at around $4,032 per troy ounce. At first glance, the decline appears modest—just 0.49%. However, in the gold market, even movements of this size are rarely accidental. Behind every change in price are investors’ expectations, fears, and calculations.

Interestingly, the decline is taking place against a backdrop of rather contradictory signals from global markets. On the one hand, the US dollar strengthened slightly, with the USD Index rising by a symbolic 0.03% to 100.30. This movement can hardly be described as a confident surge, but because gold generally has an inverse relationship with the US currency, even a slight indication of dollar strength can be enough to trigger a price correction.

On the other hand, the geopolitical situation remains tense, which would normally encourage investors to move into safe-haven assets—gold above all.

However, markets, as we know, do not always behave according to textbooks. The current dynamics of gold provide a perfect example.

Technical Picture: The Levels Everyone Is Watching

Technical indicators present a highly revealing picture. The low of today’s session was $3,990.40 per ounce. This is not merely a random figure—it represents a significant support level that traders have been monitoring for several weeks. A break below this level could open the way for a deeper correction, but buyers are continuing to defend it for now.

Resistance is located considerably higher, at $4,144.60. The price is fluctuating between these two levels as it attempts to find equilibrium. A range of almost $150 is substantial for gold, but looking at the metal’s performance over recent months, the market has already become accustomed to such price...

Continue reading...
0
0

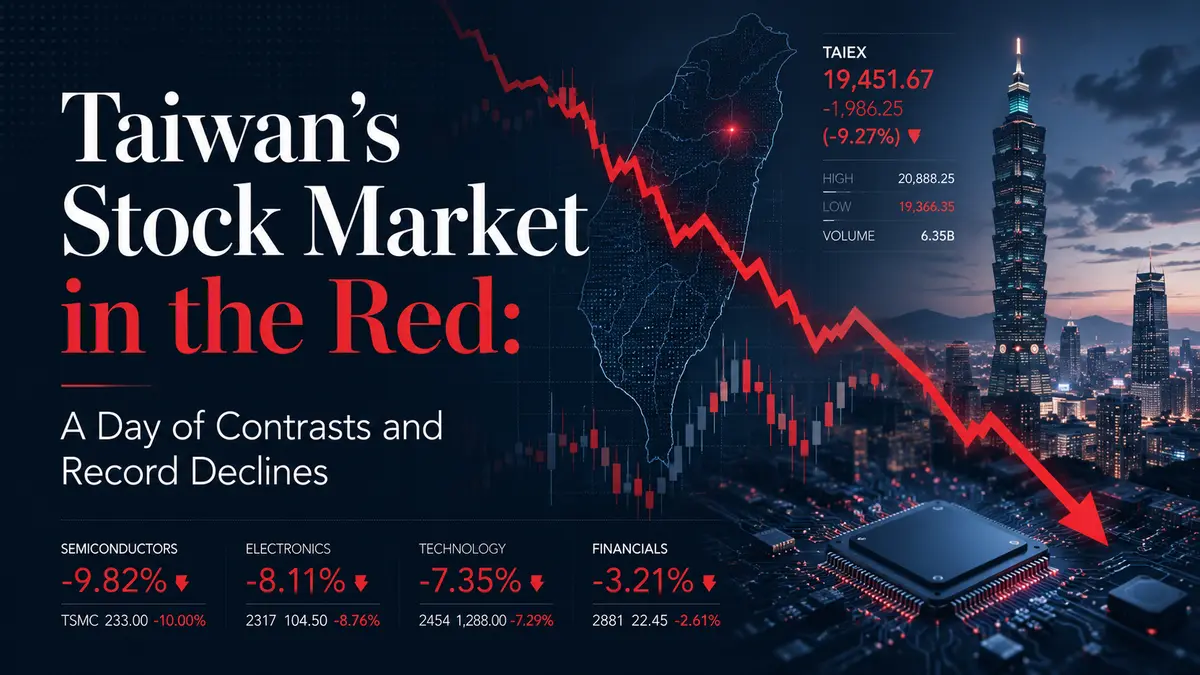
Taiwan’s Stock Market in the Red: A Day of Contrasts and Record Declines

Taiwan’s Stock Market in the Red: A Day of Contrasts and Record Declines

Introduction: The End of Moderate Optimism

Wednesday marked a reversal for Taiwan’s stock market after two days of moderate gains. The Taiwan Weighted Index fell by 1.42%, reflecting negative sentiment across the optoelectronics and machinery sectors. This was the market’s most significant decline in several days and signaled a return of caution among investors.

Against the backdrop of global uncertainty caused by geopolitical tensions in the Middle East and mixed signals from the Federal Reserve, investors chose to lock in profits and reduce their exposure to risk. However, as is often the case in Taiwan’s stock market, several companies still delivered impressive gains despite the broader decline.

Shares of Ene Technology Inc, Mospec Semiconductor Corp, and Hocheng Corp surged by approximately 10%, reaching their maximum daily gains. Meanwhile, Excel Cell Electronic Co Ltd, Holy Stone Enterprise Co Ltd, and Yeong Guan Energy Technology Group Co Ltd were among the biggest decliners, with the latter falling to a new all-time low.

In this article, we will examine the day’s key developments, assess the impact of external factors, and consider where Taiwan’s stock market may be heading in the coming days.

Top Gainers: Who Benefited in a Falling Market

Ene Technology Inc: Up 9.99%

Shares of Ene Technology Inc were among the most notable exceptions during the broader market decline. The stock rose by 9.99% to TWD 39.65, reaching the maximum permitted daily gain. This impressive increase indicates strong investor interest in the company.

Ene Technology Inc specializes in the production of electronic components. The company may have benefited from continued strength in certain areas of the electronics industry despite the overall decline in the index.

Mospec Semiconductor Corp: Up 9.96%

Shares of Mospec Semiconductor Corp increased by 9.96% to TWD 75.10. This was also close to the maximum gain the stock...

Continue reading...
0
0
Navigation menu
instaforex banner