

The Blueprint to Consistent Capital Growth: Mastering Simplicity and Trading Psychology

Trading is often misconstrued as a game of highly complex algorithms and predictive superpowers. However, when you observe professional traders pulling apart the strategies of developing traders, a glaring truth emerges: beginners overcomplicate their charts, while professionals ruthlessly simplify theirs.
If your goal is to systematically grow your capital over a standard 20-day trading cycle, the secret does not lie in adding more indicators to your MetaTrader 5 interface. It lies in refining your trading psychology, aligning yourself with the higher timeframes, and executing a singular, masterfully understood edge. Here is the professional blueprint for tearing down a flawed trading model and rebuilding it for consistent profitability.
The Trap of Over-Complication
The most common hurdle for traders who understand the mechanics of the market but struggle to build their account balance is over-complication. More data does not equal more profit; it often results in analysis paralysis.
Confluences as a Coping Mechanism
Many developing traders stack confluences on top of each other — waiting for a liquidity sweep, an internal market structure shift, a 79% Fibonacci retracement, and a fair value gap all to align perfectly on the 1-minute chart. While this sounds incredibly precise, professionals recognize this behavior as a psychological coping mechanism.
By demanding a flawless setup, you are inadvertently protecting yourself from taking the trade and facing a potential loss. This extreme strictness drops your trade frequency to near zero. You end up missing the most explosive, high-probability moves because price simply tapped a 15-minute gap and ran without giving you that deep 79% pullback. Trading is an exercise in managing probabilities, not demanding perfection.
The Strategy Hopping Syndrome
Running two entirely different strategies concurrently — such as an EMA crossover model alongside a Smart Money Concepts (SMC) liquidity model — guarantees that you master neither. Conflicting signals will drain your mental capital before you even enter a position. Professional traders master one single approach, thoroughly backtest their data, and execute it relentlessly. If you want to see real growth, pick one framework, discard the rest, and commit to mastering its nuances across different market conditions.
Framing the Market: Higher Timeframe Alignment
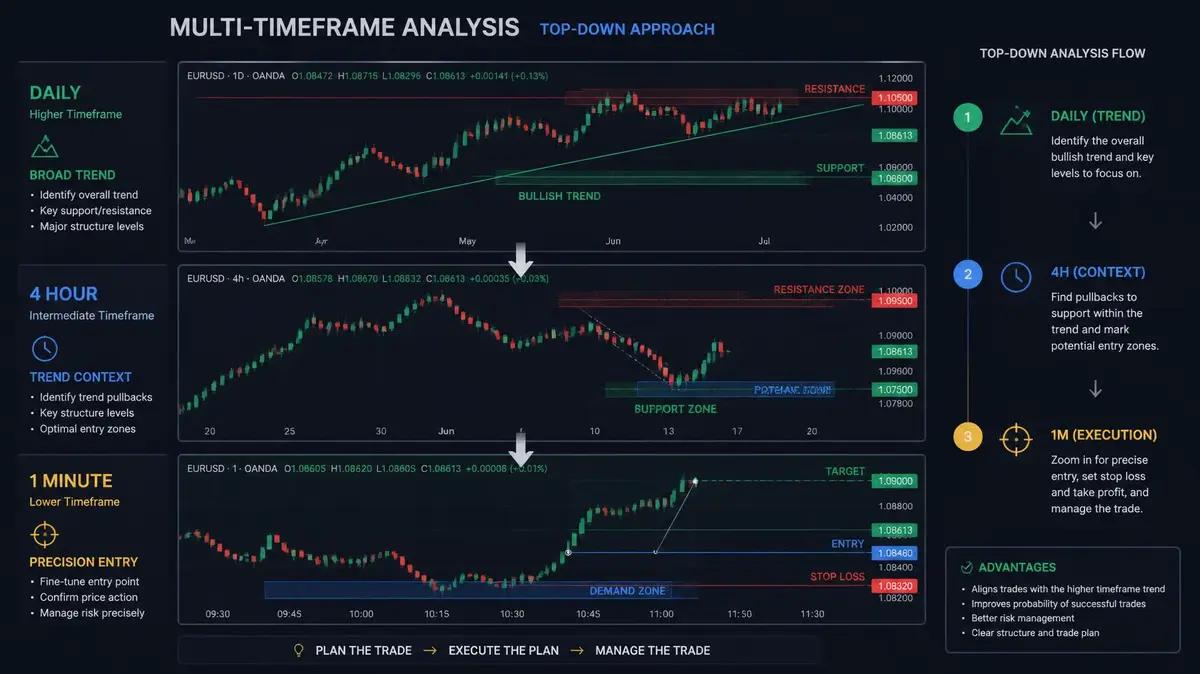
Executing on the 1-minute chart is completely viable, but only if your bias is dictated by the Daily and Weekly charts. The lower timeframes are filled with manipulation and noise; the higher timeframes tell you the true institutional narrative.
Decoding the Weekly OHLC Profile
To stop guessing where the price will go, you must understand the Weekly OHLC (Open, High, Low, Close) profile. Markets typically follow a structured rhythm throughout the week:
-
Monday (Accumulation): The market opens and builds initial positions, often chopping in a tight range.
-
Tuesday or Wednesday (Manipulation): The market makes a deceptive move to trap early retail traders, forming the High or the Low of the week.
-
Wednesday to Thursday (Distribution): The true directional move occurs, aggressively expanding toward the higher timeframe draw on liquidity (DOL).
-
Friday: Price often slows down and retraces slightly back into the weekly range to close.
When you anticipate this rhythm, you stop panic-selling on a Tuesday morning fake-out. You recognize it as the manipulation phase setting up the true move for the week.
Translating Weekly Bias to Daily Targets
Once you have your weekly bias (e.g., heavily bearish), you should only look for short setups. Counter-trend trading on lower timeframes is a fast track to draining your account. Map out the 4-Hour and Daily, Points of Interest : such as unmitigated order blocks or large fair value gaps. When trading a highly volatile asset like XAUUSD ... Gold, these massive higher-timeframe levels act like magnets. Price will gravitate toward them, providing you with a clear, undeniable target.
The Professional 4-Step Execution Checklist
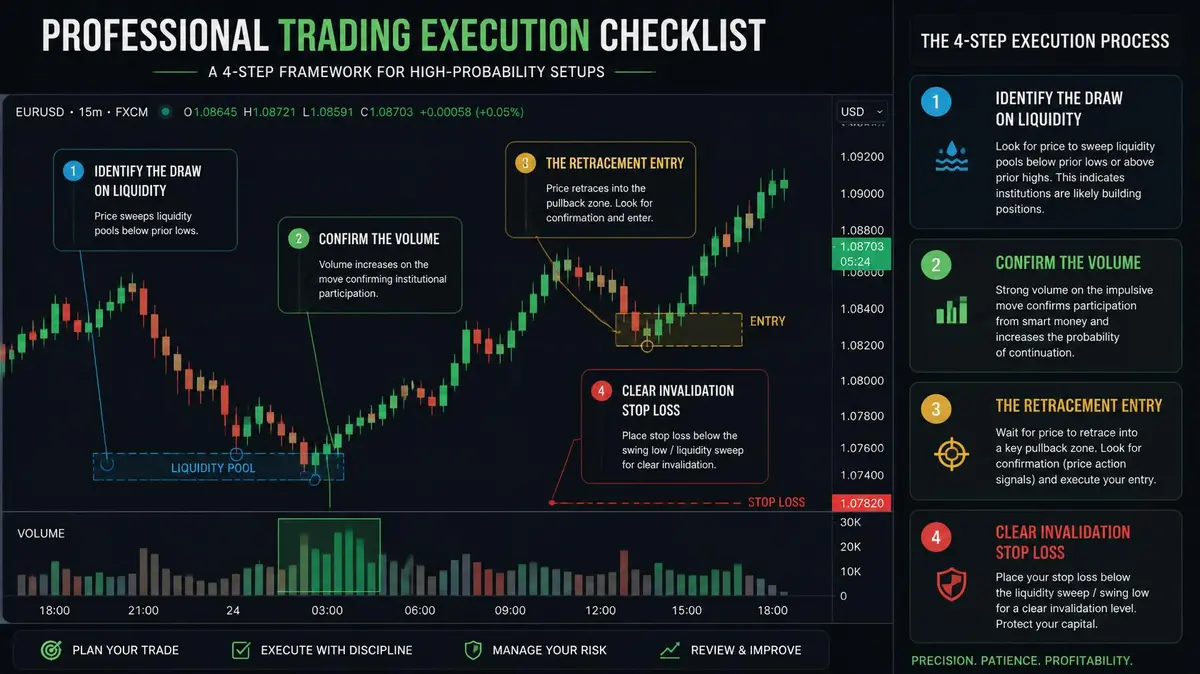
When the session opens and volume pours into the market, you must transition from an analyst into an executor. Use this professional four-step framework to keep your entries objective and stress-free.
Step 1: Identify the Draw on Liquidity
Before you click buy or sell, you must know exactly where the price is trying to go. Are there prominent Asia session highs resting just above the current price? Is there an untouched London low? This is your draw on liquidity. If you do not know where the price is going, you are gambling. Your goal is to react to the market’s intent, not predict it blindly.
Step 2: Confirm the Volume
When the opening bell rings, wait for the market to show its hand. Look for a strong 5-minute or 15-minute candle closure that points in the direction of your predetermined draw on liquidity. This confirms that institutional volume is aligning with your higher-timeframe bias.
Step 3: The Retracement Entry
Never buy at the absolute top just because momentum looks strong. If the market pushes up rapidly, wait for it to pull back into a 5-minute or 15-minute fair value gap. As the professionals say: you don’t buy a TV at $100 just to sell it at $120; you wait to buy it at $80 to sell at $120. Play the retracement for a superior entry price.
Step 4: Clear Invalidation (Stop Loss)
Your stop loss must be placed at a level that, if hit, completely invalidates your trade idea. If you enter off a 15-minute gap, your stop goes below the structural swing low that created the gap. Once the stop is set, leave it alone. Do not move it prematurely just because the 1-minute chart looks briefly intimidating.
Forging Bulletproof Trading Psychology

A flawless technical strategy will still lose money if the operator behind the keyboard lacks emotional discipline. Fixing your psychology is the final, most crucial step to turning your trading around.
The Myth of the Infinite Risk-to-Reward Ratio
Many traders get greedy, constantly aiming for 1:8 or 1:10 Risk-to-Reward (RR) ratios. They hold winning trades far too long, only to watch them reverse and stop them out at break-even. If you are risking a strict 2% of your capital per trade, securing a solid 1:1.5 or 1:2 RR on a consistent basis is highly profitable. A 3% to 4% gain on a single trade is substantial. Do not sacrifice a guaranteed win just to satisfy your ego with a massive RR screenshot. Book the profit, protect your capital, and move on.
Surviving the “Chop” and Trusting the Trade
The hardest part of trading is sitting in a live position while the market chops sideways. Amateurs will meticulously watch every 1-minute candle, feel their heart rate spike on every red tick, and manually close the trade out of fear — right before the market explodes in their intended direction.
This is where your higher timeframe alignment saves you. If your 4-Hour bias is intact and your stop loss is safely behind structural invalidation, you must let the trade breathe. Accept the risk the moment you open the position. Mindset is everything; trust your analysis, detach your emotions, and let the probabilities play out.

Comments
No comments yet. Be the first to share your thoughts!
Authentication Required
You must be logged in to post a comment.