Bar Pipa
We pay for a post of 10$

#AccountGrowth

GFATHER

Standard Deviation Projections & Institutional Price Targets: Precision Exit Strategies
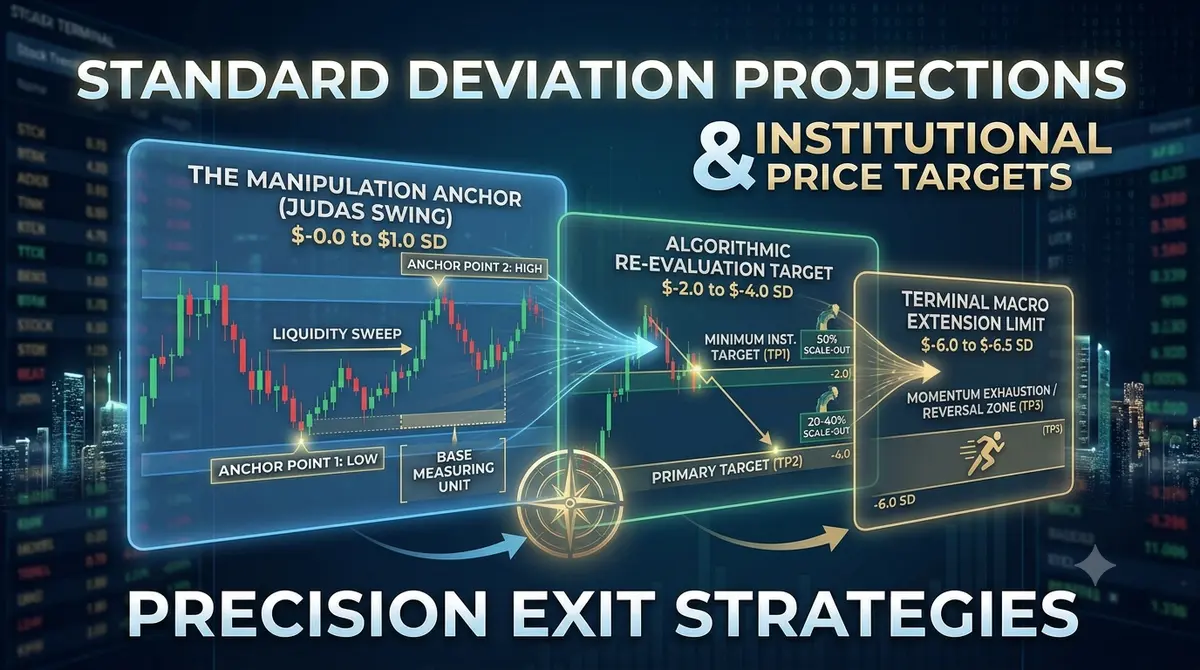
Standard Deviation Projections & Institutional Price Targets: Precision Exit Strategies

Standard Deviation Projections & Institutional Price Targets: Precision Exit Strategies

You can master top-down analysis, pinpoint pristine order blocks, and trade alongside IPDA cycles, but if you don't know where to take profits, you are leaving your equity curve to chance.

Holding a winning position too long out of greed often turns a pristine 1:5 Risk-to-Reward trade into a frustrating break-even stopout. Conversely, closing your trade too early out of fear caps your account growth and ruins your statistical edge.

Professional traders use Standard Deviation Projections derived from liquidity sweeps and manipulation legs (Judas Swings) to project exact mathematical targets where institutional algorithms are programmed to take profits and rebalance inventory.

Understanding the Anchor Leg: The Judas Swing

Standard Deviation projections are only as accurate as the anchor leg you measure. You do not place Fibonacci expansions randomly on any swing; you anchor them directly to the manipulation leg (the liquidity sweep).

What Defines a Valid Anchor Leg?

  1. The Sweep: Price drives past an established high or low (such as the Asian session high/low or previous day's extreme) into a higher-timeframe Point of Interest.

  2. The Shift: Immediately after sweeping liquidity, price violently reverses, creating a lower-timeframe Change of Character (CHOCH).

  3. The Measurement Box: The distance from the absolute low of the sweep to the absolute high of the displacement leg forms your base measuring unit ($1.0$ Standard Deviation).

Setting Up Your Standard Deviation Fibonacci Tool

To map algorithmic delivery targets, adjust your standard Fibonacci Extension tool to highlight institutional expansion levels.

Tool Settings:

  • $0.0$ to $1.0$: The Manipulation Range (The Anchor Leg)

  • $-2.0$ to $-2.5$: Minimum Institutional Target (TP1)

  • $-4.0$: Key Algorithmic Profit-Taking Target (TP2)

  • $-6.0$ to $-6.5$: Maximum Macro Extension Limit (TP3 / Terminal Expansion)

Executing the Multi-Stage Take-Profit Model

Rather than trying to guess the absolute top or...

Continue reading...
0
0
pixel

The Blueprint to Consistent Capital Growth: Mastering Simplicity and Trading Psychology

The Blueprint to Consistent Capital Growth: Mastering Simplicity and Trading Psychology

Trading is often misconstrued as a game of highly complex algorithms and predictive superpowers. However, when you observe professional traders pulling apart the strategies of developing traders, a glaring truth emerges: beginners overcomplicate their charts, while professionals ruthlessly simplify theirs.

If your goal is to systematically grow your capital over a standard 20-day trading cycle, the secret does not lie in adding more indicators to your MetaTrader 5 interface. It lies in refining your trading psychology, aligning yourself with the higher timeframes, and executing a singular, masterfully understood edge. Here is the professional blueprint for tearing down a flawed trading model and rebuilding it for consistent profitability.

The Trap of Over-Complication

The most common hurdle for traders who understand the mechanics of the market but struggle to build their account balance is over-complication. More data does not equal more profit; it often results in analysis paralysis.

Confluences as a Coping Mechanism

Many developing traders stack confluences on top of each other — waiting for a liquidity sweep, an internal market structure shift, a 79% Fibonacci retracement, and a fair value gap all to align perfectly on the 1-minute chart. While this sounds incredibly precise, professionals recognize this behavior as a psychological coping mechanism.

By demanding a flawless setup, you are inadvertently protecting yourself from taking the trade and facing a potential loss. This extreme strictness drops your trade frequency to near zero. You end up missing the most explosive, high-probability moves because price simply tapped a 15-minute gap and ran without giving you that deep 79% pullback. Trading is an exercise in managing probabilities, not demanding perfection.

The Strategy Hopping Syndrome

Running two entirely different strategies concurrently — such as an EMA crossover model alongside a Smart Money Concepts (SMC) liquidity model — guarantees that you master neither. Conflicting signals...

Continue reading...
0
0
Navigation menu
instaforex banner