Bar Pipa
We pay for a post of 10$

#TradingPsychology

joy

NZD/JPY: Buyers Are Still Leading the Market, but a Strong Resistance Zone Could Trigger the Next Big Decision
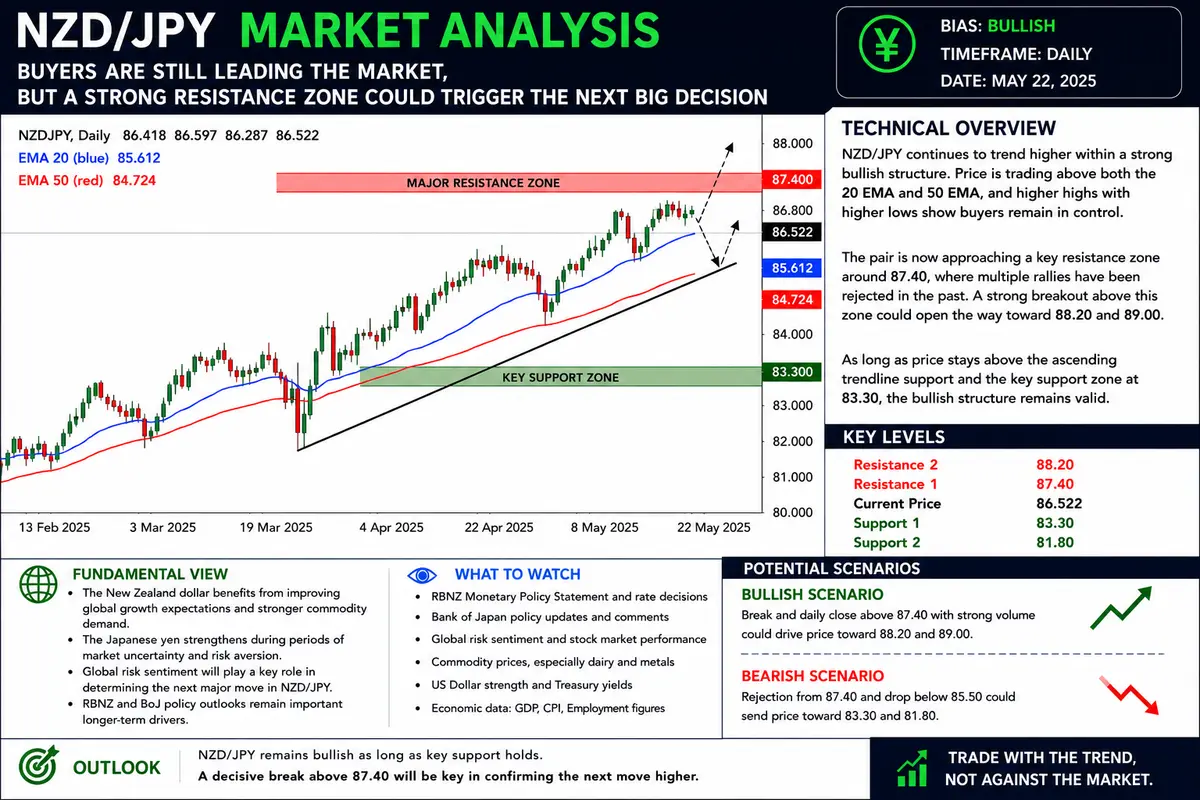
NZD/JPY: Buyers Are Still Leading the Market, but a Strong Resistance Zone Could Trigger the Next Big Decision

NZD/JPY has quietly maintained one of the cleanest bullish structures among the yen crosses over the last several trading sessions. While some markets have become increasingly volatile, this pair has respected technical levels with impressive consistency, allowing traders to identify the trend without constantly reacting to unpredictable price swings.

Looking at the current chart, I believe buyers still have the upper hand.

The overall structure continues to produce higher highs and higher lows, which remains one of the strongest characteristics of a healthy uptrend. Every meaningful pullback has found support before damaging the broader market structure, suggesting that demand continues to outweigh supply.

However, that does not mean the path higher will be easy.

The pair is now approaching an area where previous rallies have struggled to continue. This resistance zone has already proven its importance several times, making it the level that deserves the closest attention over the coming sessions.

One detail I particularly like about the current setup is the quality of recent corrections.

Instead of aggressive selloffs, the market has produced controlled pullbacks followed by renewed buying pressure. This usually indicates that traders are not abandoning long positions. Rather, they are using temporary weakness as an opportunity to re-enter the market.

That behaviour often supports longer-lasting trends.

Strong markets rarely move higher every single day.

Instead, they advance in stages.

They rally, consolidate, attract fresh buyers and then attempt another move higher.

NZD/JPY appears to be following exactly that pattern.

Support has continued performing exceptionally well throughout the recent advance. Every attempt to push below key demand areas has been met with enough buying pressure to stabilise the market before sellers could establish meaningful control.

That tells me buyers remain confident despite the slower pace.

Resistance, however, presents a different challenge.

Whenever price approaches previous highs, profit-taking...

Continue reading...
0
0
pixel

The Blueprint to Consistent Capital Growth: Mastering Simplicity and Trading Psychology

The Blueprint to Consistent Capital Growth: Mastering Simplicity and Trading Psychology

Trading is often misconstrued as a game of highly complex algorithms and predictive superpowers. However, when you observe professional traders pulling apart the strategies of developing traders, a glaring truth emerges: beginners overcomplicate their charts, while professionals ruthlessly simplify theirs.

If your goal is to systematically grow your capital over a standard 20-day trading cycle, the secret does not lie in adding more indicators to your MetaTrader 5 interface. It lies in refining your trading psychology, aligning yourself with the higher timeframes, and executing a singular, masterfully understood edge. Here is the professional blueprint for tearing down a flawed trading model and rebuilding it for consistent profitability.

The Trap of Over-Complication

The most common hurdle for traders who understand the mechanics of the market but struggle to build their account balance is over-complication. More data does not equal more profit; it often results in analysis paralysis.

Confluences as a Coping Mechanism

Many developing traders stack confluences on top of each other — waiting for a liquidity sweep, an internal market structure shift, a 79% Fibonacci retracement, and a fair value gap all to align perfectly on the 1-minute chart. While this sounds incredibly precise, professionals recognize this behavior as a psychological coping mechanism.

By demanding a flawless setup, you are inadvertently protecting yourself from taking the trade and facing a potential loss. This extreme strictness drops your trade frequency to near zero. You end up missing the most explosive, high-probability moves because price simply tapped a 15-minute gap and ran without giving you that deep 79% pullback. Trading is an exercise in managing probabilities, not demanding perfection.

The Strategy Hopping Syndrome

Running two entirely different strategies concurrently — such as an EMA crossover model alongside a Smart Money Concepts (SMC) liquidity model — guarantees that you master neither. Conflicting signals...

Continue reading...
0
0
Navigation menu
instaforex banner