
Bar Pipa
We pay for a post of 10$
ProShares Ultra Semiconductors

ProShares Ultra Semiconductors

USD AMEX

$92.55
+2.66%

Key Statistics

Market Cap
$1.92 B
Volume
517,643
Open
$86.57
Day Range
86.57 - 94.23
52W Range
39.33 - 116.50
Price AVG 50
$96.60

About ProShares Ultra Semiconductors

ProShares Trust - ProShares Ultra Semiconductors is an exchange traded fund launched and managed by ProShare Advisors LLC. It invests in public equity markets of the United States. The fund invests through derivatives in stocks of companies operating across information technology, semiconductors and semiconductor equipment sectors. The fund uses derivatives such as swaps to create its portfolio. The fund invests in growth and value stocks of companies across diversified market capitalization. The fund seeks to track 2x the daily performance of the Dow Jones U.S. Semiconductors Index, by using full replication technique. ProShares Trust - ProShares Ultra Semiconductors was formed on January 30, 2007 and is domiciled in the United States.

Asset Type: Common Stock
Sector: Financial Services
Industry: Asset Management

Discussion

Authentication Required

You must be logged in to post a comment.

GFATHER

Session Liquidity & Killzones: Timing the Algorithmic Order Flow

Session Liquidity & Killzones: Timing the Algorithmic Order Flow

In financial markets, when you trade is just as critical as what you trade. You can identify a textbook Fair Value Gap or a pristine Order Block, but if you execute during a low-volume consolidation phase, price will likely drag sideways, chop you out, or fail to expand toward your target.

Institutional algorithms do not operate uniformly across 24 hours. Instead, they release massive liquidity injections during specific, highly predictable time windows known as Killzones.

Understanding the interplay between global trading sessions and session liquidity allows you to align your executions directly with the daily institutional cycle.

The Global Session Breakdown

The 24-hour trading day is split into three primary geographic sessions. Each session serves a distinct structural purpose within the Interbank Price Delivery Algorithm (IPDA):

1. The Asian Session (Accumulation Phase)

  • Role: Range Bound / Liquidity Generation

  • Characteristics: Asian trading volume is significantly lower compared to London or New York. The market typically forms a tight horizontal range, building up Asian Highs (Buy-Side Liquidity) and Asian Lows (Sell-Side Liquidity).

  • Trader Objective: Do not trade the Asian range breakout. Treat the Asian Session High and Low as prime targets to be swept later in the day.

2. The London Session (Manipulation Phase)

  • Role: The Judas Swing / True Low or High of the Day

  • Characteristics: London opens with a surge of volatility. Algorithms frequently engineer a false breakout—driving price past the Asian High or Low to hunt stop losses and tap into a higher-timeframe Point of Interest (POI).

  • Trader Objective: Look for liquidity sweeps of the Asian range during the London Killzone to catch the real reversal expansion.

3. The New York Session (Expansion & Distribution Phase)

  • Role: Macro Acceleration or Reversal

  • Characteristics: New York brings maximum liquidity as...

Continue reading...
0
0
GFATHER

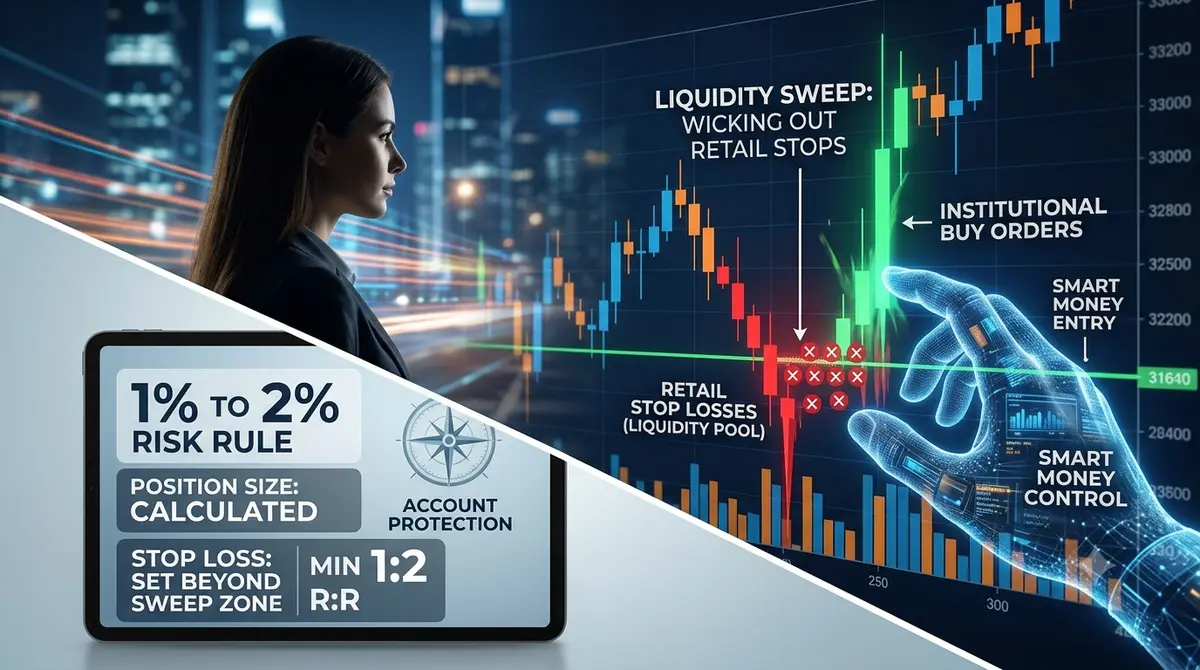
Liquidity Sweeps & Risk Management: How Smart Money Manipulates the Charts

Liquidity Sweeps & Risk Management: How Smart Money Manipulates the Charts

Liquidity Sweeps & Risk Management: How Smart Money Manipulates the Charts

If you have ever set a tight stop loss right under a support level, watched price dip just far enough to blow you out, and then immediately skyrocket toward your profit target... congratulations. You have been swept.

Most retail traders treat stop runs like bad luck or unfair market manipulation. In reality, liquidity sweeps are just how big money operates. Once you realize that institutions need your stop loss to fill their own orders, you can stop falling for the trap—and start using it to your advantage.

What Is a Liquidity Sweep?

Markets do not move because an RSI line crosses 30 or a moving average turns green. Price moves toward liquidity. Liquidity is simply a massive cluster of orders resting at predictable levels on a chart.

Retail trading courses teach millions of people to put their stops in the exact same spots:

  • Sell Stops: Placed right below obvious equal lows, double bottoms, or major support lines.

  • Buy Stops: Placed right above obvious equal highs, double tops, or major resistance lines.

If a hedge fund wants to buy $500 million worth of a currency, stock, or crypto asset, they cannot just click "market buy." Doing that would cause massive slippage and ruin their entry price. To buy a massive position, they need an equal amount of sellers.

Where are all the sellers? Sitting right below support levels as retail stop losses.

A liquidity sweep happens when price aggressively pushes through a key high or low to slam into those stop losses. Once the institutional orders get filled against retail stops, price violently snaps back in the opposite direction.

Spotting Sweeps vs. Real Breakouts

The secret to trading sweeps comes down to watching candle behavior at key structural levels. You...

Continue reading...
0
0
GFATHER

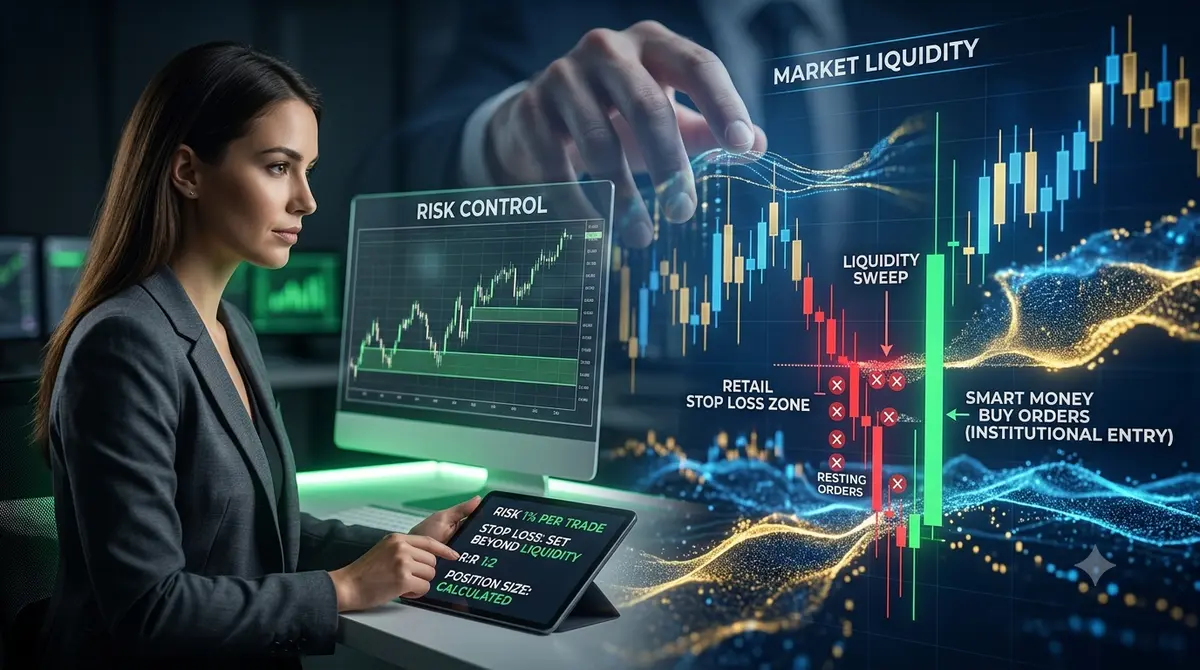
Mastering Risk Management & Liquidity Sweeps: How Smart Money Controls the Market

Mastering Risk Management & Liquidity Sweeps: How Smart Money Controls the Market

Mastering Risk Management & Liquidity Sweeps: How Smart Money Controls the Market

Ask any seasoned trader what separates consistent professionals from the 90% who lose money, and you will rarely hear about a secret indicator or a perfect entry pattern. The real differentiator comes down to two foundational pillars: understanding institutional liquidity sweeps and executing disciplined risk management.

If you have ever placed a trade, set a tight stop loss right beyond a technical swing high or low, and watched in frustration as price surged just far enough to kick you out before immediately reversing in your predicted direction, you have experienced a liquidity sweep.

Understanding how market makers use retail stop losses to fill their own orders—and structuring your risk parameters around this reality—is the single most important step in protecting your capital and trading with longevity.

The Anatomy of a Liquidity Sweep

To navigate the market effectively, you must understand that price does not move simply because an indicator flashes a signal. Price moves toward areas of high liquidity. Liquidity is simply pool money—a collection of buy and sell orders resting at predictable chart levels.

Retail trading textbooks teach millions of people to place stop-loss orders in the exact same locations:

  • Buy Stop Losses: Placed just above obvious resistance levels, previous day highs, or equal highs.

  • Sell Stop Losses: Placed just below obvious support levels, previous day lows, or equal lows.

Institutional market participants—such as hedge funds, algorithmic trading desks, and bank market makers—operate with orders so large that they cannot enter positions without moving the price against themselves. To fill a massive buy order, an institution needs a massive cluster of sell orders. Where are those sell orders resting? Right below key support levels as retail stop losses.

A liquidity sweep (often called a stop hunt...

Continue reading...
0
0

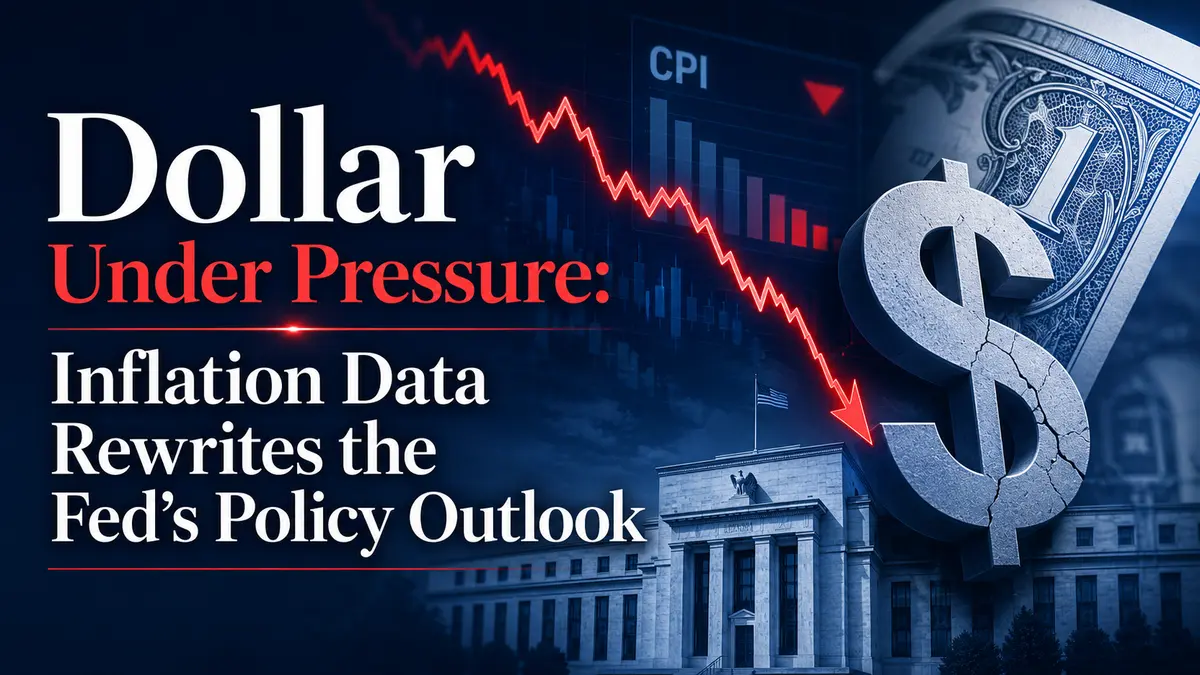
Dollar Under Pressure: Inflation Data Rewrites the Fed’s Policy Outlook

Dollar Under Pressure: Inflation Data Rewrites the Fed’s Policy Outlook

Introduction: The First Decline in Prices in Six Years

Tuesday became a day that could go down in the history of the US economy. Consumer prices in the United States declined in June for the first time in six years. The core inflation measure remained almost unchanged, easing pressure on the Federal Reserve to raise interest rates. The Consumer Price Index fell by 0.4% month over month, while analysts had expected a decline of only 0.1%. Annual inflation stood at 3.5%, compared with the forecast of 3.8%.

The dollar reacted immediately. The US Dollar Index ( USD ... ) fell by 0.52% to 100.76, reaching an intraday low of 100.60. Markets began revising their interest-rate expectations and pricing in a more accommodative Federal Reserve policy.

Against this backdrop, however, Federal Reserve Chair Kevin Warsh delivered a hawkish statement, saying that the central bank’s committee was “intolerant” of persistently high inflation and remained determined to curb price growth, which had been elevated for five years.

This contradiction between the economic data and the Fed’s rhetoric creates considerable uncertainty. In this article, we will examine every aspect of the inflation report, its impact on the dollar, and the outlook for monetary policy.

Inflation Data: Figures That Surprised the Market

CPI Declines by 0.4%

The Consumer Price Index declined by 0.4% month over month in June, while analysts had expected a fall of only 0.1%. This was the first decrease in six years, making the report a historic event.

The decline in prices was driven by several factors, including lower energy prices, reduced transportation service costs, and a degree of easing in price pressures across other categories.

Annual Inflation Falls Below Forecasts

On an annual basis, inflation stood at 3.5%, compared with the forecast of 3.8% and the previous reading of 4.2%. This represents...

Continue reading...
0
0
Navigation menu
instaforex banner