Gold Climbs Back Above $4,000 as Geopolitical and Inflation Risks Push Prices Higher

Monday: The Precious Metal Returns to the Spotlight
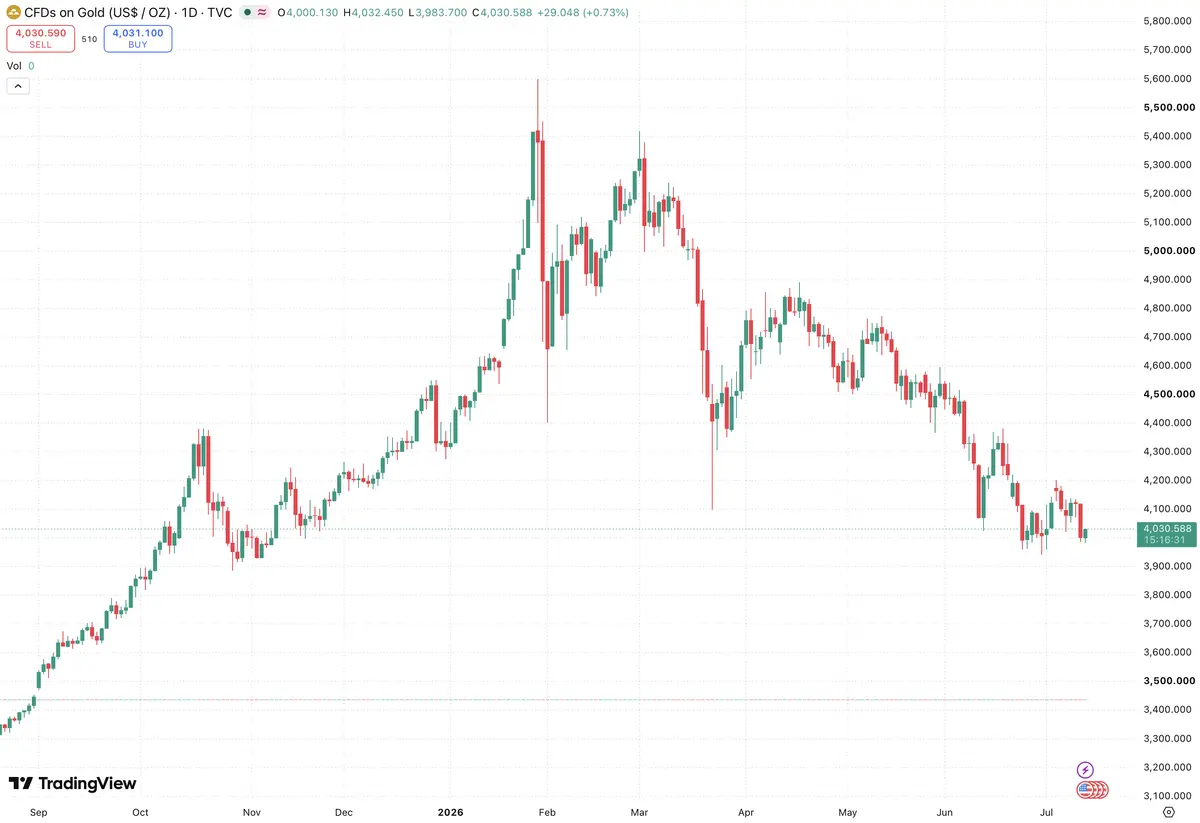
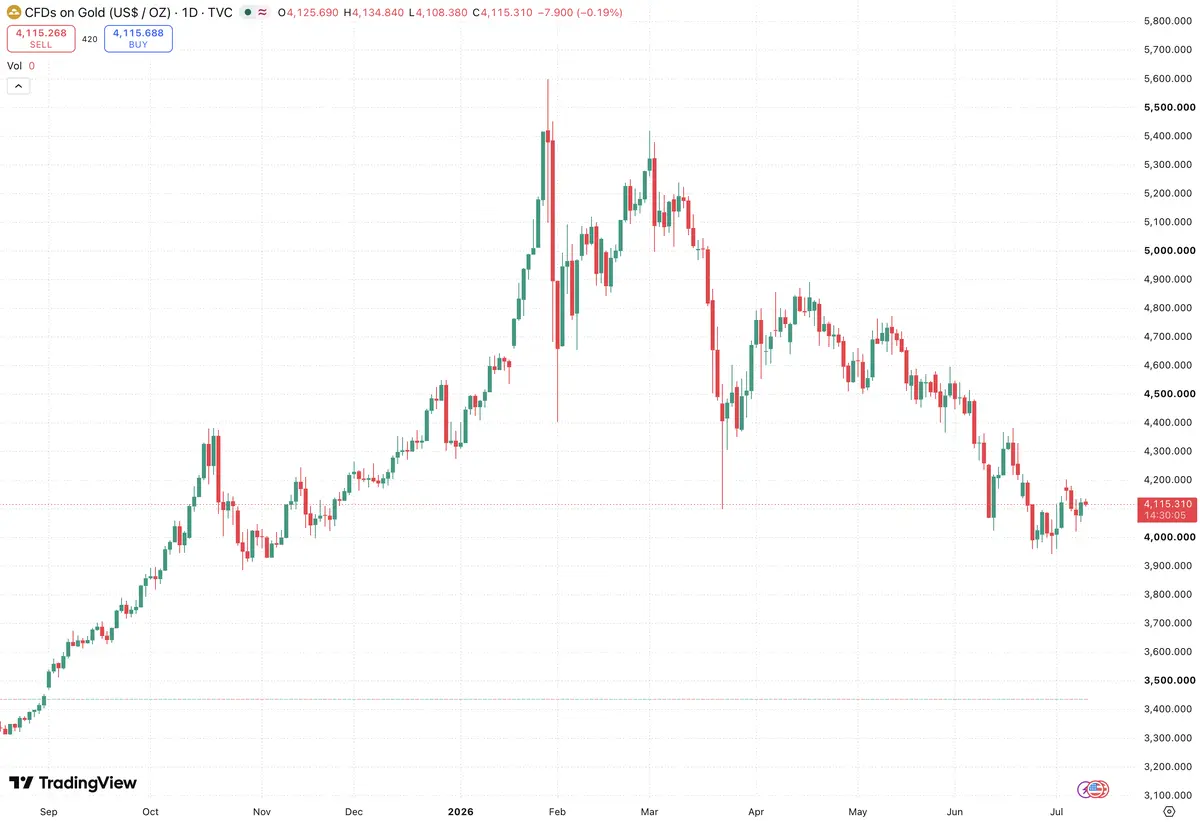
XAUUSD ... Gold began the new trading week with solid gains. Prices of the precious metal climbed back above the psychologically important level of $4,000 per ounce, rising by 0.4% to $4,024.72. Gold futures performed even more strongly, gaining 0.5% to reach $4,029.87.
The recovery came after gold closed 0.2% lower on the previous Friday. The market has once again shifted its attention to geopolitical risks, which remain the main driving force behind demand for safe-haven assets. The conflict in the Middle East continues to escalate, prompting investors to seek protection in gold.
Silver also advanced, with XAGUSD ... rising by 0.9% to $56.93 per ounce. Platinum, however, declined by 0.2% to $1,594.30. This mixed performance suggests that investors are choosing gold as the most reliable safe-haven asset amid geopolitical uncertainty.
The Middle East: Escalation and Signs of Diplomacy
The situation in the Middle East remains tense. The United States continues to carry out strikes on Iranian targets, while President Donald Trump warned Tehran that it would “pay” for the deaths of three American service members in recent days. This tough statement leaves little doubt that Washington has no intention of backing down.
Regional uncertainty has been intensified by a threat from Yemen’s Iran-backed Houthi movement to impose a naval blockade on Saudi Arabia. This poses a serious risk to shipping in the Red Sea, one of the world’s key routes for energy supplies. In response, the Saudi-led military coalition has strengthened measures to protect maritime traffic.
However, there are also signs of hope for a diplomatic resolution. Iran said that mediators were discussing proposals aimed at de-escalating the conflict. Reuters reported on a proposed 10-day suspension of strikes, easing concerns about an immediate escalation. Markets breathed a sigh of relief, although only cautiously....