
Bar Pipa
We pay for a post of 10$
Amundi Core Nasdaq-100 Swap UCITS ETF Acc

Amundi Core Nasdaq-100 Swap UCITS ETF Acc

NASD.L LSE

$117.54
-0.91%

Key Statistics

Market Cap
$8.30 B
Volume
5,235
Open
$117.70
Day Range
117.24 - 117.72
52W Range
88.50 - 125.48
Price AVG 50
$120.46

About Amundi Core Nasdaq-100 Swap UCITS ETF Acc

The Amundi Core Nasdaq-100 Swap UCITS ETF aims to faithfully track the performance of the NASDAQ-100 Notional Net Total Return Index (the Index), striving for maximum accuracy irrespective of market fluctuations. A primary goal is also to keep the discrepancy between the Sub-Fund's net asset value and the Index's returns to a minimum. The expected level of this tracking difference, under standard market circumstances, is detailed within the Sub-Fund's prospectus. For comprehensive information, kindly refer to the fund prospectus or the Key Information Document (KID).

Asset Type: Common Stock
Sector: Financial Services
Industry: Asset Management - Global

Discussion

Authentication Required

You must be logged in to post a comment.

GFATHER

Session Liquidity & Killzones: Timing the Algorithmic Order Flow

Session Liquidity & Killzones: Timing the Algorithmic Order Flow

In financial markets, when you trade is just as critical as what you trade. You can identify a textbook Fair Value Gap or a pristine Order Block, but if you execute during a low-volume consolidation phase, price will likely drag sideways, chop you out, or fail to expand toward your target.

Institutional algorithms do not operate uniformly across 24 hours. Instead, they release massive liquidity injections during specific, highly predictable time windows known as Killzones.

Understanding the interplay between global trading sessions and session liquidity allows you to align your executions directly with the daily institutional cycle.

The Global Session Breakdown

The 24-hour trading day is split into three primary geographic sessions. Each session serves a distinct structural purpose within the Interbank Price Delivery Algorithm (IPDA):

1. The Asian Session (Accumulation Phase)

  • Role: Range Bound / Liquidity Generation

  • Characteristics: Asian trading volume is significantly lower compared to London or New York. The market typically forms a tight horizontal range, building up Asian Highs (Buy-Side Liquidity) and Asian Lows (Sell-Side Liquidity).

  • Trader Objective: Do not trade the Asian range breakout. Treat the Asian Session High and Low as prime targets to be swept later in the day.

2. The London Session (Manipulation Phase)

  • Role: The Judas Swing / True Low or High of the Day

  • Characteristics: London opens with a surge of volatility. Algorithms frequently engineer a false breakout—driving price past the Asian High or Low to hunt stop losses and tap into a higher-timeframe Point of Interest (POI).

  • Trader Objective: Look for liquidity sweeps of the Asian range during the London Killzone to catch the real reversal expansion.

3. The New York Session (Expansion & Distribution Phase)

  • Role: Macro Acceleration or Reversal

  • Characteristics: New York brings maximum liquidity as...

Continue reading...
0
0
GFATHER

Decoding Order Blocks & Supply/Demand Zones: Trading High-Probability Turnarounds

Decoding Order Blocks & Supply/Demand Zones: Trading High-Probability Turnarounds

Decoding Order Blocks & Supply/Demand Zones: Trading High-Probability Turnarounds

If market structure gives you the map and liquidity sweeps show you where the traps are laid, Order Blocks and Supply/Demand zones give you exact precision for entries.

Most retail traders struggle with timing. They either buy after a massive rally has already stretched too far or try to catch a falling knife right in the middle of nowhere. Finding institutional order blocks gives you the patience to wait for price to return to high-interest footprints, letting you enter with tight stop losses and massive risk-to-reward potential.

What Is an Order Block?

An Order Block (OB) is a specific price zone on a chart where major market participants—such as central banks, hedge funds, and institutional desks—placed heavy buy or sell orders.

Because institutional orders are far too massive to fill all at once without breaking market stability, these players leave behind unfilled orders (resting liquidity). When price eventually returns to these exact levels later on, those remaining orders trigger, causing price to violently launch away or ignite a brand-new trend expansion.

Spotting a real order block requires looking for two simple criteria:

  • Bullish Order Block: Look for the last down-close candle right before a powerful, aggressive move up that successfully breaks market structure (BOS) or changes character (CHOCH).

  • Bearish Order Block: Look for the last up-close candle right before a sharp, downward collapse that breaks structure to the downside.

If a candle didn't cause an aggressive move that broke structure and left imbalance behind, ignore it. It isn't a valid order block.

Supply and Demand vs. Basic Support and Resistance

Retail textbooks love drawing simple horizontal lines across random wicks and calling them support or resistance. The problem? Those lines ignore institutional volume.

Supply and Demand zones mark entire price ranges...

Continue reading...
0
0
GFATHER

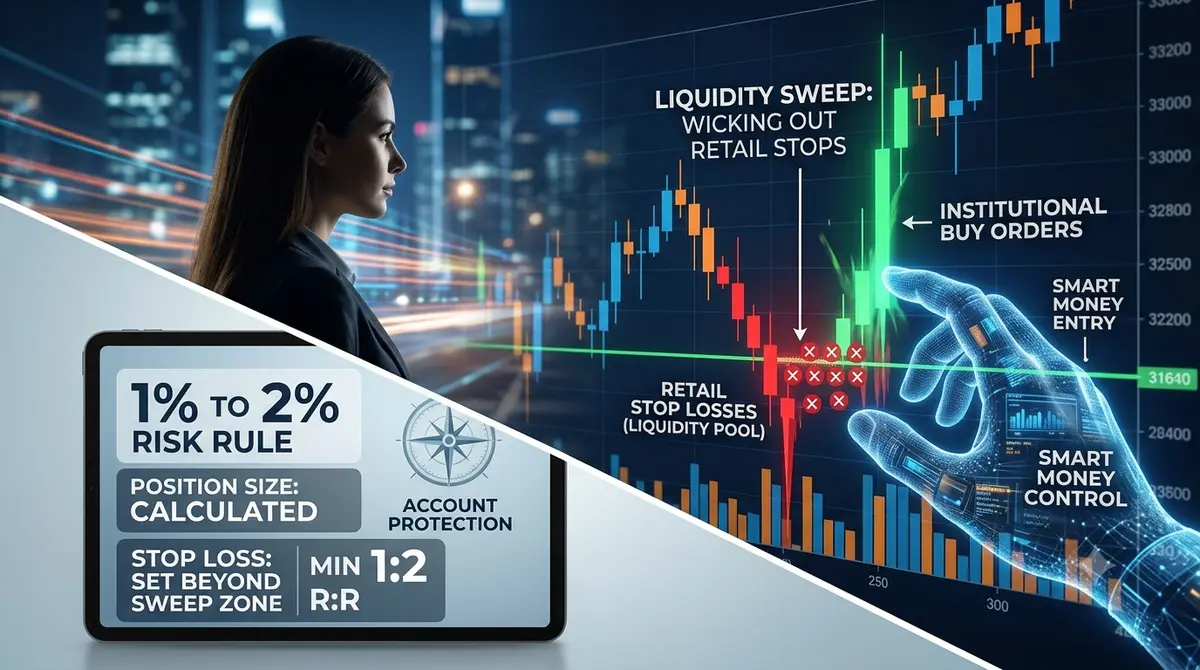
Liquidity Sweeps & Risk Management: How Smart Money Manipulates the Charts

Liquidity Sweeps & Risk Management: How Smart Money Manipulates the Charts

Liquidity Sweeps & Risk Management: How Smart Money Manipulates the Charts

If you have ever set a tight stop loss right under a support level, watched price dip just far enough to blow you out, and then immediately skyrocket toward your profit target... congratulations. You have been swept.

Most retail traders treat stop runs like bad luck or unfair market manipulation. In reality, liquidity sweeps are just how big money operates. Once you realize that institutions need your stop loss to fill their own orders, you can stop falling for the trap—and start using it to your advantage.

What Is a Liquidity Sweep?

Markets do not move because an RSI line crosses 30 or a moving average turns green. Price moves toward liquidity. Liquidity is simply a massive cluster of orders resting at predictable levels on a chart.

Retail trading courses teach millions of people to put their stops in the exact same spots:

  • Sell Stops: Placed right below obvious equal lows, double bottoms, or major support lines.

  • Buy Stops: Placed right above obvious equal highs, double tops, or major resistance lines.

If a hedge fund wants to buy $500 million worth of a currency, stock, or crypto asset, they cannot just click "market buy." Doing that would cause massive slippage and ruin their entry price. To buy a massive position, they need an equal amount of sellers.

Where are all the sellers? Sitting right below support levels as retail stop losses.

A liquidity sweep happens when price aggressively pushes through a key high or low to slam into those stop losses. Once the institutional orders get filled against retail stops, price violently snaps back in the opposite direction.

Spotting Sweeps vs. Real Breakouts

The secret to trading sweeps comes down to watching candle behavior at key structural levels. You...

Continue reading...
0
0
Navigation menu
instaforex banner