

Understanding Advanced Moving Averages: TMA, WMA, and Welles Wilder Smoothing
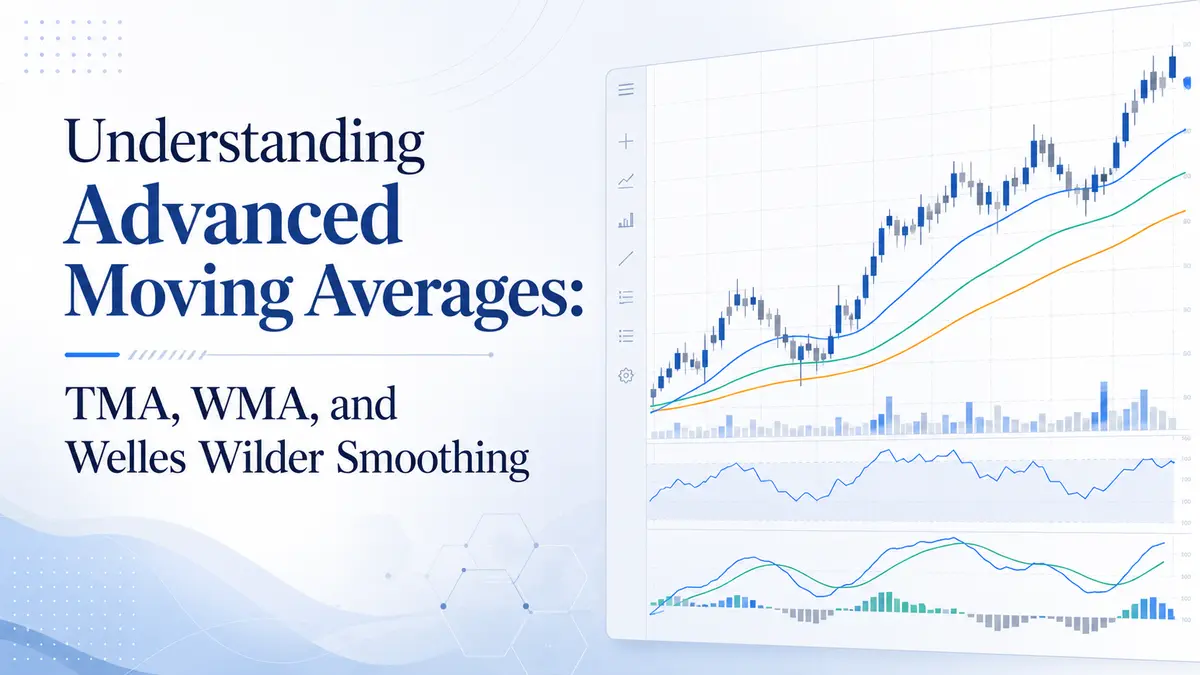
Moving averages are the bedrock of technical analysis. They help traders cut through market volatility to identify the underlying trend. While the Simple Moving Average (SMA) is the most well-known, advanced variations like the Triangular Moving Average (TMA), Weighted Moving Average (WMA), and Welles Wilder Smoothing offer unique approaches to analyzing price data.
Triangular Moving Average (TMA)
What is the Triangular Moving Average?
The Triangular Moving Average (TMA) is a trend-following technical indicator. It is fundamentally a lagging indicator, meaning it responds to price changes after they have occurred rather than predicting them.
The core calculation of the TMA is similar to a Simple Moving Average, but it introduces an extra layer of smoothing. Essentially, the TMA is a “smoothed average of a smoothed average” (often calculated as an SMA of an SMA). This double-smoothing process gives the indicator a wavy, ultra-smooth appearance on your chart. It is exceptionally efficient at filtering out market “noise” and random price spikes, though the tradeoff is that it introduces more lag than standard moving averages.
How to Add the TMA to Your Chart
To integrate this indicator into your trading workspace, follow these steps on your platform’s main interface:
-
Locate the Indicators icon (typically represented as a chart or mathematical symbol) on the top toolbar.
-
Hover your mouse over the icon to open the dropdown menu.
-
Move your cursor to the Trend sub-category.
-
Select Triangular Moving Average from the list to apply it to your active chart.
Practical Example: Trading with the TMA
Because the TMA is heavily smoothed, it is best used in strongly trending markets to establish the baseline direction rather than catching sudden breakouts.
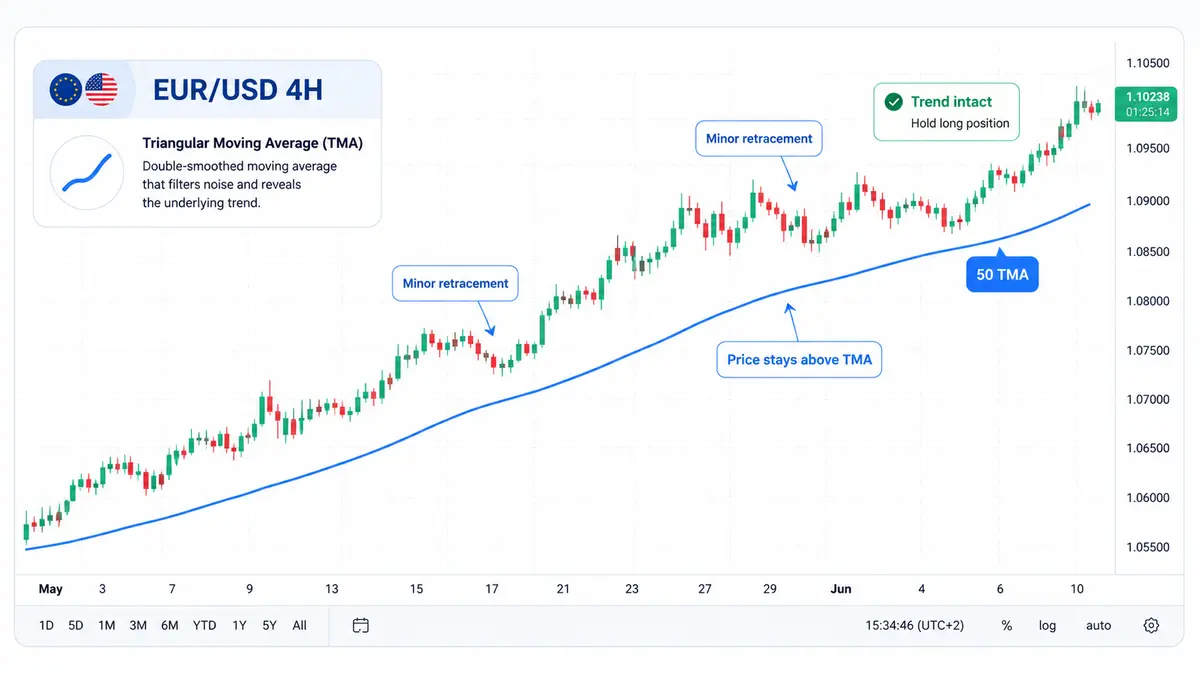
Scenario: You are analyzing the EUR/USD currency pair on a 4-hour chart during a prolonged macroeconomic shift. You apply a 50-period TMA.
Due to its double-smoothed nature, minor daily price fluctuations and news whipsaws do not cause the TMA line to bend. As long as the price candles remain consistently above the rising TMA line, you hold your long position with confidence, knowing the core trend is intact. You ignore minor retracements that would otherwise trigger a false exit signal on a more sensitive indicator.
Weighted Moving Average (WMA)
What is the Weighted Moving Average?
The Weighted Moving Average (WMA) serves a very different purpose than the TMA. While the TMA seeks to maximize smoothing, the WMA seeks to maximize responsiveness.
Like the SMA, the WMA tracks the average price over a specific timeframe, but it introduces a weighting system. It assigns greater significance — or “weight” — to the most recent data points. Each day in the selected period is given a specific multiplier; the newest candlestick gets the highest multiplier, and the values drop sequentially for older data points.
Just like an SMA, when a new price bar forms, the oldest data point is dropped from the calculation. However, because the latest price action carries the heaviest mathematical weight, the WMA reacts significantly faster to sudden market reversals and breakouts than other moving averages.
How to Add the WMA to Your Chart
Setting up the WMA on your platform involves a familiar navigation path:
-
Find the Indicators icon on the top tool navigation bar.
-
Hover over it to reveal the operational menu.
-
Navigate through the menu options to the Trend section.
-
Click on Weighted Moving Average to launch the indicator on your asset chart.
Practical Example: Trading with the WMA
The WMA’s rapid responsiveness makes it an excellent tool for short-term swing traders and momentum investors who need to react quickly to shifting market dynamics.
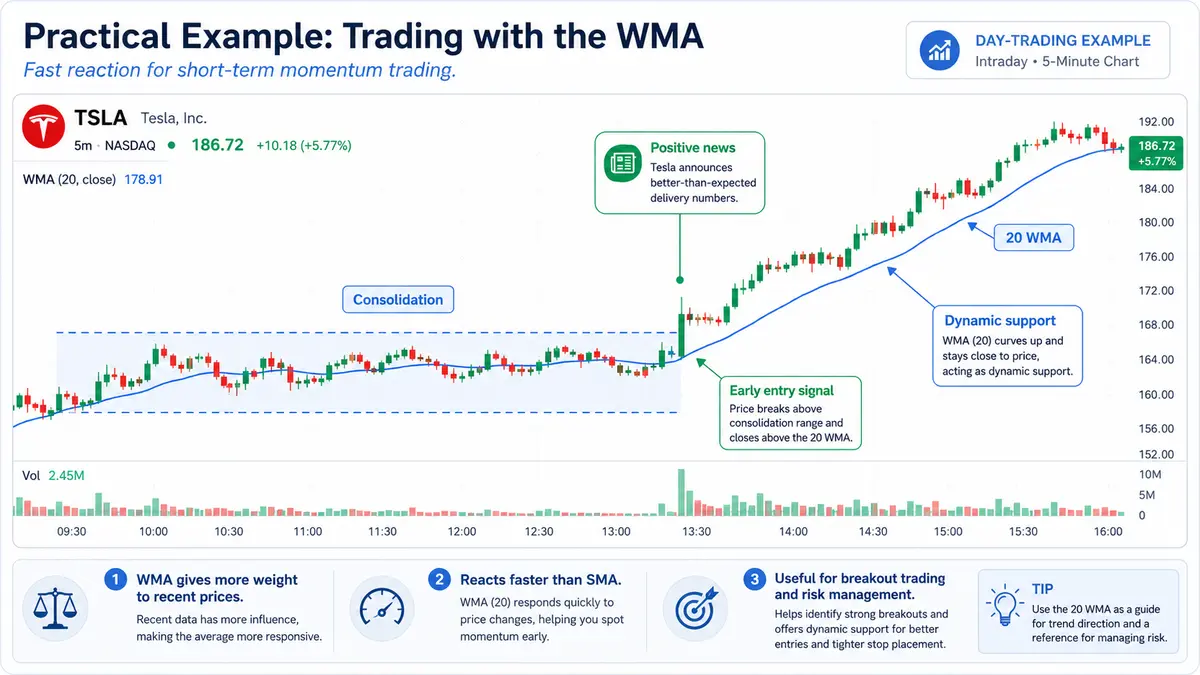
Scenario: You are day trading shares of Tesla (TSLA). The stock has been consolidating, but sudden positive news breaks, causing the price to spike.
If you were using a standard SMA, the indicator line would react slowly because it treats past data from hours ago with equal importance. However, your 20-period WMA immediately hooks upward, trailing right beneath the aggressive breakout candles. This fast reaction gives you an early entry signal to buy the breakout and provides a tight, dynamic support line to manage your risk.
Welles Wilder Smoothing (WWS)
What is Welles Wilder Smoothing?
Welles Wilder Smoothing (WWS) is a classic technical analysis indicator developed by the legendary mechanical engineer and trader J. Welles Wilder Jr. This smoothing technique is a fundamental component built into some of the most famous indicators in trading history, including the Relative Strength Index (RSI), Average True Range (ATR), and the Average Directional Index (ADX).
The mathematical formula behind Welles Wilder Smoothing is closely related to the Exponential Moving Average (EMA). The indicator processes two main parameters: a specific time series (usually closing prices) and a lookback period. It then projects a highly reliable, mathematically balanced smoothed line.
Note that in various trading platforms and financial literature, Welles Wilder Smoothing is occasionally referred to as the Modified Moving Average (MMA) or Smoothed Moving Average (SMMA).
Interpreting the Trend with WWS
When WWS is calculated directly across a price series, it acts as a structural trend barrier. The general rules of interpretation are straightforward:
-
An asset is considered to be in an uptrend if its closing market prices consistently remain above the Welles Wilder Smoothing line.
-
An asset is considered to be in a downtrend if its closing market prices consistently drop below the Welles Wilder Smoothing line.
How to Add Welles Wilder Smoothing to Your Chart
To apply Wilder’s proprietary smoothing technique to your asset charts:
-
Locate the Indicators symbol on your top analytical panel.
-
Hover your mouse over the icon to prompt the primary dropdown selection.
-
Hover over the Trend category to view available trend-following tools.
-
Select Welles Wilder Smoothing to plot the line directly over your price action.
Practical Example: Trading with Welles Wilder Smoothing
WWS is highly valued by position traders who want to ride macro market cycles without getting scared out of their positions by short-term volatility.
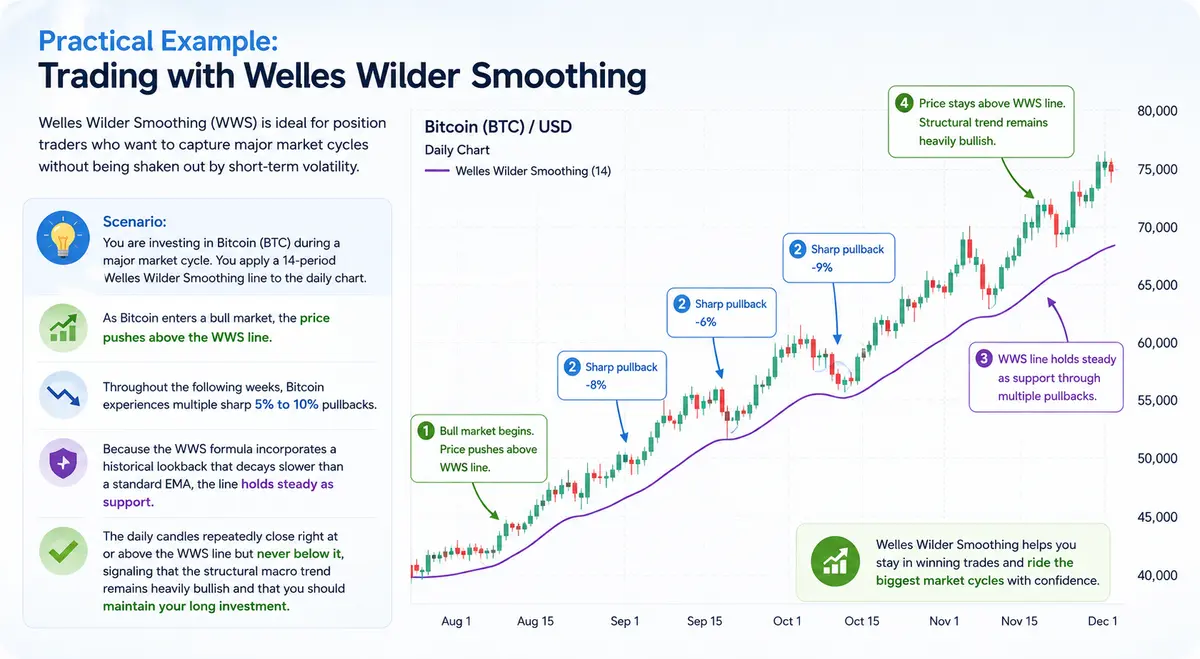
Scenario: You are investing in Bitcoin (BTC) during a major market cycle. You apply a 14-period Welles Wilder Smoothing line to the daily chart.
As Bitcoin enters a bull market, the price pushes above the WWS line. Throughout the following weeks, Bitcoin experiences multiple sharp 5% to 10% pullbacks. However, because the WWS formula incorporates a historical lookback that decays slower than a standard EMA, the line holds steady as support. The daily candles repeatedly close right at or above the WWS line but never below it, signaling that the structural macro trend remains heavily bullish and that you should maintain your long investment.

Comments
No comments yet. Be the first to share your thoughts!
Authentication Required
You must be logged in to post a comment.