

The Exponential Moving Average (EMA) and The Hull Moving Average (HMA)
The Exponential Moving Average (EMA): A Dynamic Trend Indicator
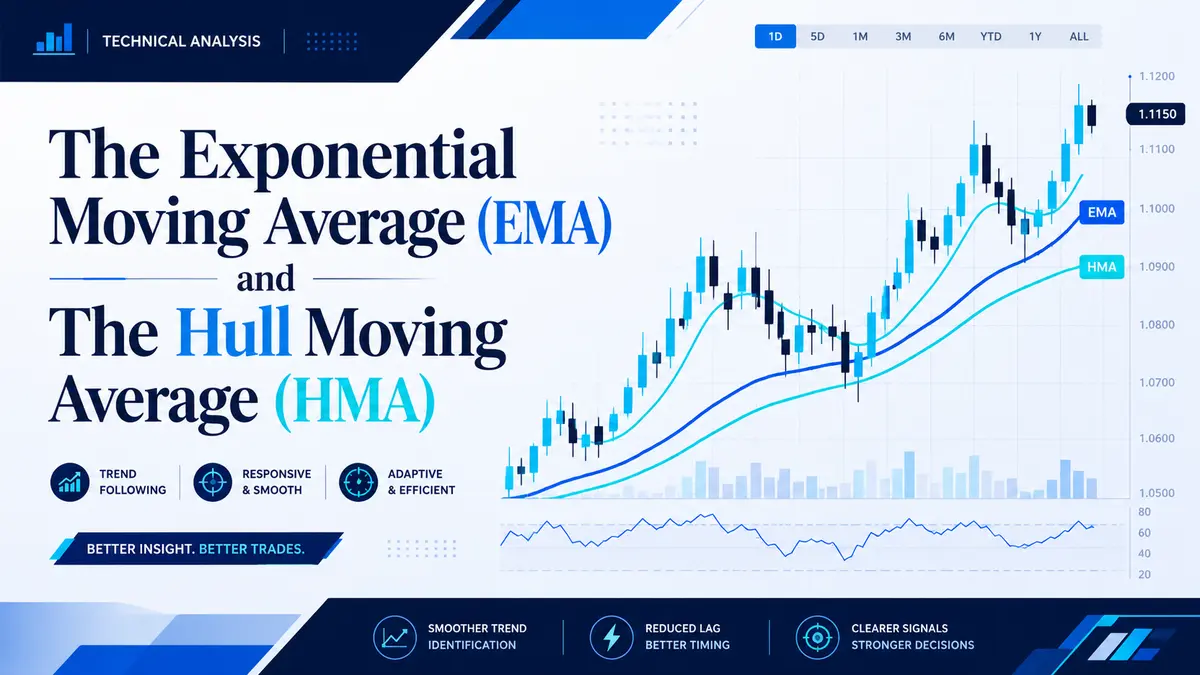
The Exponential Moving Average (EMA) is a foundational and critically important trading indicator designed to identify the presence and direction of market trends.
Like all moving averages, its primary function is to smooth out chaotic, short-term price fluctuations — often referred to as market “noise”—allowing the trader to clearly see the underlying macroeconomic trajectory of an asset.
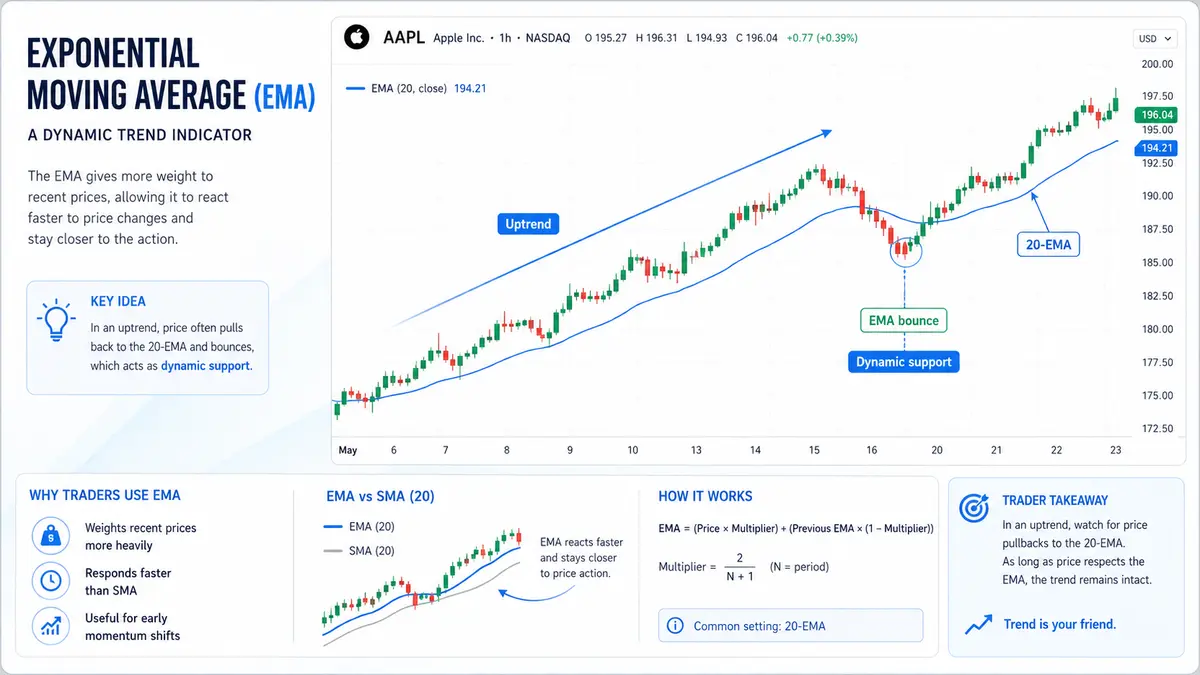
However, the EMA differs significantly from the Simple Moving Average (SMA). While an SMA treats all historical data equally, the EMA assigns a mathematically heavier weight to the most recent price data. This weighting decreases exponentially as the data points become older. In simple terms, the EMA formula calculates its current value by adding a specific percentage of the current closing price to a portion of the previous moving average value.
Why the EMA Matters
Because it prioritizes new data, the EMA solves one of the biggest problems traders face: lag. It reacts much faster to sudden price changes, breakouts, and news events than a traditional SMA. This makes it an indispensable tool for day traders, swing traders, and anyone looking to capture early momentum shifts in fast-moving markets.
Trading Example: Riding the Trend with the 20-EMA Imagine you are trading Apple (AAPL) stock on a 1-hour chart, and the market is in a strong uptrend.
Because the EMA hugs the price closely, the 20-period EMA will often act as a dynamic level of support. When AAPL spikes to $180 and then briefly pulls back to $175 (touching the 20-EMA line), buyers will often step in exactly at this moving average to push the price higher. A trader can use this “EMA bounce” as a low-risk entry point to join the established uptrend, placing a tight stop-loss just below the EMA line.
Setting Up the EMA on Your Platform
Deploying the EMA on most trading platforms is a quick and straightforward process:
-
Locate the Indicators icon on your platform’s top toolbar.
-
Hover your mouse over the icon to open the dropdown menu.
-
Navigate to the Trend category.
-
Select Exponential Moving Average from the list, and input your desired period (e.g., 9, 20, or 50) in the settings window.
The Hull Moving Average (HMA): Eliminating Lag and Identifying Reversals
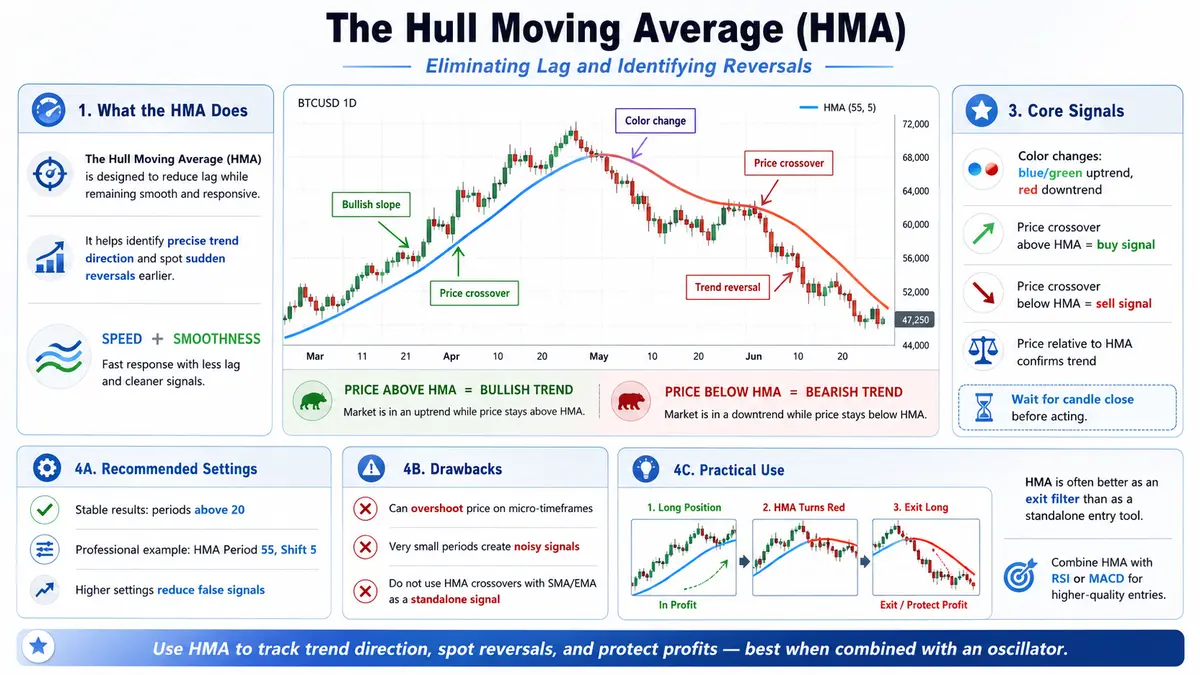
The Hull Moving Average (HMA), created by Alan Hull, is a highly advanced indicator utilized to determine precise trend directions and identify sudden market reversals. The primary goal of this tool is to solve the ultimate moving average dilemma: making a line that is incredibly responsive to current price action (zero lag) while simultaneously remaining completely smooth.
The Mechanics and Signals of the HMA
Unlike standard moving averages, the HMA provides visual cues through color coding and slope angles, making it incredibly intuitive to read.
-
Color Changes: The most immediate signal the HMA provides is a shift in its color. If the asset’s price is rising and the trend is bullish, the HMA line will slope upward and typically paint itself blue (or green). If the price action turns bearish and starts falling, the line will slope downward and repaint itself red.
-
Price Crossovers: A traditional buy signal is generated when the price chart violently breaks through the HMA line from the bottom up. Conversely, a sell signal occurs when the price breaks the HMA line from the top down.
-
Trend Confirmation: The absolute position of the price relative to the line is the ultimate trend filter. If the current candlesticks are forming below the HMA line, it confirms a distinct downward trend. If the price is hovering above the line, the market is actively growing.
Important Note: Because the color of the HMA can flicker and change on the currently open, active candlestick, traders should not react blindly to the color alone. It is far more important to analyze the closing position of the price relative to the HMA line.
Ideal Settings for Maximum Stability
The Hull Moving Average performs exceptionally well on small to medium timeframes, but the most stable and reliable results are generally achieved using periods greater than 20.
For medium-term trading and to strictly minimize the risk of false signals (whipsaws), it is highly recommended to increase both the period and the shift parameters. A popular professional configuration is an HMA Period of 55 and an HMA Shift of 5. By applying these heavier settings, the trend reversal points will appear much less frequently, saving you from entering premature trades during minor market corrections.
Drawbacks and Limitations of the HMA
Despite its brilliant design, the HMA is not without its flaws. Because its underlying mathematical formula is designed to aggressively accelerate the line to catch up with the current price, the HMA’s reading of the “average price” is often severely exaggerated.
-
Danger on Micro-Timeframes: This exaggeration makes the indicator quite dangerous if used with very small periods on noisy charts (like a 1-minute chart), as it will overshoot the price wildly.
-
Crossover Incompatibility: You cannot use the intersection of the HMA line with other traditional moving averages (like an SMA or EMA) as a valid trading signal. Because the HMA calculates data so differently, a crossover with a standard moving average will produce false and illogical signals.
Trading Example: Using the HMA as an Exit Filter The HMA is incredibly efficient at tracking the macro trend, making it vastly superior as an exit signal rather than an entry signal. Imagine you are already holding a long position in a cryptocurrency like Bitcoin, and the price is soaring. You are in profit, and the HMA line below the price is solid blue. Suddenly, Bitcoin stalls, and the HMA line turns red and angles downward. Instead of aggressively shorting the market right away, you simply use this HMA color change as a definitive signal to close your long position and lock in your profits.
To build a robust entry strategy, the HMA must be combined with an oscillator (like the RSI or MACD) to confirm overbought or oversold conditions before entering a new trade.
Setting Up the HMA on Your Platform
To apply the Hull Moving Average to your chart, follow these standard steps (Note: Ensure you select the correct indicator, as some platform menus may occasionally mislabel custom trend tools):
-
Locate the Indicators icon on the top toolbar of your trading terminal.
-
Hover your mouse over the icon to reveal the dropdown menu.
-
Navigate to the Trend section.
-
Select Hull Moving Average (or HMA) from the list and configure your desired period and shift settings.

Comments
No comments yet. Be the first to share your thoughts!
Authentication Required
You must be logged in to post a comment.