

The Sideways Trend (Flat Market)
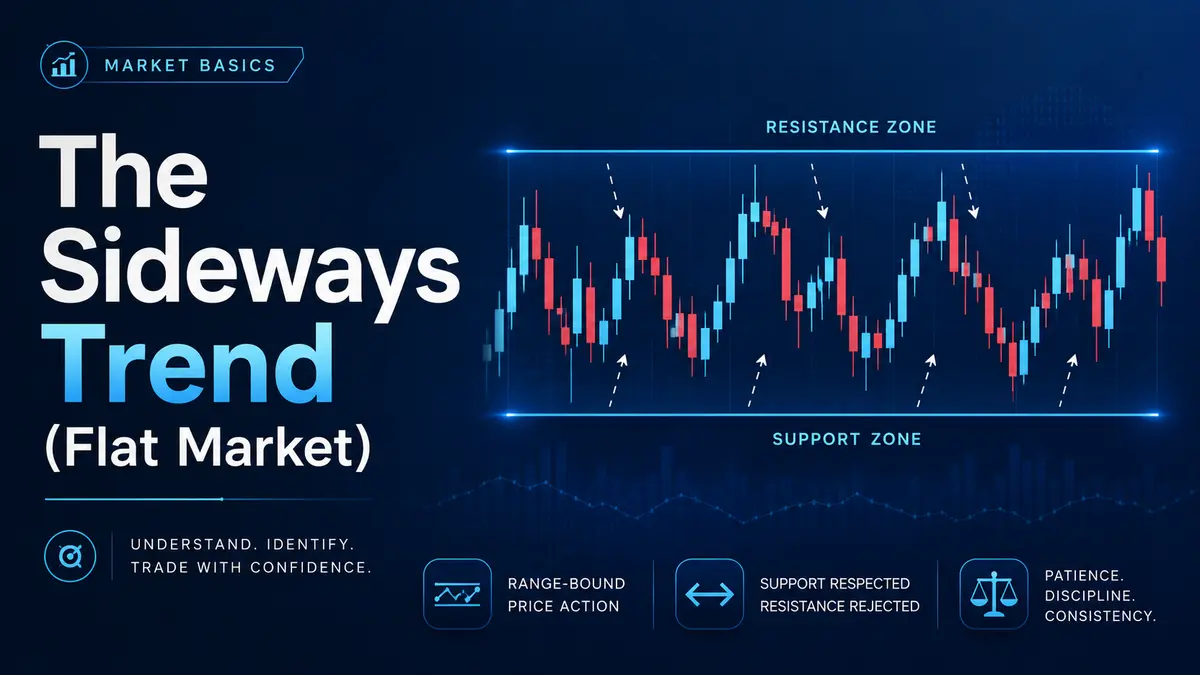
If you observe a chart where both the price highs and the price lows are repeatedly pausing at approximately the same horizontal levels, the market is currently in a sideways trend, often referred to in trading as a “flat,” a “ranging market,” or a “consolidation phase.”
Unlike uptrends or downtrends, where a clear imbalance between buyers and sellers drives the price in a specific direction, a sideways trend represents a state of temporary market equilibrium. Buyers and sellers are evenly matched. Often, this happens when the market is “digesting” a recent major price movement or waiting for a significant fundamental catalyst, like an upcoming earnings report or an interest rate decision, to determine its next major direction.
Charting the Horizontal Channel
A sideways trend is essentially the absence of a directional trend — prices are neither consistently growing nor systematically falling.
To visualize this phase, you apply the same foundational logic used in directional trends, but the geometry changes. You draw a perfectly horizontal Resistance Line connecting the upper price peaks (the ceiling), and a perfectly horizontal Support Line connecting the lower price troughs (the floor).
This creates a rectangular channel. The resulting picture is structurally similar to an ascending or descending channel, but with a critical difference: you no longer have a directional bias. There is no underlying momentum favoring either the bulls or the bears.
Trading Strategies in a Sideways Market
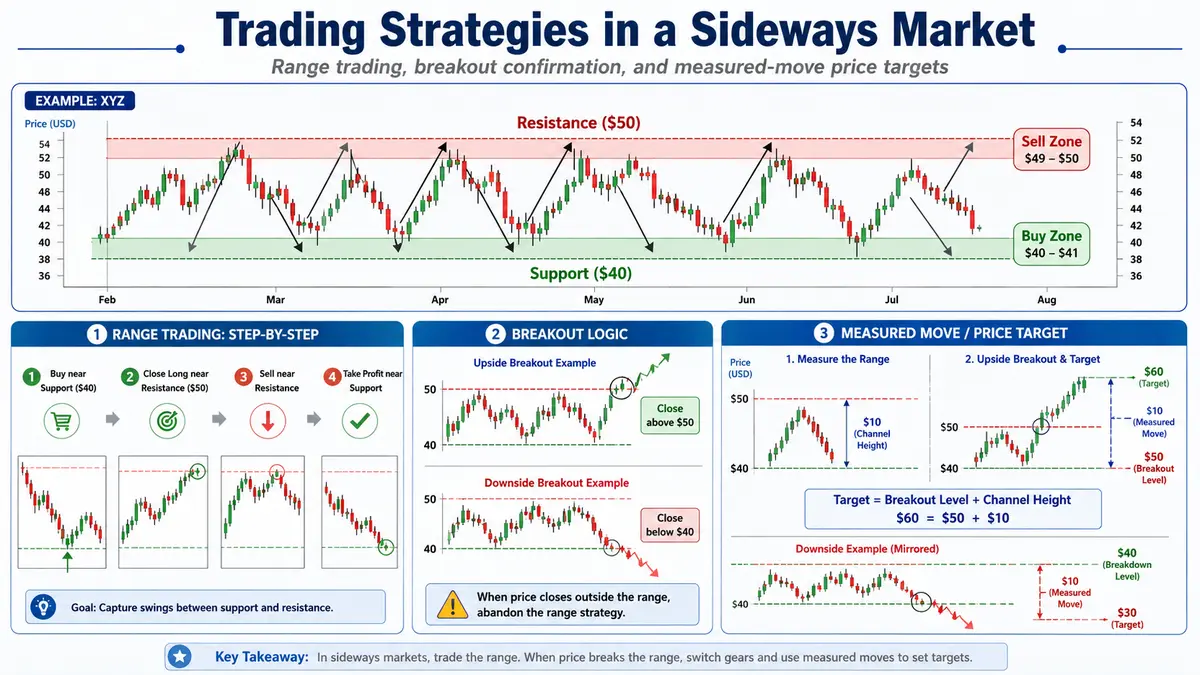
Because a flat market lacks a dominant direction, buying and selling become equally valid and symmetrical actions. The strategy here shifts from “trend following” to “range trading” or “ping-ponging” between the established boundaries.
Since the lowest available prices will consistently cluster near the bottom Support Line, this area becomes your optimal “buy zone.” Conversely, the highest premium prices will cluster near the upper Resistance Line, marking your optimal “sell zone.”
Step-by-Step Range Trading Example: Imagine a stock has been trading flat for a month. Every time it drops to $40, buyers step in (Support). Every time it rallies to $50, sellers take control (Resistance).
-
When the price dips to $40, you execute a Buy order.
-
As the price climbs back to the top of the channel, you hold the position.
-
Once the price hits $50, you Close your long position to secure the profit.
-
Simultaneously, because $50 is a proven ceiling, you can execute a Sell (Short) order right at that Resistance line, targeting a drop back down to the $40 Support line.
The Breakout: When the Flat Ends
No market stays flat forever. The tension between buyers and sellers will eventually snap. The definitive signal that a sideways trend has ended is a clear, decisive breakout — when the price pierces through and closes outside of either the Support or Resistance line.
These breakouts represent the birth of a new directional trend. You must constantly monitor the boundaries of your channel. The moment the price escapes the flat, the range-trading strategy must be immediately abandoned.
Calculating Price Targets (The Measured Move)
One of the most powerful aspects of a sideways trend is that it gives you a precise, mathematical way to forecast where the price will go after the breakout occurs. This technique is known as finding the Price Target or performing a “Measured Move.”
When a market consolidates in a flat, it builds up pressure. When that pressure is released via a breakout, the resulting price thrust is usually proportionate to the size of the consolidation channel.
How to calculate the target:
-
Measure the exact vertical distance (the height) between your horizontal Support Line and your Resistance Line.
-
If the price breaks downward through support, you project that exact distance downward from the breakout point to find your bearish price target.
-
If the price breaks upward through resistance, you project that exact distance upward from the breakout point to find your bullish price target.
Practical Target Example: Let’s return to our stock ranging between $40 (Support) and $50 (Resistance).
-
The height of the channel is $10 ($50 – $40).
-
Suddenly, positive news causes the price to break out upward, piercing the $50 resistance and closing at $51.
-
To find your target, you take the breakout level ($50) and add the channel height ($10).
-
Your highly probable price target for the new uptrend is $60. The market “owes” you a move equal to the size of the channel it just escaped.
Common Mistakes When Charting a Sideways Trend
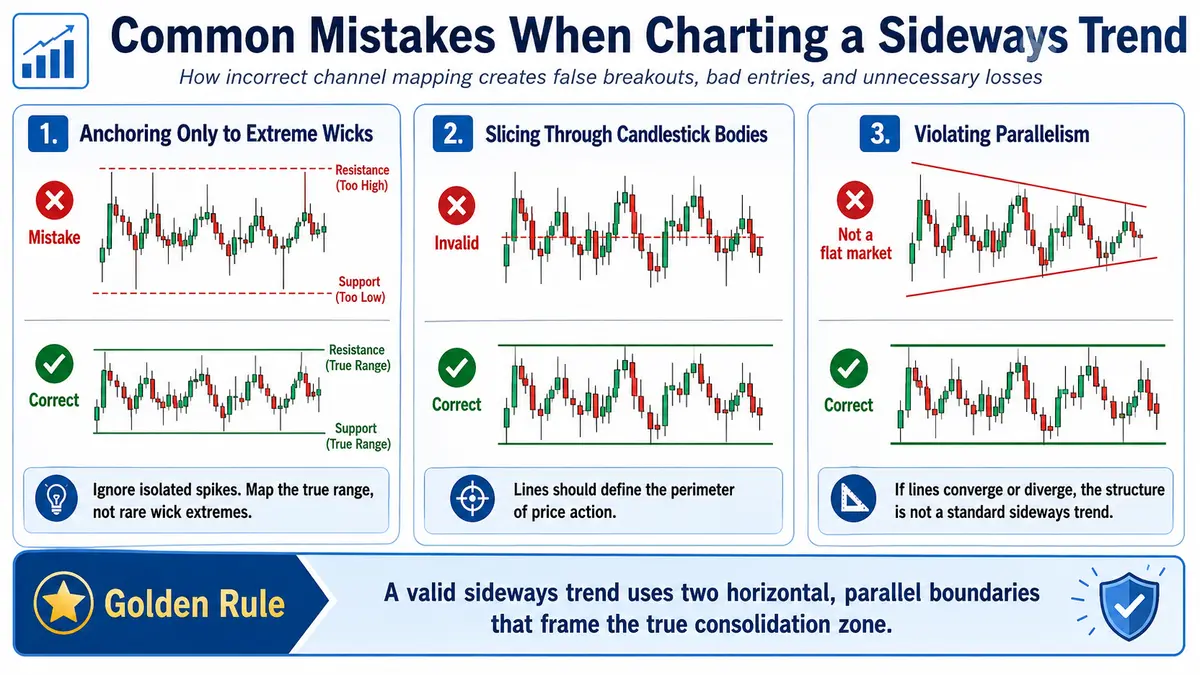
Just as with diagonal trendlines, drawing a horizontal channel incorrectly will lead to false breakouts, premature entries, and unnecessary losses. Here are the most frequent errors traders make when mapping a flat market:
1. Anchoring Exclusively to Extreme Wicks
A major mistake is drawing your horizontal lines based solely on the extreme, thin tips of candlestick shadows (wicks). During a sideways market, brief moments of low liquidity or sudden news can cause a price to spike momentarily before violently snapping back into the range. If you base your Resistance and Support lines on these isolated spikes, your channel will be drawn far too wide, and you will miss legitimate trading opportunities inside the true consolidation zone.
2. Slicing Through Candlestick Bodies
Conversely, some traders try to force a straight horizontal line by cutting directly through the dense real bodies of the candlesticks just to connect a few random peaks. Your lines must act as the outer borders of the price action. They should cleanly run along the outer edges of the candle bodies, acting as a true perimeter, rather than skewering the data.
3. Violating Parallelism
A sideways trend must be formed by perfectly horizontal, perfectly parallel lines. Often, traders will draw a slightly descending upper line and a slightly ascending lower line, creating a “wedge” or “triangle” shape, but still try to trade it as a flat. If your lines are converging or diverging, the market psychology has shifted. It is no longer a standard sideways trend, and standard range-trading strategies will no longer apply.

Comments
No comments yet. Be the first to share your thoughts!
Authentication Required
You must be logged in to post a comment.