

The Parabolic SAR and The Supertrend Indicator
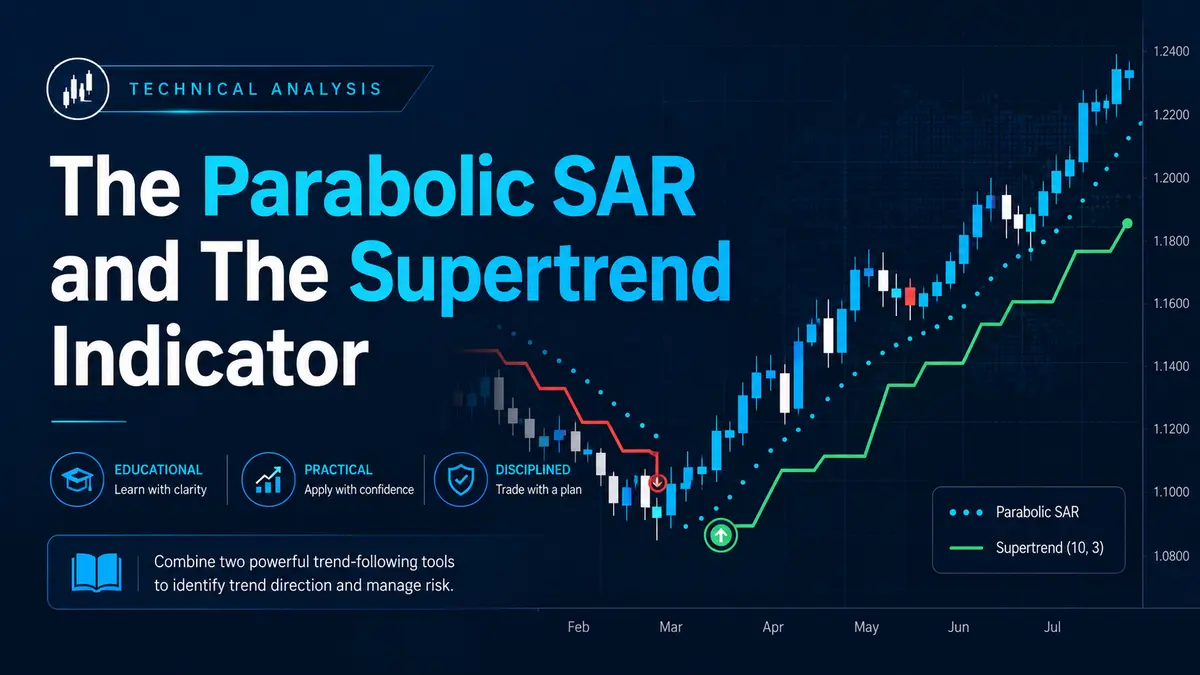
The Parabolic SAR (Stop and Reverse) Indicator
The Parabolic SAR (Stop and Reverse) is a highly effective, time-tested technical indicator developed by the famous market technician J. Welles Wilder. As its name suggests, it serves a dual purpose: it acts as a trend-following indicator to help traders determine the current market direction, and it serves as a highly dynamic trailing stop-loss mechanism to pinpoint exact trend reversals.
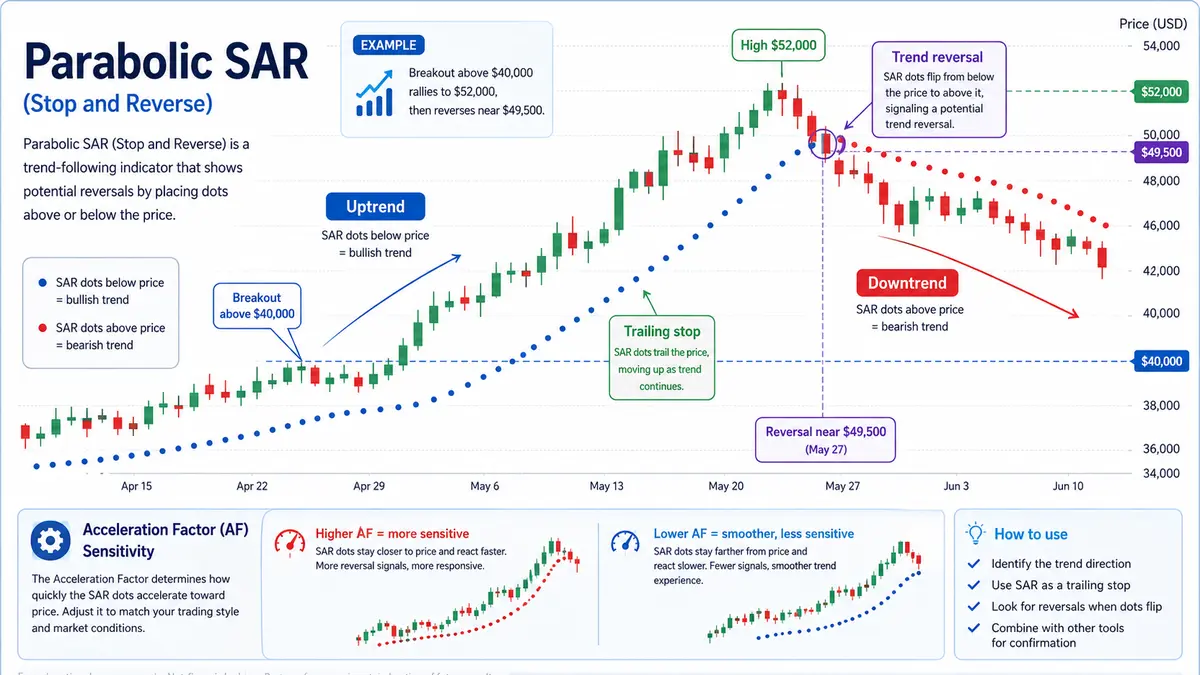
Visually, the Parabolic SAR is represented as a series of distinct dots plotted either above or below the price candlesticks on your chart.
-
The Uptrend: When the market is in an established uptrend, the SAR dots are plotted below the price bars. They act as a rising floor of support.
-
The Downtrend: Conversely, during a downtrend, the SAR dots flip and are plotted above the price bars, acting as a descending ceiling of resistance.
Tuning the Sensitivity: The Acceleration Factor (AF)
The mathematical engine driving the Parabolic SAR relies on two critical parameters: the Minimum Acceleration Factor (Step) and the Maximum Acceleration Factor.
Whenever the price achieves a new high (in an uptrend) or a new low (in a downtrend), the SAR algorithm increases the Acceleration Factor, causing the dots to move closer to the price action.
-
Increasing the Parameters: If you increase the value of the acceleration parameters in your settings, the SAR becomes highly sensitive. The dots will aggressively hug the price bars and change direction much faster. This is excellent for fast-paced scalping but can lead to premature exits in volatile markets.
-
Decreasing the Parameters: Lowering the acceleration factors makes the indicator less sensitive and more sluggish. The dots will trail further away from the price, allowing the asset more “breathing room” to fluctuate without triggering a false reversal signal.
-
Note: Adjusting the Minimum Acceleration Factor (the step) will have a much more profound impact on the indicator’s overall sensitivity than tweaking the Maximum Acceleration Factor.
Practical Trading Example: Trailing the Trend
Imagine you are trading Bitcoin (BTC) on a daily timeframe. Bitcoin breaks through a major resistance level at $40,000, and a Parabolic SAR dot appears below the candlestick, signaling a new uptrend. You decide to open a Long (Buy) position.
As Bitcoin steadily climbs to $42,000, $45,000, and $50,000, the SAR dots consistently print below the daily candles, automatically calculating a trailing stop-loss for you. You simply adjust your actual stop-loss order to match the exact price level of the most recent SAR dot each day. Eventually, Bitcoin hits $52,000 and suddenly experiences a sharp sell-off. The price violently drops and intersects the SAR dot plotted at $49,500. This intersection immediately flips the indicator — a new dot appears above the price, signaling a trend reversal. Your trailing stop is triggered at $49,500, securing a massive profit while protecting you from the subsequent crash down to $45,000.
Platform Setup: Adding the Parabolic SAR
Deploying the Parabolic SAR on your trading terminal is a quick and intuitive process:
-
Locate the Indicators icon on the top toolbar of your trading platform.
-
Hover your mouse over the icon to open the main dropdown menu.
-
Navigate to the Trend category.
-
Select Parabolic SAR from the list to apply it directly over your price chart.
The Supertrend Indicator: Navigating Market Volatility
The Supertrend is a robust and visually intuitive trend-following indicator explicitly designed to identify the dominant direction of the market. What makes the Supertrend unique is that its algorithm heavily incorporates market volatility — typically by using the Average True Range (ATR) paired with a specific multiplier — to calculate its dynamic support and resistance lines.
Visually, the Supertrend appears as a continuous line (often solid or dashed) plotted directly over the price chart. To make signal interpretation effortless, the line automatically changes colors based on the market’s momentum:
-
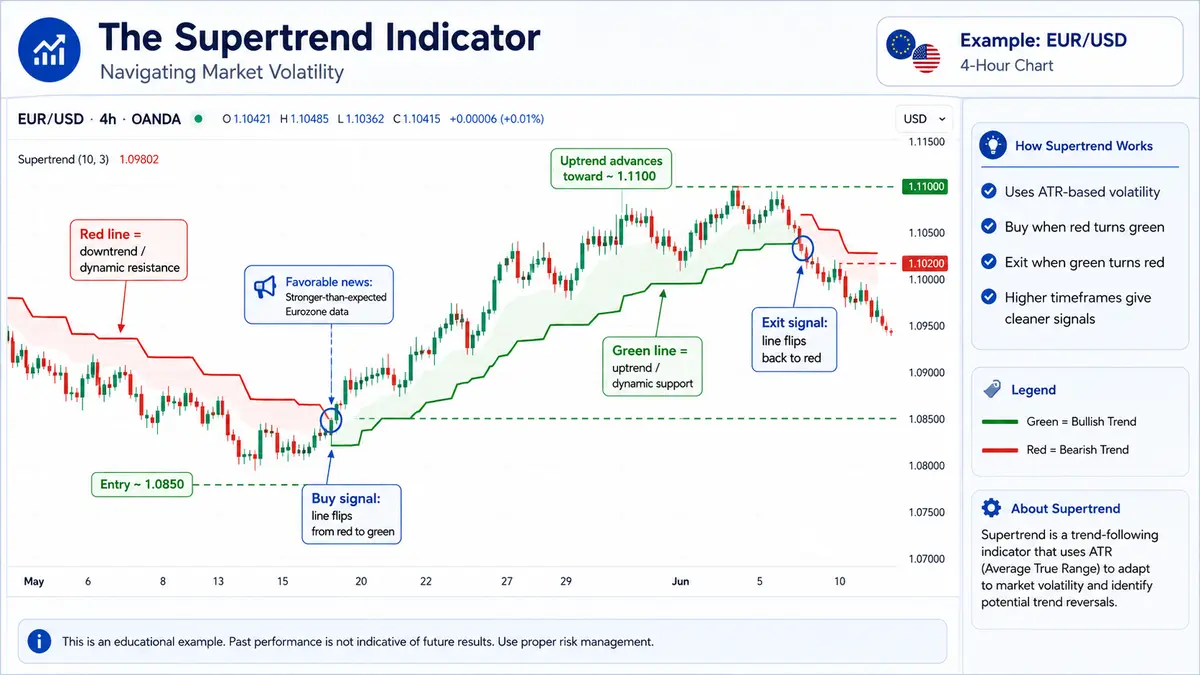
Green Line: Indicates an active upward trend. The line runs below the price, acting as dynamic support.
-
Red Line: Indicates an active downward trend. The line runs above the price, acting as dynamic resistance.
Generating Signals: When to Buy and Sell
The interpretation of Supertrend signals is incredibly straightforward, making it a favorite among both novice and professional systematic traders.
-
The Buy Signal: A trader opens a Long position exactly when the Supertrend line flips from Red to Green. To ensure confirmation, the trade is typically executed on the opening of the next candlestick after the color change occurs.
-
The Sell/Exit Signal: The exit strategy is equally simple. The trader holds the position until an inverse signal is generated (the line flips back from Green to Red), at which point they close the Long position and potentially open a Short position.
While the Supertrend algorithm functions mathematically on absolutely any timeframe (from 1-minute charts to monthly charts), higher timeframes inherently produce vastly more reliable signals. On a 5-minute chart, standard market noise can cause the Supertrend to rapidly flip colors back and forth, resulting in false signals. On a 4-hour or Daily chart, the indicator filters out the noise and captures massive, prolonged macro trends.
Practical Trading Example: Capturing a Forex Trend
Let’s assume you are trading the EUR/USD currency pair on a 4-hour chart. The market has been choppy, but suddenly, the European Central Bank announces favorable interest rates.
The EUR/USD price spikes, closing strongly above the red Supertrend line. Immediately, the line shifts below the price and turns Green. Following the rules, you wait for the current 4-hour candle to close. On the opening of the next candle, you execute a Long trade at 1.0850. You place your initial stop-loss slightly below the green Supertrend line. Over the next two weeks, the EUR/USD pair rallies smoothly up to 1.1100. The green line trails upward alongside the price, keeping you safely in the trade during minor pullbacks. Finally, the momentum exhausts, and the price drops sharply to 1.1020, piercing the green line. The Supertrend instantly flips to Red. You close your position at 1.1020 on the reversal signal, successfully locking in a 170-pip profit.
Platform Setup: Adding the Supertrend Indicator
To apply the Supertrend to your active chart, follow these standard steps:
-
Locate the Indicators icon on your platform’s top toolbar.
-
Hover your mouse over the icon to reveal the dropdown menu.
-
Navigate to the Trend section.
-
Select Supertrend from the list. Once applied, you can adjust the ATR Period and Multiplier in the indicator settings to best suit your chosen asset and timeframe.

Comments
No comments yet. Be the first to share your thoughts!
Authentication Required
You must be logged in to post a comment.