

Chart Pattern Analysis: Foundations and Application
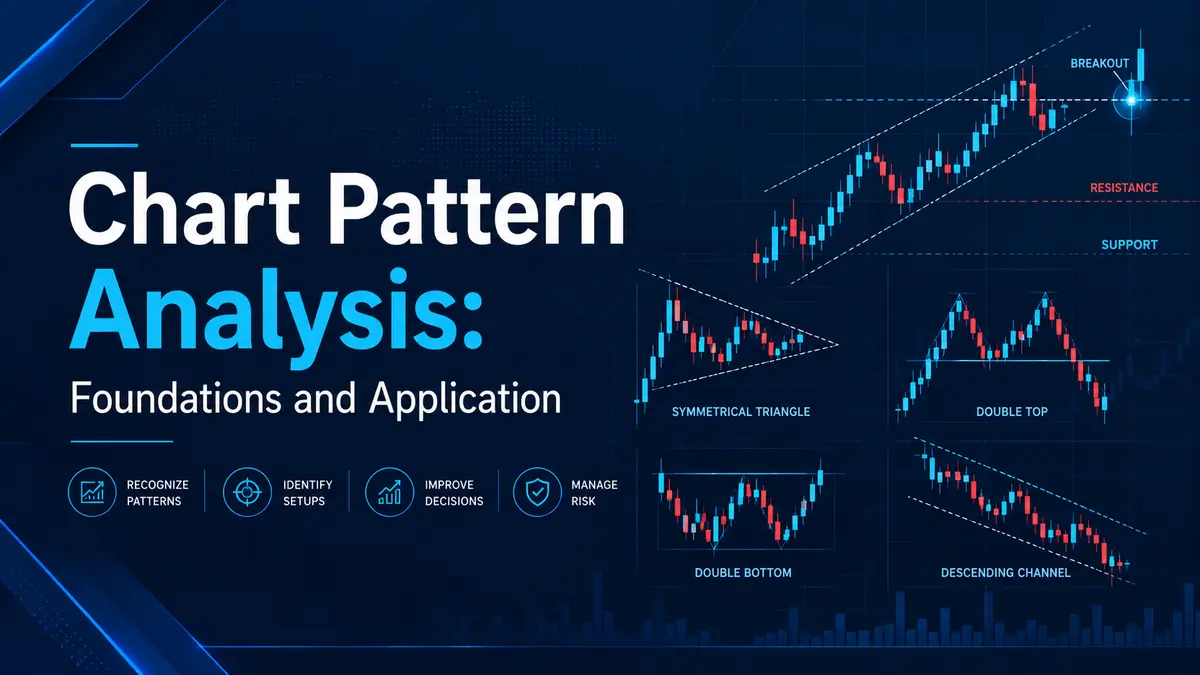
Traders and investors can generate substantial profits in the financial markets if they successfully select the optimal moment to execute their trades. For a short-term trader, this precision is absolutely vital — choosing the correct entry point dictates the entire risk-to-reward ratio and ultimately determines the overall profitability of the strategy.
For a long-term investor holding assets for years, matching the market’s precise turning points is less critical, yet finding an optimized entry can still significantly boost overall portfolio yields over time. To locate these high-probability entry points, market participants turn to the tools of technical analysis. Among the most celebrated and historically proven methods is the analysis of chart patterns — frequently referred to as price patterns.
Understanding Price Patterns: Strengths and Limitations
A chart pattern is a characteristic, recognizable configuration formed by price movements on a financial chart. Over decades of observation, these configurations often begin to visually resemble real-world geometric objects or structures, and they possess specific, mathematically reliable forecasting properties.
Market participants noticed long ago that under certain repetitive conditions, asset prices behave in highly predictable ways. When these specific psychological conditions occur, the chart naturally traces out easily identifiable shapes. Because the total number of highly reliable patterns is relatively small, and the rules for identifying them are straightforward, these combinations have become an essential component of almost every modern trader’s analytical toolkit.
Key Advantages of Pattern Analysis
-
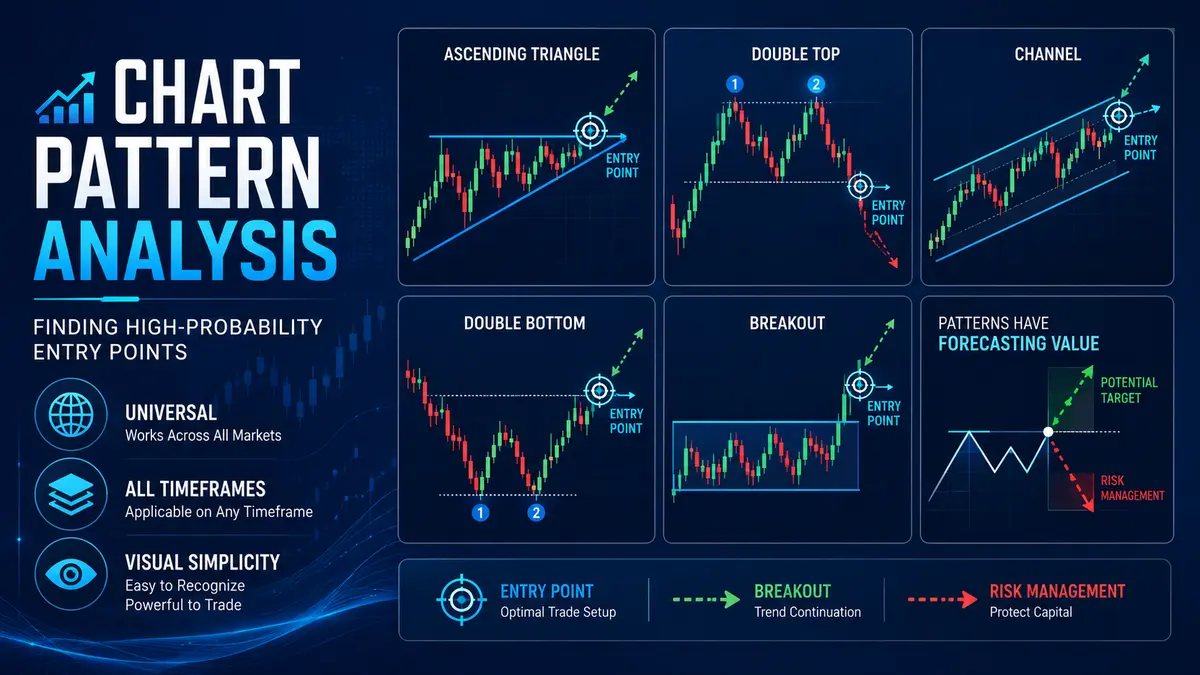
Universal Repeatability: Chart patterns form regularly across every liquid financial market — whether you are trading equities, cryptocurrencies, forex, or commodities. Furthermore, they are fractal, meaning they appear on all timeframes, from 5-minute intraday charts to weekly macro charts. The underlying behavioral dynamics following their completion remain consistent regardless of the asset class.
-
Visual Simplicity: Identifying these formations does not require complex mathematical equations or lagging computer algorithms. With a reasonable amount of charting experience, a trader can easily spot these patterns with the naked eye without relying on heavy external overlays.
The Major Drawback: Subjectivity
Despite their strengths, chart pattern analysis suffers from one notable flaw — subjectivity. Because human eyes interpret visual data differently, chart analysis can occasionally turn into a psychological inkblot test. Where one trader sees a perfectly completed pattern ready for execution, another trader might see nothing but random, uncoordinated market noise.
This inherent variation is exactly why some critics argue that chart patterns are unreliable or fail to hit their targets consistently.
An Expert Perspective: Visual subjectivity is not unique to chart patterns; it is a fundamental characteristic of all technical analysis methods when performed by a human brain rather than a rigid algorithmic trading script. You should never dismiss time-tested technical tools simply because they require human discretion. Instead, you must learn to strictly apply objective rules to your visual analysis to filter out false signals.
Classification of Graphic Formations
Graphic chart patterns are structural formations that appear on a price chart, allowing a trader to forecast whether a price is likely to reverse its current path or accelerate forward in its established direction.
In technical analysis, all structural price formations are divided into two primary categories:
-
Trend Reversal Patterns
-
Trend Continuation Patterns
The Golden Rule of Chart Analysis
The most vital principle when analyzing any graphic chart formation is a strict, disciplined adherence to the nuances of construction, coupled with patience. No pattern is complete until the price decisively breaks through the defining Support or Resistance line of that specific formation.
Entering a trade before this breakout occurs is a critical mistake. Until the breakout happens, the pattern is merely a hypothetical drawing on your screen, and acting prematurely often results in severe losses when the market invalidates the setup.
Trend Reversal Patterns
Trend reversal formations are among the most frequent and highly efficient structures found on price charts. They typically develop at major market extremes where the dominant trend runs out of momentum, loses liquidity, and ceases to exist. These patterns are highly prized because they provide early, mathematically sound signals to open positions against the dying trend, allowing you to catch the absolute beginning of a brand-new market cycle.
Practical Example: The Head and Shoulders Reversal
The most iconic example of a trend reversal pattern is the Head and Shoulders formation, which marks the transition from an uptrend to a downtrend.
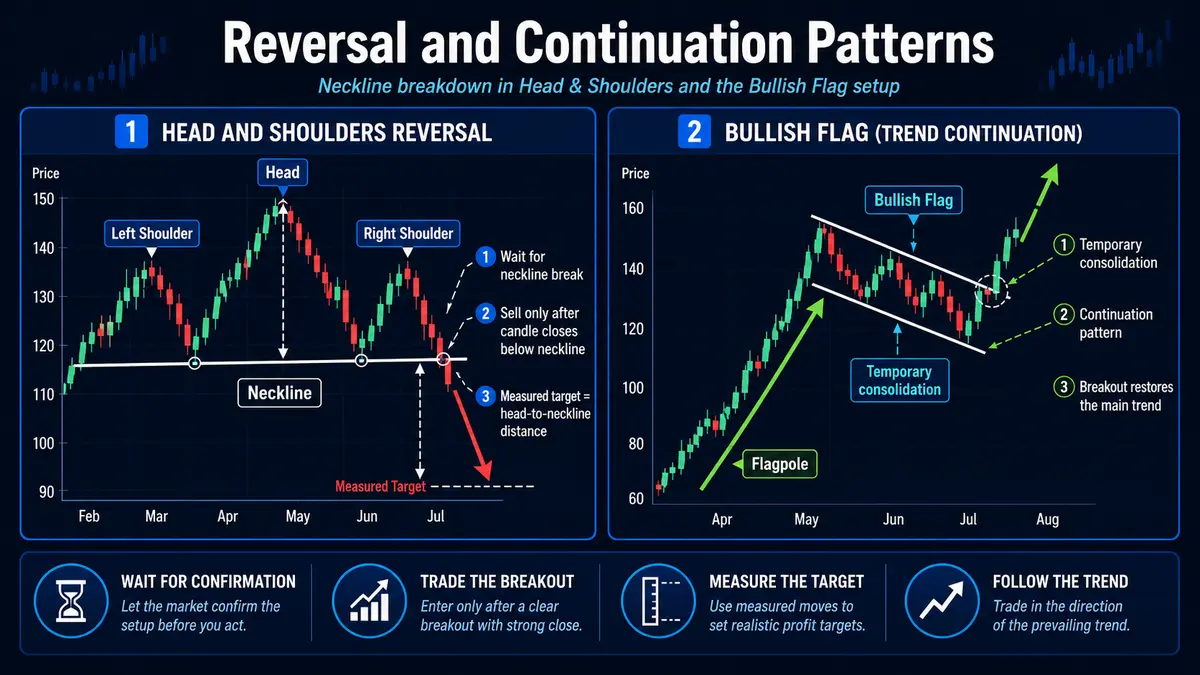
Imagine an asset climbing steadily in an uptrend, creating a peak (the left shoulder) followed by a temporary pullback. The price rallies again to a significantly higher peak (the head), but the subsequent decline drops all the way back down to the level of the previous pullback. A final, weaker rally occurs, creating a lower peak that fails to match the head (the right shoulder).
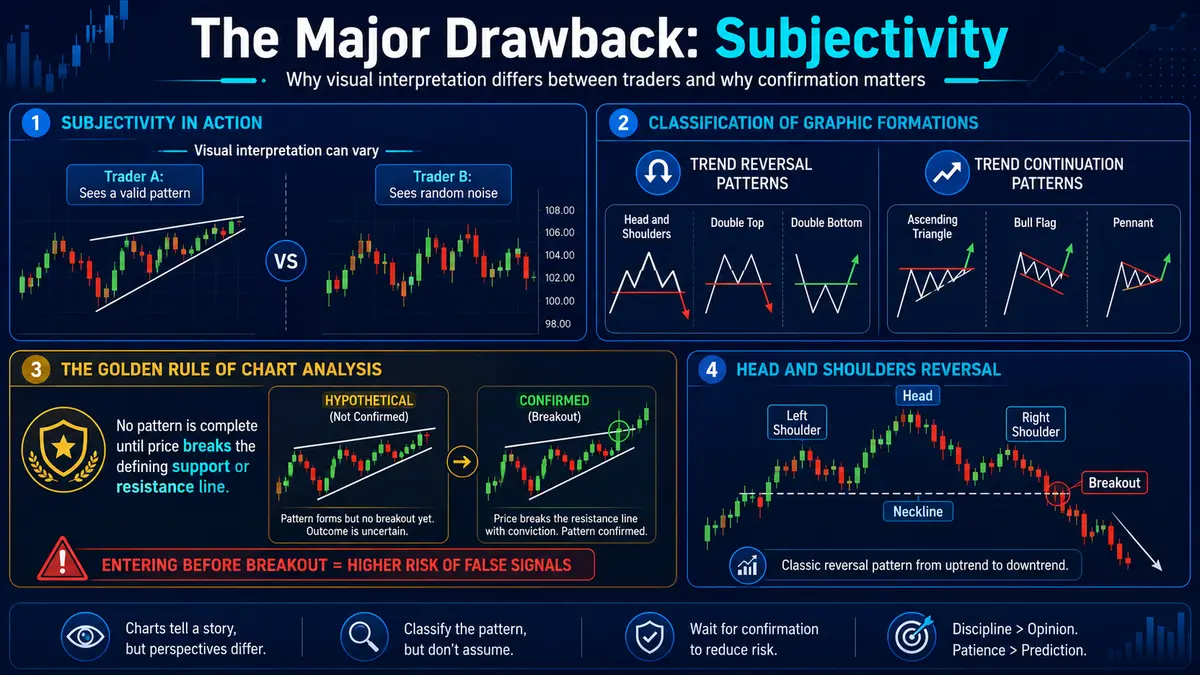
To trade this properly, you draw a horizontal or slightly slanted support line across the bottom valleys of the structure; this line is known as the Neckline.
-
The Blueprint: You do not sell when the right shoulder is forming. You wait patiently for the price to break down through the Neckline.
-
The Execution: Once a candlestick closes below the Neckline, the reversal is confirmed. You open a short position, anticipating a massive downward drop equal to the vertical distance between the top of the head and the neckline.
Trend Continuation Patterns
Trend continuation formations develop when a dominant market trend temporarily pauses to catch its breath. Rather than signaling a market top or bottom, these patterns represent a brief period of asset consolidation. During this phase, the market moves sideways or slightly counter to the main trend as weaker hands take profits and stronger hands accumulate larger positions. Once this temporary pause concludes, the price aggressively breaks out and restores its movement in the original direction.
Continuation patterns are incredibly useful because they provide safe, high-probability entry points to join an ongoing macro trend that you might have missed during its initial launch.
Practical Example: The Bullish Flag
A classic illustration of a continuation pattern is the Bullish Flag. This pattern typically forms after an explosive, nearly vertical price rally (known as the flagpole).
Following this rapid surge, the market begins a brief, orderly consolidation. The price drifts slightly downward, trapped between two tightly packed, parallel support and resistance lines. Visually, this resembles a small downward-sloping flag waving on top of a tall pole.
-
The Blueprint: Novice traders often look at the downward drift of the flag and panic, thinking the trend is over. Experienced technical analysts know this is simply an accumulation phase.
-
The Execution: You monitor the upper descending resistance line of the flag structure. The exact moment the price surges upward, piercing through that upper resistance line with expanding volume, the continuation pattern is triggered. You immediately execute a buy order, projecting a future upward move equal to the vertical height of the original flagpole.

Comments
No comments yet. Be the first to share your thoughts!
Authentication Required
You must be logged in to post a comment.