

The Patterns of Technical Analysis, Continued
The Triangle Pattern
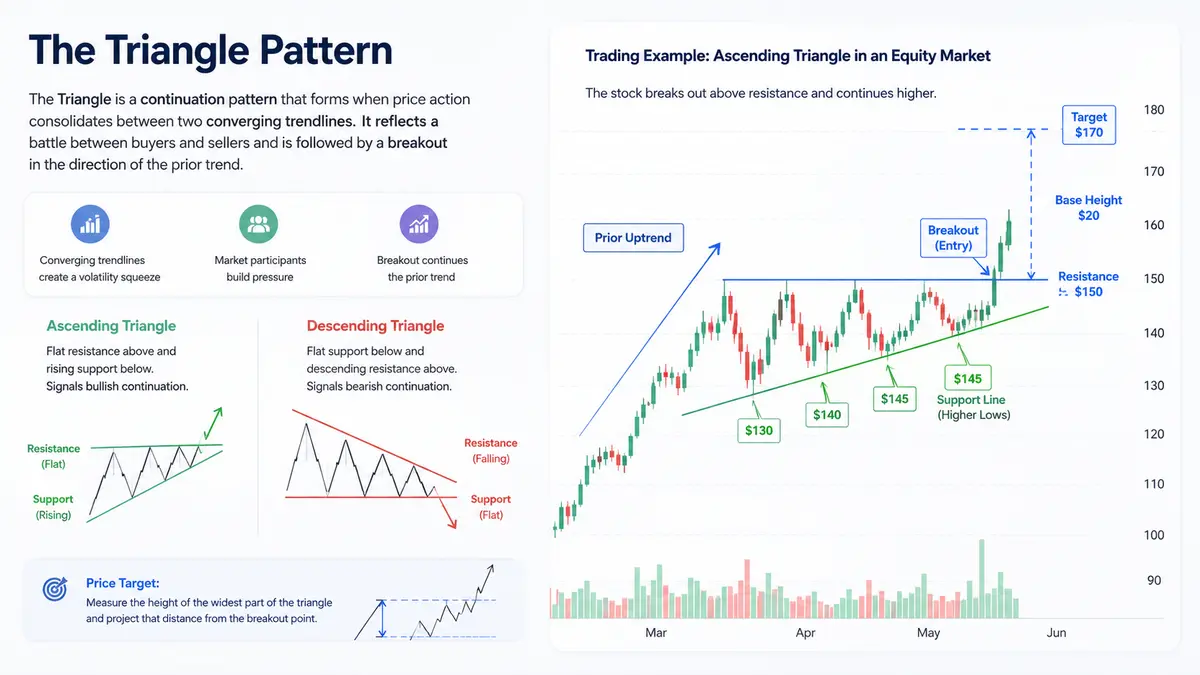
The Triangle is universally recognized as one of the most reliable and frequently occurring chart patterns, performing with high accuracy across all financial markets and timeframes. Structurally, it is characterized by two converging trendlines: one side is typically formed by a horizontal line representing a strong, static level of support or resistance, while the second line is sloped, indicating dynamic price action.
This specific price movement highlights a growing interest among market participants in overcoming a key level, acting as a period of resource accumulation. This buildup of pressure is visually confirmed by the decreasing amplitude of the price swings, often referred to as a “volatility squeeze.”
Regardless of whether the market was experiencing a massive rally or a steep sell-off before the triangle formed, this pattern is generally classified as a continuation pattern. This means the market is highly likely to break out and continue its trajectory in the exact same direction it was heading prior to the consolidation.
Triangles also offer built-in price targets, which are calculated by measuring the widest part of the pattern and projecting that distance from the breakout point.
Ascending and Descending Triangles
-
The Ascending Triangle: This is formed by a flat upper resistance line and a rising lower support line (higher lows). It indicates that buyers are becoming increasingly aggressive, stepping in at higher prices, while sellers are merely defending a fixed price level.
-
The Descending Triangle: This features a flat lower support line and a descending upper resistance line (lower highs). It shows that sellers are dominating the tape, willing to offload the asset at increasingly lower prices, while buyers are only willing to defend a specific floor.
Trading Example: Ascending Triangle in an Equity Market Imagine a stock that has rallied from $100 to $150. At $150, it hits a massive wall of sellers (resistance). The price drops to $130, then rallies back to $150. It drops again, but this time only to $140, before rallying back to $150. Finally, it drops to $145.
This sequence of higher lows ($130, $140, $145) forms the rising support line, while the $150 mark forms the flat horizontal resistance. Once the buying pressure absorbs all the selling orders at $150, the stock explosively breaks out upward. An entry is taken upon the break of $150, with a target of $170 (calculated by taking the $20 base height and adding it to the breakout point).
The Wedge Pattern
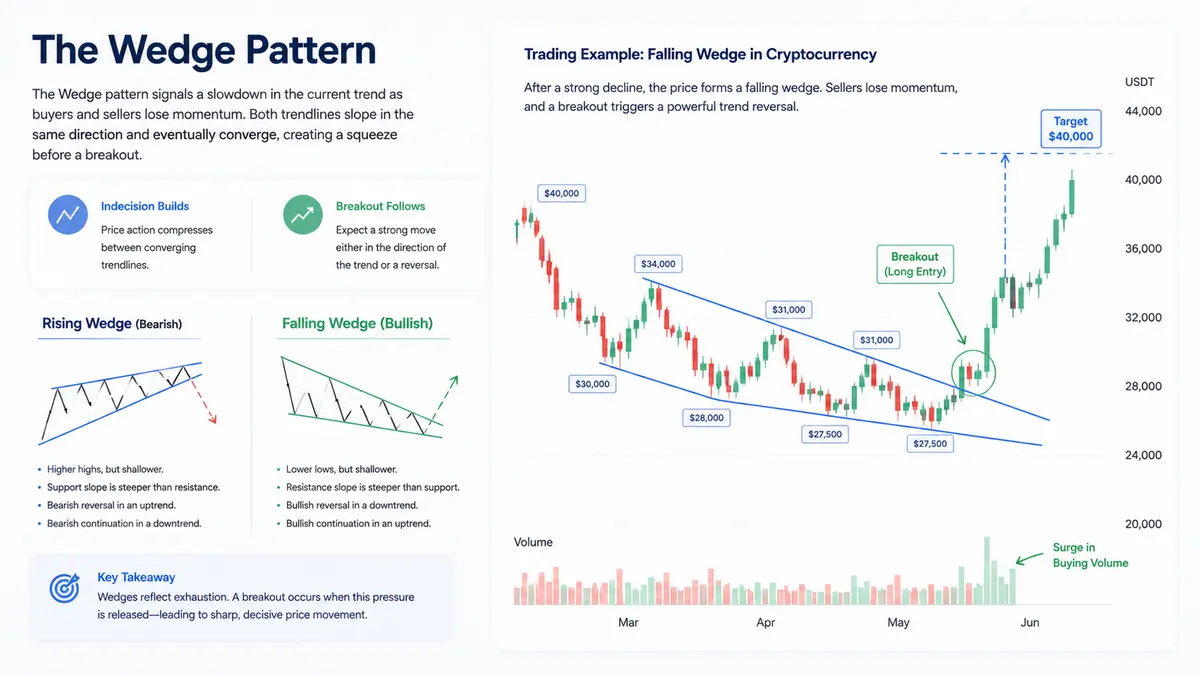
The Wedge pattern is a critical technical formation that signals a distinct deceleration in the current trend. When a wedge appears on a chart, it reflects a growing indecision and exhaustion among traders regarding the asset’s future direction. Unlike a standard symmetrical triangle where the lines converge from opposite directions, both trendlines in a wedge slope in the same direction (either both up or both down), but at different angles so that they eventually intersect.
Following a wedge, a trader should anticipate either a sharp trend reversal or a powerful trend continuation.
Rising and Falling Wedges
-
The Rising Wedge: This pattern forms when price consolidates between upward-sloping support and resistance lines. Crucially, the support line’s slope is much steeper than the resistance line’s slope. This means that while the price is making higher lows and higher highs, the higher highs are becoming progressively shallower. This structural weakness indicates an impending downward breakout.
-
If a Rising Wedge forms during a macro uptrend, it acts as a bearish reversal pattern.
-
If a Rising Wedge forms during a macro downtrend, it acts as a bearish continuation pattern.
-
-
The Falling Wedge: This is the exact inverse. It features downward-sloping trendlines where the resistance line is steeper than the support line. This indicates that seller momentum is drying up. Regardless of whether it forms in an uptrend or a downtrend, a Falling Wedge is overwhelmingly considered a bullish signal, typically resulting in an upward breakout.
Trading Example: Falling Wedge in Cryptocurrency A digital asset crashes from $40,000 to $30,000. It bounces to $34,000, then falls to $28,000. It bounces again to $31,000, and falls to $27,500. Notice how the highs are dropping rapidly ($40k, $34k, $31k), but the lows are barely moving lower ($30k, $28k, $27.5k). The sellers are losing their strength. As the price pinches into the apex of this falling wedge, a surge of buying volume cracks the upper resistance line, triggering a massive long entry and reversing the downtrend.
The Flag Pattern
The Flag is a classic and highly coveted trend continuation pattern. It provides traders with an optimal, low-risk opportunity to enter the market squarely in the middle of an active trend.
A Flag pattern is initiated by a sudden, aggressive, and nearly vertical price movement — either up or down — driven by heavy volume. This initial thrust is known as the “flagpole.” Following this explosive move, the market suddenly pauses as early investors take their profits.
During this pause, the price drifts in a tight, orderly consolidation phase, often moving slightly against the primary trend. If you draw trendlines above and below this consolidation range, they form a perfect, parallel rectangle that tilts downward (in an uptrend) or upward (in a downtrend), perfectly resembling a flag on a pole.
Eventually, the price shatters the flag’s boundaries and resumes its aggressive trajectory in the direction of the original flagpole.
Bullish and Bearish Flags
Just like most technical formations, flags are categorized by their market bias:
-
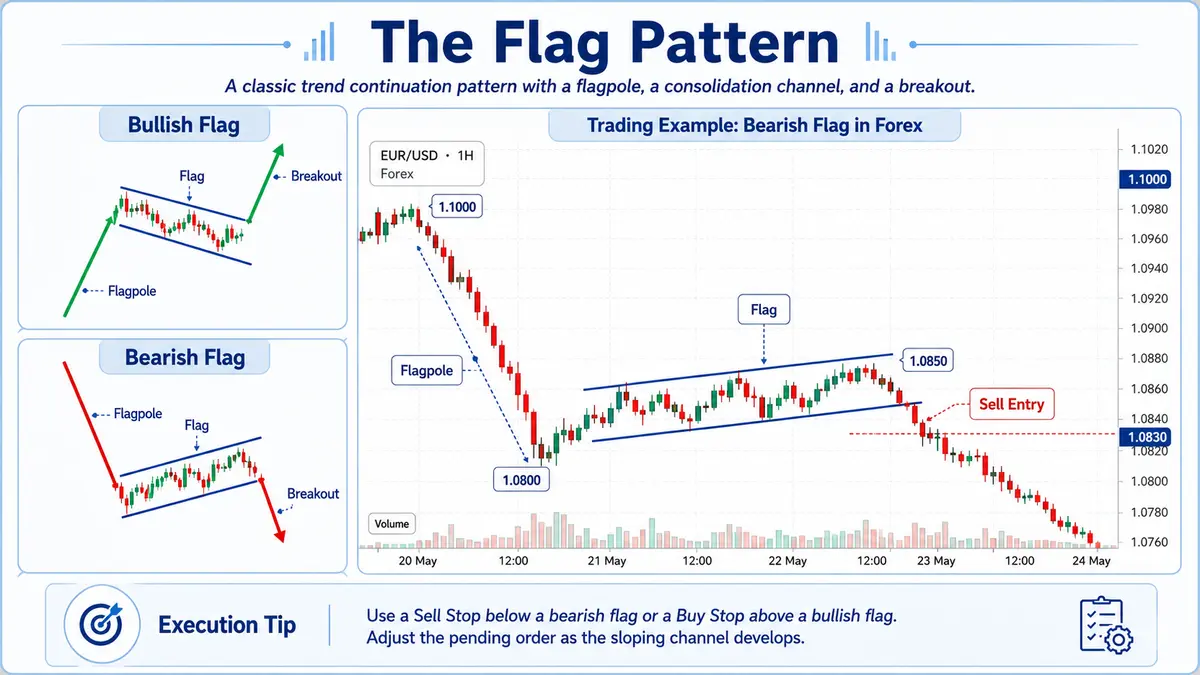
Bullish Flag: A sharp rally (pole) followed by a slight downward sloping channel. It resolves with an upward breakout.
-
Bearish Flag: A sharp crash (pole) followed by a slight upward sloping channel. It resolves with a downward breakout.
Trading Example: Bearish Flag in Forex The EUR/USD pair plunges rapidly from 1.1000 to 1.0800 due to bad economic data (the flagpole). For the next two days, the price slowly and weakly drifts upward in a parallel channel, reaching 1.0850. This counter-trend drift is the flag. A trader spots this and waits. Once the price breaks below the bottom support line of the flag at 1.0830, they open a short position.
Important Note on Execution: The recommended entry method for flag patterns is placing pending orders (Buy Stop for bullish flags, Sell Stop for bearish flags) just outside the flag’s boundaries. However, because the channel is sloped, you must actively adjust your entry price to trail the boundary as the chart develops.
The Rectangle Pattern
The Rectangle is a straightforward but powerful consolidation pattern that forms when the price bounces between two strictly horizontal, parallel levels of support and resistance.
This pattern visually represents a prolonged tug-of-war between buyers and sellers, where neither side can establish dominance. It is a period of pure market indecision. The price will repeatedly test the upper resistance ceiling and the lower support floor before finally gathering enough momentum to execute a decisive breakout. Once the breakout occurs, the price will almost always continue advancing in the direction of the breach.
Bullish and Bearish Rectangles
-
Bearish Rectangle: This forms when an asset in an established downtrend pauses to consolidate. The sideways movement allows the market to “catch its breath” before breaking the lower support and plunging further.
-
Bullish Rectangle: This forms during a strong uptrend. The price moves sideways as early buyers take profit and new buyers accumulate positions, ultimately leading to a breakout above resistance and a continuation of the rally.
Trading Example: Bullish Rectangle in Commodities Gold is rallying strongly and hits $2,000 per ounce. Over the next month, it fluctuates strictly between $1,950 (support) and $2,000 (resistance), touching each boundary three distinct times. This forms a perfect box. A trader will wait patiently until a daily candle closes above the $2,000 resistance level. Upon that confirmation, they open a long position, expecting the uptrend to resume violently.
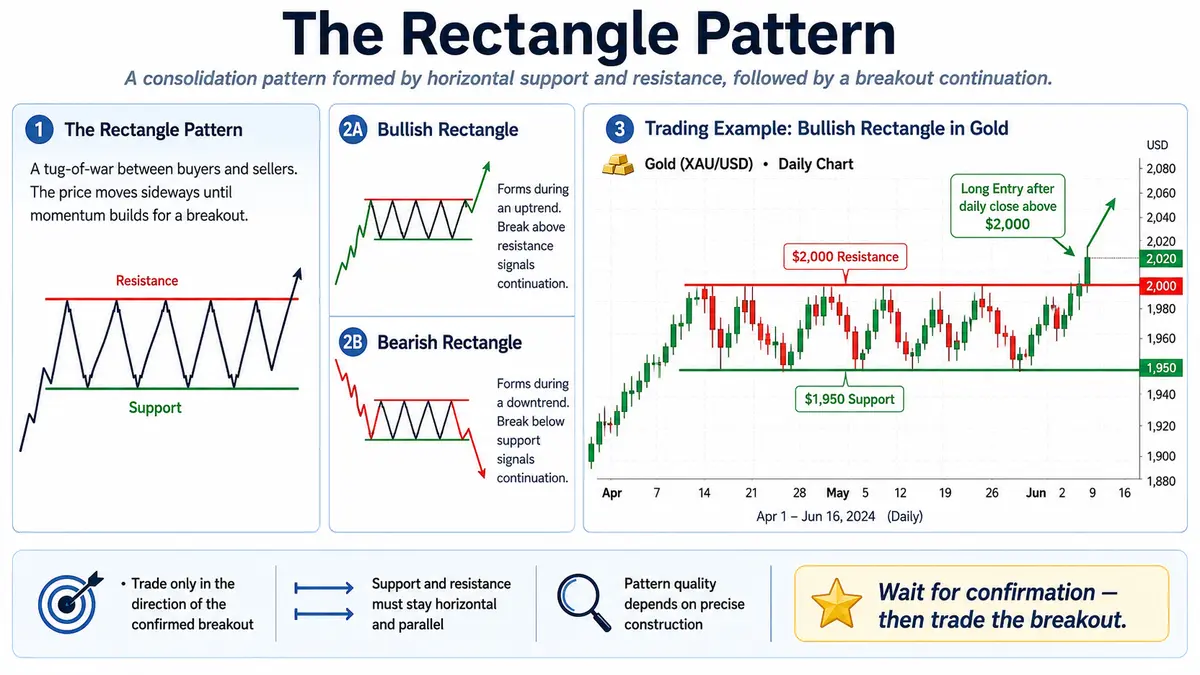
A Final Word on Technical Precision: Positions should only be opened in the direction of the confirmed breakout. Furthermore, the construction of all the aforementioned patterns must adhere to strict technical rules. You cannot violate parallel lines when drawing flags or rectangles, and all trendlines must be drawn precisely through the extreme “points” (wicks or bodies, depending on your methodology). Only when a pattern is drawn correctly can its signals be trusted.

Comments
No comments yet. Be the first to share your thoughts!
Authentication Required
You must be logged in to post a comment.