

The Definitive Guide to Moving Averages in Trading
Moving Averages are among the most popular and foundational technical indicators used by traders across the globe. Their primary objective is to determine the presence, direction, and strength of a market trend by filtering out the “noise” of random, short-term price fluctuations.
By smoothing out price action over a specified period, these indicators allow traders to clearly see the underlying macroeconomic trajectory of an asset.
Modern trading platforms, such as cTrader, typically offer several distinct types of moving averages, including Simple, Exponential, Triangular, Time Series, and Weighted. Each underlying mathematical formula yields slightly different results, catering to different trading styles and timeframes.
Below, we will explore the four most prominent variations of the Moving Average and how to utilize them in your daily trading.
Simple Moving Average (SMA)
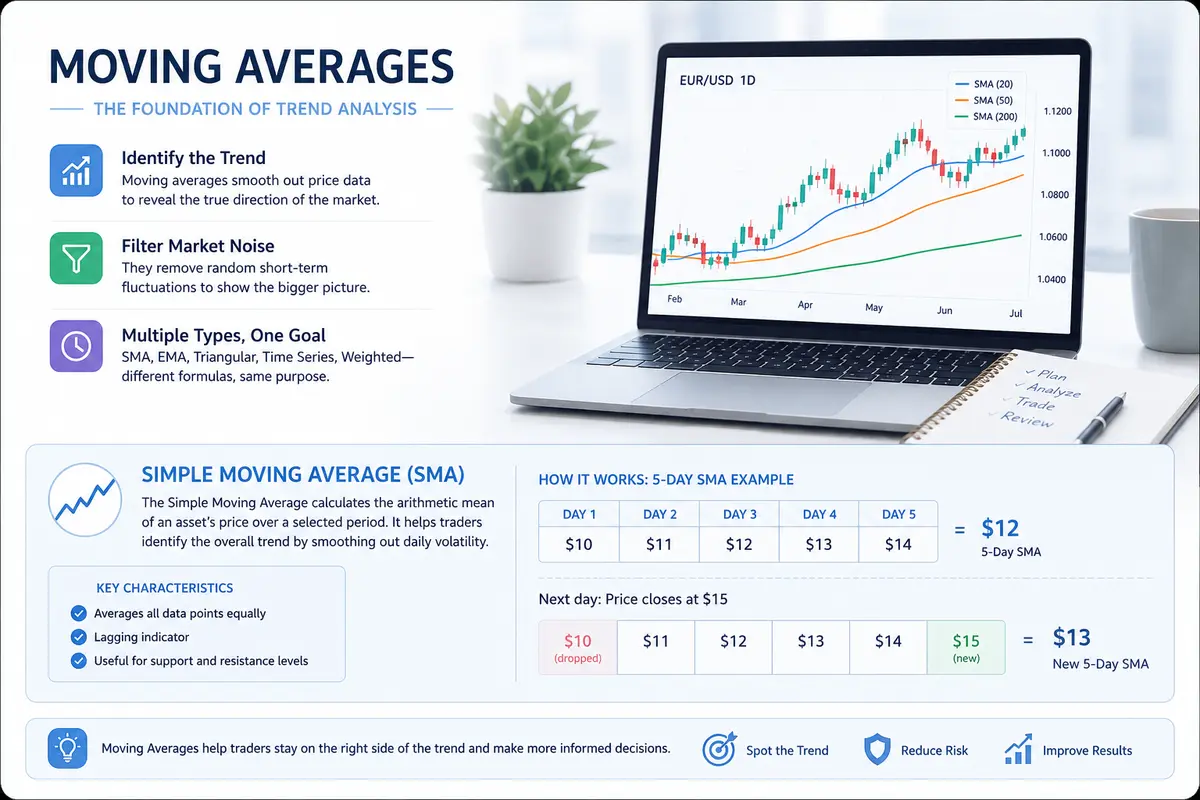
The Simple Moving Average is the most basic and widely used variation. It is formed by calculating the arithmetic mean of an asset’s price over a specific, predetermined period of time. Its main task is to filter out the erratic daily fluctuations of currency pairs or stocks to identify the subsequent, overarching trend.
Because it treats all data points equally, the SMA is a slower-moving, lagging indicator. It is highly effective for identifying long-term support and resistance levels.
Example: To calculate a 5-day SMA, you add the closing prices of the last 5 days and divide by 5. If a stock closed at $10, $11, $12, $13, and $14 over the past week, the SMA value is $12. If the next day closes at $15, the oldest day ($10) is dropped from the calculation, and the new SMA shifts upward to $13.
Exponential Moving Average (EMA)
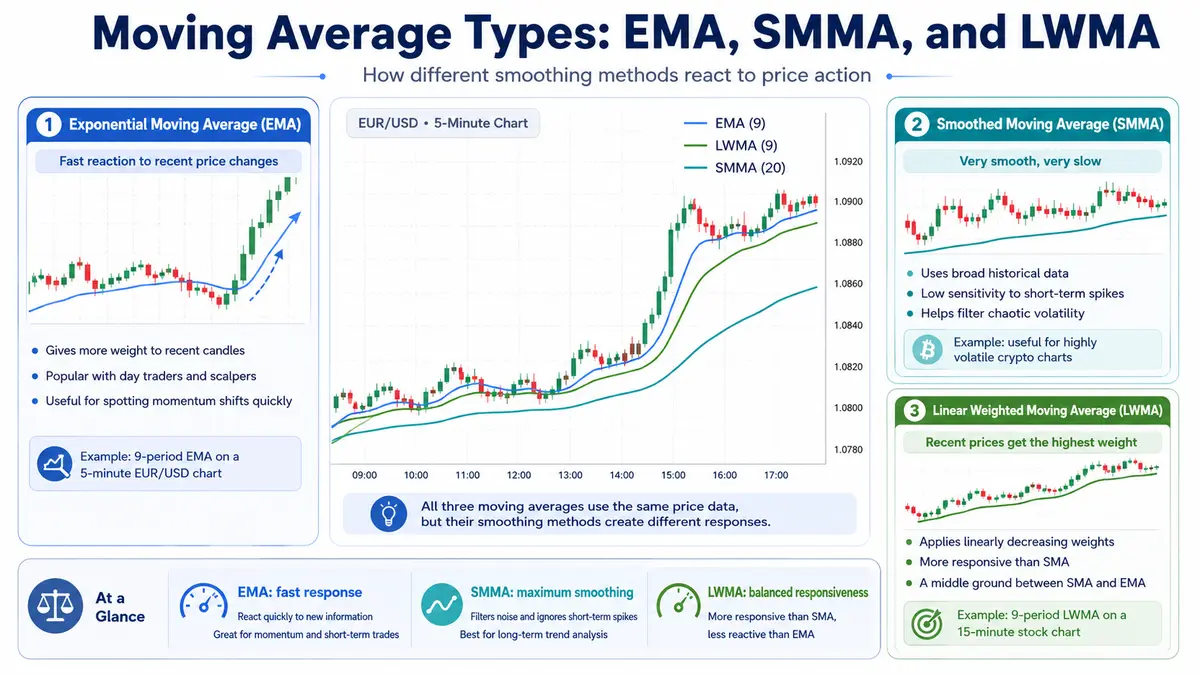
The Exponential Moving Average is designed to react much faster to recent price changes, providing a more precise smoothing effect during active analysis. Unlike the SMA, the EMA formula applies greater mathematical weight to the most recent price data.
While it still uses previous historical prices in its calculation, the heavy emphasis on the latest candlesticks makes the EMA a favorite among day traders and scalpers who need to detect momentum shifts instantly.
Example: A trader scalping the 5-minute chart of the EUR/USD pair will likely prefer a 9-period EMA over a 9-period SMA. If a sudden news event causes a massive spike in price, the EMA will instantly bend upward to reflect this new momentum, whereas the SMA will lag behind, potentially causing the trader to miss the entry.
Smoothed Moving Average (SMMA)
The Smoothed Moving Average is a highly complex moving average characterized by extremely low sensitivity to price action. It takes into account all historical data points available, but assigns them a relatively flat weight.
Because of its sluggish nature, the SMMA is used quite rarely. It is specifically reserved for analyzing charts that exhibit massive, chaotic amplitudes of price fluctuations. Its sole purpose in these environments is to ruthlessly smooth out false price movements and extreme volatility spikes.
Example: If you are trading a highly volatile, low-cap cryptocurrency that frequently experiences massive 20% price wicks in both directions, a standard EMA would generate dozens of false signals. Applying an SMMA acts as a heavy anchor, ignoring the erratic wicks and showing you only the true macroeconomic trend of the coin.
Linear Weighted Moving Average (LWMA)
The Linear Weighted Moving Average takes the concept of weighting to a strict mathematical extreme. In a weighted moving average, the most recent data point is assigned the absolute highest weight, and each preceding data point receives progressively less weight in a linear, step-by-step fashion.
This is calculated by multiplying each closing price in the considered series by a specific, decreasing weighting coefficient. It is a middle ground between the simple SMA and the hyper-reactive EMA.
Setting Up the Indicator on Your Platform
Connecting and deploying a Moving Average on your trading chart is a straightforward process across almost all major trading terminals (like cTrader, MetaTrader, or TradingView).
-
Locate the Indicators icon (usually represented by a mathematical symbol like f(x) or a chart icon) on your platform’s top toolbar.
-
Hover your mouse over the icon to open the dropdown menu.
-
Navigate to the “Trend” indicators category.
-
Select “Simple Moving Average” (or your preferred variation) from the list.
-
A settings window will appear. Here, you must choose your Period (the number of candles the indicator will calculate, such as 20, 50, or 200). Once applied, the line will render directly over your price candles.
Core Trading Strategies
Once you have applied your Moving Averages to the chart, it is time to build a trading strategy. Here are the two most foundational methods for trading with these indicators.
1. The Single Moving Average Strategy (Price Crossovers)
This is the simplest method for utilizing a moving average, relying entirely on how the live price interacts with the indicator line.
-
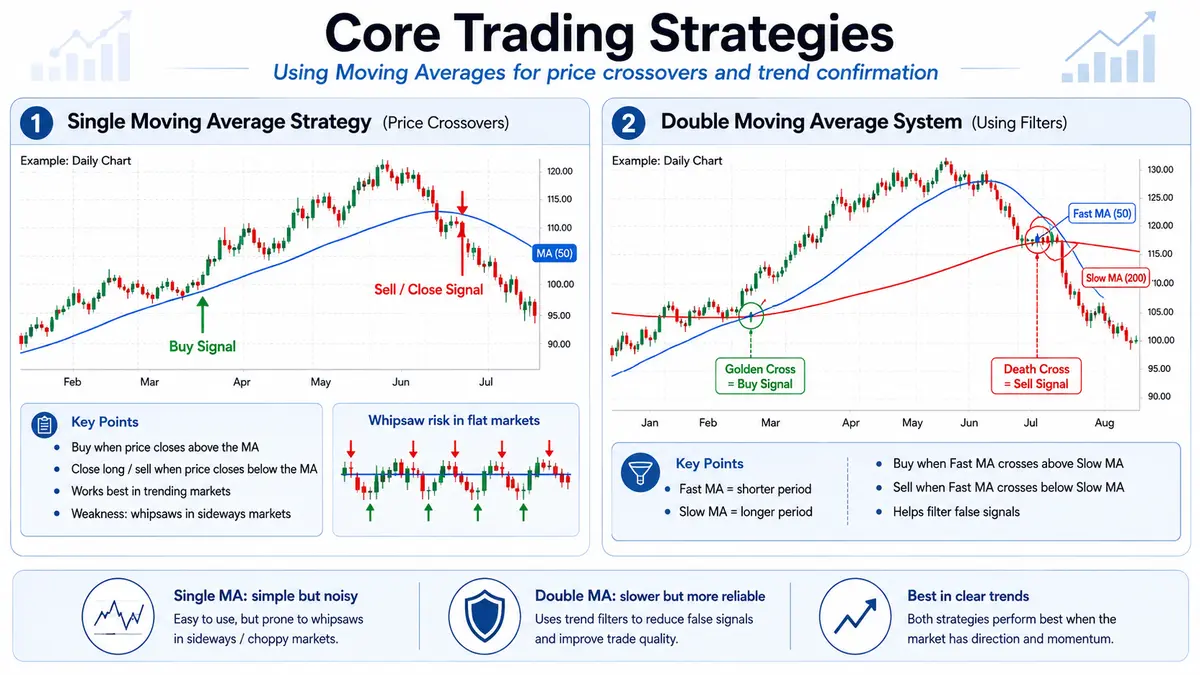
The Buy Signal: If the closing price of a bar (candlestick) firmly fixes above the moving average, and the actual price chart decisively breaks the moving average from the bottom up, a signal is generated to open a Long (Buy) position.
-
The Sell/Close Signal: As soon as the price chart breaks the moving average in the opposite direction (from top to bottom), and the closing price of the candlestick is below the moving average, the Buy trade must be closed immediately. Simultaneously, this serves as an inverse signal to open a Short (Sell) position.
The Catch: This specific method forces you into a state of constant market presence. As soon as one position is closed, the exact same signal forces you to open the opposite position. While this works beautifully in strong, trending markets, it can lead to devastating “whipsaws” (rapid false signals) if the market enters a flat, sideways consolidation phase.
2. The Double Moving Average System (Using Filters)
To mitigate the false signals of the single MA strategy, professional traders developed technical filters — most notably, the dual moving average crossover system.
This strategy requires plotting two moving averages on your chart simultaneously. They must use the exact same calculation method (e.g., both must be SMAs or both must be EMAs), but they must have distinctly different time periods.
-
The moving average with the shorter time period (e.g., 50 days) is referred to as the “Fast” MA.
-
The moving average with the longer time period (e.g., 200 days) is referred to as the “Slow” MA.
How to Trade the Dual System:
-
The Buy Signal: A confirmed signal to buy appears only when the “Fast” moving average crosses the “Slow” moving average from the bottom up.
-
The Sell Signal: You close the long position (and simultaneously open a short position) only when the “Fast” moving average crosses the “Slow” moving average from the top down. This cycle can theoretically continue indefinitely.
The Ultimate Example (The Golden Cross): The most famous double MA strategy in the world of stock trading uses a 50-day SMA (Fast) and a 200-day SMA (Slow). When the 50-day crosses above the 200-day, it forms a highly coveted pattern known as a “Golden Cross,” signaling a massive, long-term bull market. Conversely, when the 50-day crosses below the 200-day, it triggers a “Death Cross,” warning investors of an impending, severe bear market.

Comments
No comments yet. Be the first to share your thoughts!
Authentication Required
You must be logged in to post a comment.