

The Average Directional Movement Index (ADX)
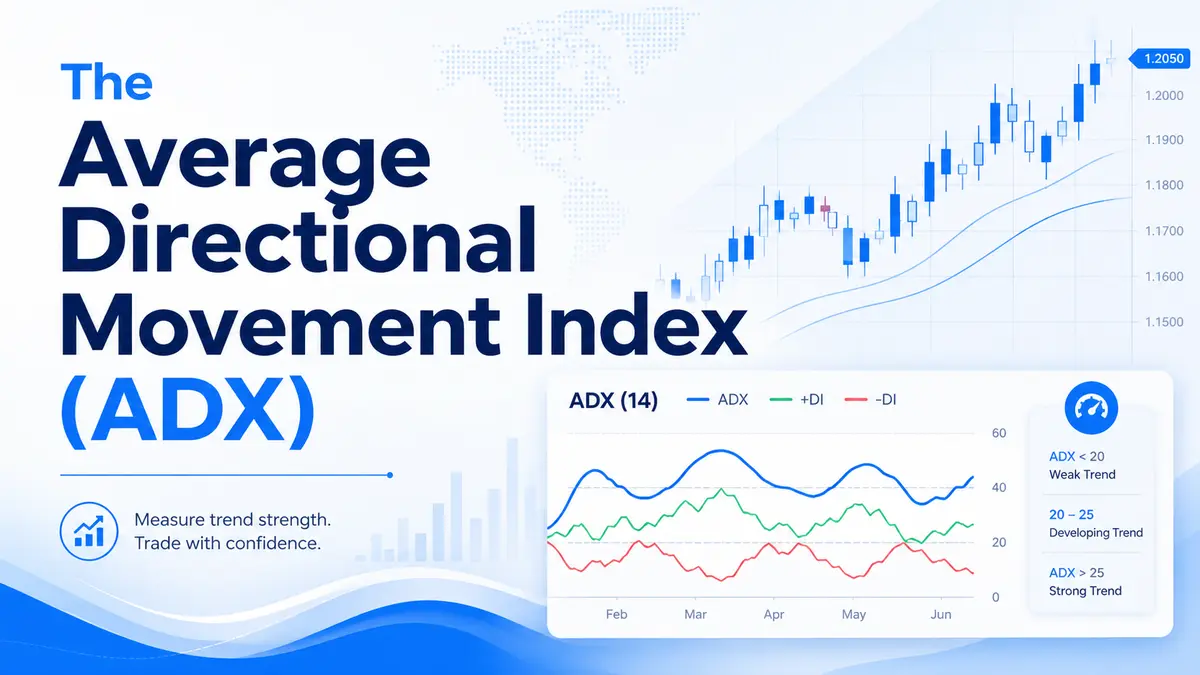
The Average Directional Movement Index (ADX) is a highly effective and widely used technical trading indicator designed to help traders determine the presence, absence, direction, and overall strength of a market trend. Developed by the legendary technical analyst J. Welles Wilder, this tool is essential for traders who want to avoid choppy, sideways markets and capitalize on strong, sustained price movements.
To fully understand the market’s behavior, the ADX system utilizes three distinct lines plotted on a single chart panel below the main price window: the Plus Direction Indicator (+DI), the Minus Direction Indicator (-DI), and the ADX line itself.
Decoding the Three Lines
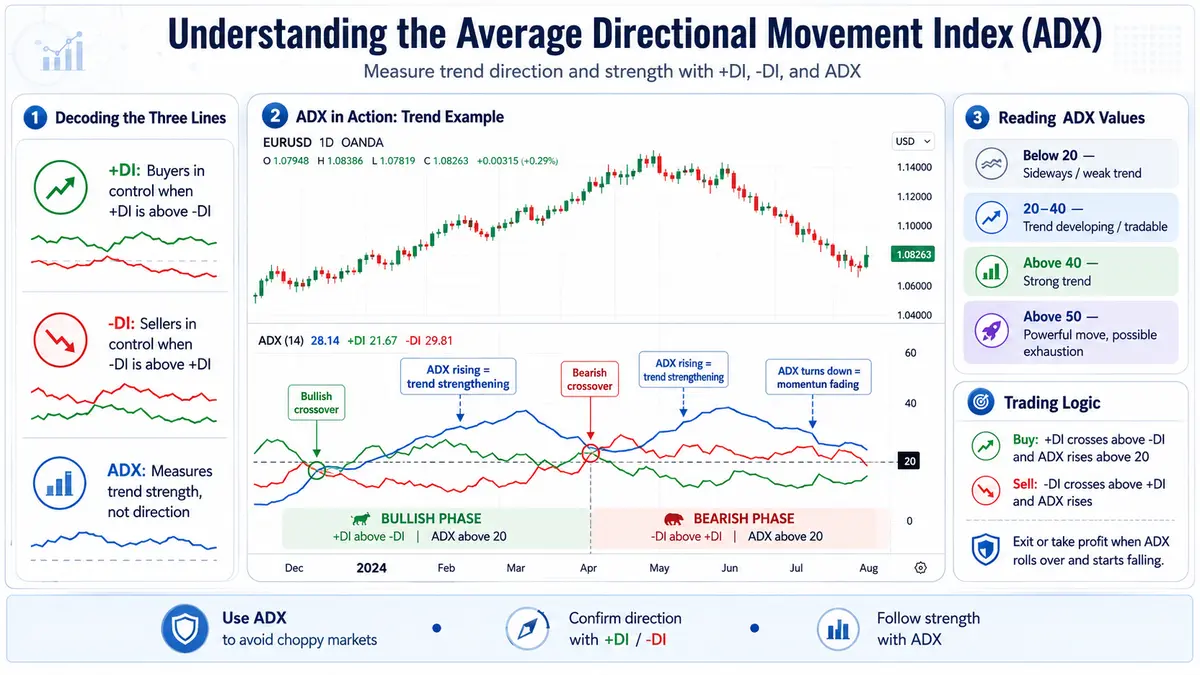
The direction of the market is identified by the relationship between the +DI and -DI lines, while the ADX line acts as a pure measure of trend strength, regardless of whether the market is moving up or down.
-
The Bullish Trend: If the +DI line is positioned above the -DI line, bullish sentiment prevails in the market. Buyers are in control, indicating an established or emerging up-trend.
-
The Bearish Trend: Conversely, if the -DI line crosses and stays above the +DI line, bearish pressure is dominant. Sellers have taken control, forming a down-trend.
-
The Trend Strength (ADX): The ADX line does not tell you which way the market is going; it only tells you how strong the current move is.
Reading the ADX Values: Measuring Trend Strength
As previously noted, the ADX line reveals both the presence and the intensity of a trend. Traders use specific threshold levels to gauge market conditions:
-
Below 20: The price is stuck in a sideways range or “chop zone.” There is no clear trend, and trend-following strategies will likely generate false signals and losses.
-
Between 20 and 40: Once the indicator breaks above the 20 level, a medium-strength trend has officially begun. This is the optimal zone to enter trend-following trades.
-
Above 40: Values breaking above 40 indicate a very strong and powerful market trend, whether it is ascending or descending.
-
Above 50 (Trend Exhaustion): While a reading above 50 shows massive momentum, it also serves as a warning. Often, when the indicator rises above 50, the trend is becoming overextended and is likely to begin fading. As market activity and momentum decrease, the distance between the +DI and -DI lines will start to contract, and the ADX line itself will begin to point downward.
Formulating a Trading Strategy with the ADX
The true power of the ADX system is unleashed when you combine the directional crossover signals (+DI and -DI) with the strength confirmation of the ADX line.
The Bullish Setup (Opening a Long Position)
If the ADX line is rising (ideally crossing above 20), it signals that a trend is actively building. A confirmed signal to open a long (buy) position occurs when the +DI line crosses from below to above the -DI line.
Risk Management for Longs: To protect your capital, place a stop-loss order just below the minimum (low) of the specific candlestick where the crossover took place. As the trade progresses, monitor the ADX line. When the ADX line stops rising and begins to hook downward, it signifies that the current uptrend is weakening, meaning it is time to take profits and close the position.
Practical Example: Long Position Imagine you are trading the EUR/USD currency pair on a 4-hour chart. The market has been moving sideways, and the ADX is resting at 15. Suddenly, positive economic news is released. The +DI violently crosses above the -DI line. Simultaneously, the ADX line begins pointing upward and crosses the 20 threshold, confirming a new uptrend. You buy EUR/USD at 1.0850. You place your stop-loss at 1.0820 (the low of the crossover candle). The pair rallies to 1.0950, pushing the ADX up to 45. The next day, the ADX line hooks downward to 42. You immediately close your position, securing a 100-pip profit before the market reverses.
The Bearish Setup (Opening a Short Position)
When a trend loses steam and the ADX falls, the +DI and -DI lines will naturally converge and move closer to each other. A signal to open a short (sell) position arises when the ADX line pivots and begins to rise again, specifically while the -DI line is positioned above the +DI line.
Risk Management for Shorts: In this scenario, place your protective stop-loss order just above the maximum (high) of the candlestick where the bearish crossover occurred. Once again, the moment to exit the trade and lock in your profits comes when the ADX line begins to decline, indicating that the bearish momentum is fading.
Practical Example: Short Position You are analyzing Apple (AAPL) stock on a daily chart. The stock recently hit an all-time high but has started to drop. You notice the -DI line crosses above the +DI line, suggesting sellers are taking over. However, you wait for confirmation. Two days later, the ADX line curves upward, breaking through the 25 level. This confirms the downtrend has genuine strength. You short the stock at $180, placing a stop-loss at $185 (the recent high). The stock plunges to $160 over the next few weeks. When the ADX line reaches 55 and begins to slope downwards, you recognize the bearish momentum is exhausted. You cover your short position, securing a $20 per share profit.
Setting Up the Indicator on Your Trading Platform
Adding the ADX to your charts is a simple process on almost all modern trading terminals, including cTrader and MetaTrader.
-
Navigate to the top toolbar of your trading platform.
-
Locate the Indicators icon (usually represented by an f(x) symbol or a dedicated chart button).
-
Hover your mouse over the icon to open the dropdown menu.
-
Move your cursor down to the Trend category.
-
From the expanded list, select Average Directional Movement Index Rating.
-
The indicator will now appear in a separate window at the bottom of your screen, displaying the ADX, +DI, and -DI lines.

Comments
No comments yet. Be the first to share your thoughts!
Authentication Required
You must be logged in to post a comment.