

Nonfarm Payrolls Trading Strategy
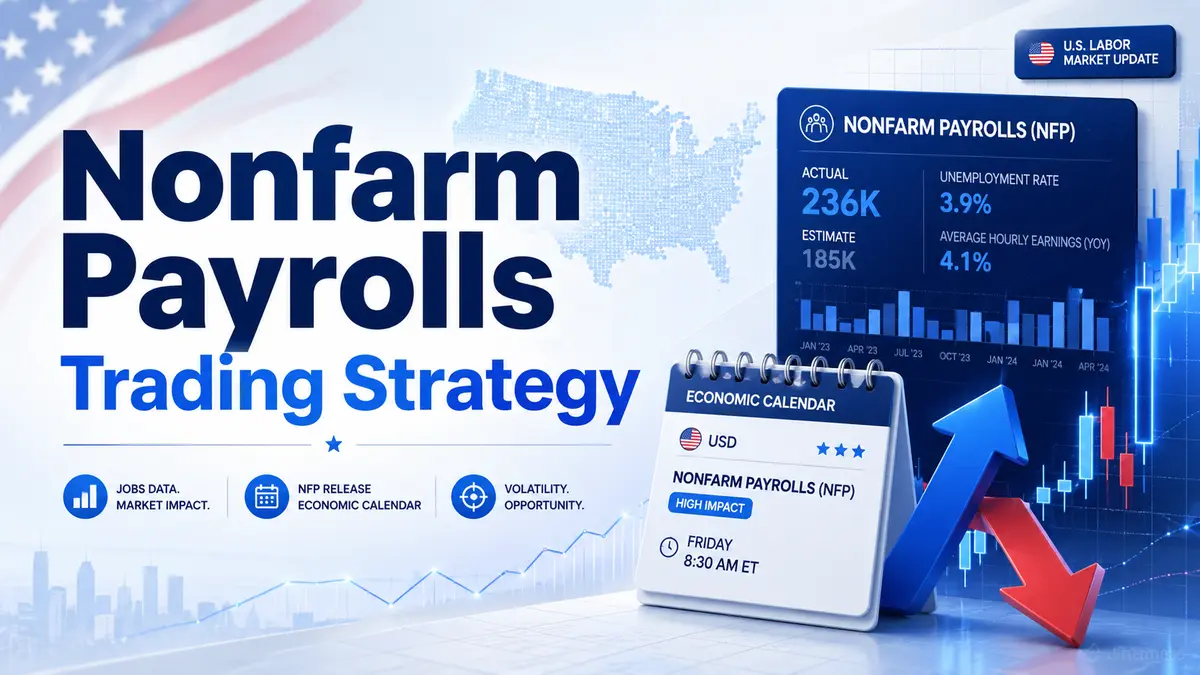
In this lesson, we are going to break down a specific trading strategy designed for the Nonfarm Payrolls (NFP) data release. This indicator is published on the first Friday of every month, triggering explosive price movements across global charts.
What is Nonfarm Payrolls (NFP)?
The term originates from the “Nonfarm Employment Change” report. This crucial economic indicator reflects the health of the United States labor market by measuring how many new jobs were created during the previous month, specifically excluding the agricultural sector. When the report drops, investors immediately evaluate the difference between forecasted expectations and the actual data.
Here are the core characteristics of the NFP report:
-
High Importance: It ranks second only to Gross Domestic Product (GDP) in economic significance and always carries a “High Volatility” impact rating in economic calendars.
-
Fixed Schedule: The report is released every first Friday of the month at 13:30 UTC / 08:30 EST (exact local times can vary depending on regional daylight saving time adjustments).
-
Market Disruption: The immediate aftermath of the release sees massive price spikes. These swings frequently break standard technical analysis (TA) models, violate automated trading algorithms, and rapidly reverse prevailing currency trends.
How to Navigate the NFP Release
Standard trading approaches go out the window when NFP drops. Traditional indicators lag heavily during these sudden spikes, and your carefully drawn support and resistance lines might need to be completely scrapped and redrawn.
In fact, experienced traders recommend waiting at least one hour after the initial shock wave to let the market settle and confirm a sustainable new trend.
When trading directly during the release, keep these realities in mind:
-
Lack of Liquidity: Market makers often pull their orders right at the release moment, meaning prices can gap or jump wildly without hitting every price level on the way.
-
Institutional Shift: Institutional heavyweights inject immense amounts of capital to drive trend reversals.
The market frequently explodes by 50 to 150 pips in a matter of seconds. This massive surge often exceeds the entire daily average volatility of a currency pair, effectively freezing standard intraday strategies.
Almost all major financial instruments react heavily to this US data — currency pairs, metals, and even cryptocurrencies. Typical examples include EUR/USD, GBP/USD, and USD/JPY.
The NFP Straddle Strategy
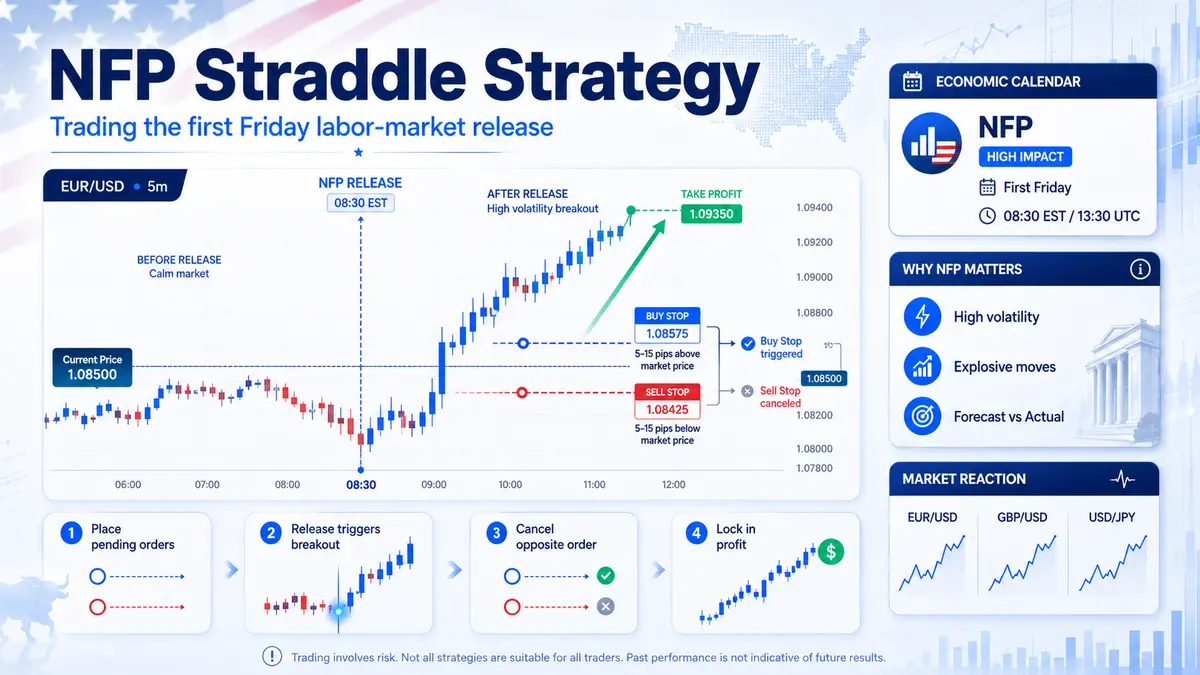
One classic strategy designed to capitalize on this volatility relies on setting pending orders on both sides of the current market price. It is a straightforward approach executed using Buy Stop and Sell Stop orders.
By default, stop orders are executed “at the first available market price” once triggered.
A pending order is an automated instruction to your broker to open or close a position only when the asset hits a specific price that you predefine.
-
Sell Stop: An order used to open a short (sell) position at a price lower than the current market rate. You typically use this if you expect the price to breach a major support line and want to catch the downward momentum automatically.
-
Buy Stop: An order used to open a long (buy) position at a price higher than the current market rate. This is ideal if you anticipate a breakout above a resistance line but cannot be at your screen to execute it manually.
Just minutes before the NFP data goes live, a trader places both a Buy Stop and a Sell Stop at a tight distance from the current price, equipping both with predetermined Take Profit targets. While there are no rigid rules for these distances, traders commonly set the entry triggers roughly 5 to 15 pips away from the current price. Take Profit targets are generally set between 30 to 45 pips from the respective order’s activation price.
Step-by-Step Market Example
Let’s walk through how this workflow plays out on a real chart setup:
-
Preparation: Fifteen minutes before the report dropped, a trader set a Buy Stop and a Sell Stop exactly 10 pips away from the market price. Both orders were configured with a clear Take Profit target set to 154 pips from their entry prices.
-
The Release: The NFP data was released, sparking an aggressive bullish rally. The spiking price instantly triggered the Buy Stop order, opening a long position.
-
Risk Management: The moment the Buy Stop went active, the trader manually canceled the opposing Sell Stop order to prevent double exposure.
-
The Payout: The upward momentum hit the Take Profit target perfectly, locking in a clean 154-pip profit.
Automating the Setup via Scripts
Because executing these manual steps under high-stress conditions can lead to human error, many traders use automated scripts to place these orders instantly across currency pairs or commodities.
When configuring an automated breakout script, you will need to define these key inputs:
-
Lots: The precise position size for the trades.
-
StopLoss: A fixed safety net to cut losses if the market suddenly reverses against you.
-
TakeProfit: The fixed target where your profits are automatically locked in.
-
DistanceSet: How far away from the current market price the orders should be placed.
-
Slippage: The maximum allowable discrepancy between your requested trigger price and the actual execution price.
Default Forex Script Profile
-
Lots = 1.0 // Traded lot size
-
StopLoss = 0 // Fixed stop loss (0 means disabled)
-
TakeProfit = 150 // Fixed take profit target
-
DistanceSet = 50 // Distance from current market price
-
Slippage = 10 // Allowable price slippage
Default Commodities Script Profile (e.g., Gold)
-
Lots = 1.0 // Traded lot size
-
StopLoss = 0 // Fixed stop loss (0 means disabled)
-
TakeProfit = 3000 // Fixed take profit target
-
DistanceSet = 1000 // Distance from current market price
-
Slippage = 10 // Allowable price slippage

Comments
No comments yet. Be the first to share your thoughts!
Authentication Required
You must be logged in to post a comment.