

The Double Top and Double Bottom Patterns

Reversal patterns are a cornerstone of technical analysis, helping traders identify when a prevailing trend is losing momentum and preparing to change direction.
Among the most common and reliable of these are the Double Top and Double Bottom formations.
The Double Top Pattern
The first type of double formation is the Double Top. This bearish reversal pattern materializes after a prolonged and robust upward market movement. Visually resembling the letter “M,” it indicates that bullish momentum is severely waning.
Structure and Market Psychology
Peaks are formed when the price reaches a high level that it struggles to break through, creating a zone of resistance. After the initial attempt to breach this level, the price experiences a minor corrective decline, forming a local low or “neckline.” Following this pullback, the price rallies again to retest the exact same resistance area.
If the price fails to break higher on this second attempt and begins to decline, the Double Top is structurally confirmed. Very often, the second peak is positioned slightly lower than the first one. This is a critical indicator of a looming trend reversal because it demonstrates that buying pressure has practically evaporated, and sellers are taking control. The pattern is officially complete, and a sell signal is generated, only when the price breaks downward through the neckline support.
Trading Example: Double Top
-
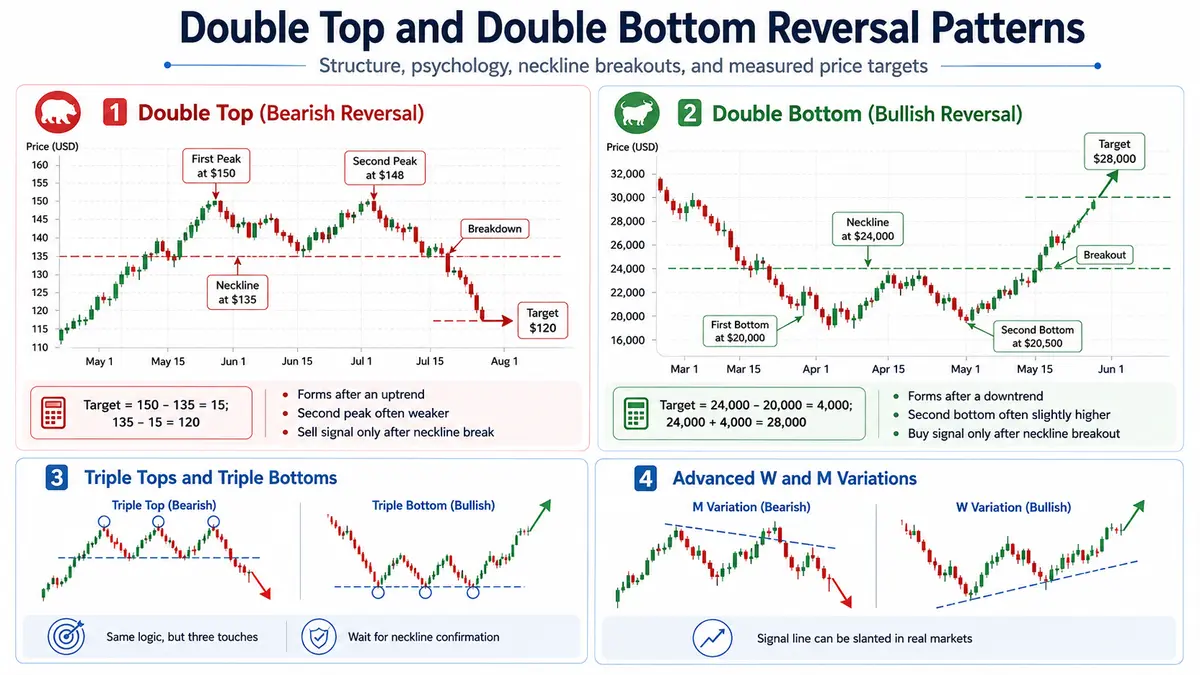
Imagine a stock that has been in a strong uptrend, eventually rallying to $150 (First Peak).
-
Sellers step in to take profits, pushing the price down to a local support level at $135 (The Neckline).
-
Bulls make one final, lower-volume push to resume the trend but stall out at $148 (Second Peak, slightly lower than the first).
-
As the price drops back down and decisively breaks below the $135 neckline, a short entry is triggered. The profit target is determined by measuring the height of the pattern ($150 – $135 = $15) and subtracting it from the breakout point, giving a downside target of $120.
The Double Bottom Pattern
The second type of double formation is the Double Bottom (or double trough).
This pattern is the exact opposite of the Double Top and signals a bullish reversal. It should be anticipated at the tail end of a severe downtrend and visually resembles the letter “W.”
Structure and Market Psychology
The price establishes two distinct troughs as it repeatedly fails to drop below a specific structural support level. Between these two lows, there is a moderate upward bounce that forms a central peak, acting as the neckline resistance.
Ideally, the second bottom will form slightly higher than the first. This higher low is a strong indication that selling pressure has dried up. Bears no longer have the strength or conviction to push the market to new absolute lows. When the price rallies and breaks above the neckline resistance, a powerful buy signal is triggered, accompanied by a calculated price target equal to the height between the support and resistance levels.
Trading Example: Double Bottom
-
A cryptocurrency crashes during a bear market down to a major support level at $20,000 (First Bottom).
-
Value buyers step in, causing a relief bounce up to $24,000 (The Neckline).
-
The price falls again as late sellers exit, but it finds support slightly higher at $20,500 (Second Bottom).
-
When the price surges and breaks above the $24,000 resistance line, a long entry is generated. The measured move ($24,000 – $20,000 = $4,000) projects an upward price target of $28,000.
Triple Tops and Triple Bottoms
Occasionally, markets will form Triple Tops or Triple Bottoms. These patterns operate on the exact same psychological and structural principles as their double counterparts, with the only difference being that they feature three touches of the resistance or support level instead of two.
The analysis remains identical: traders must exercise patience and wait for the price to break the established neckline before entering a position. The added third touch often makes the subsequent breakout even more explosive, as the support or resistance level has proven to be incredibly stubborn, building up significant trapped liquidity.
Advanced Variations: W and M Formations
Important Note: Many authoritative traders and analysts suggest treating patterns as reversal formations even when the levels of adjacent extrema (the peaks in a multiple top or the troughs in a multiple bottom) differ significantly from one another.
For instance, in the renowned book “Bollinger on Bollinger Bands,” author John Bollinger discusses complex W-shaped and M-shaped figures. The primary distinction in these advanced variations lies in how the signal line (neckline) is drawn.
Instead of a strictly horizontal line, the signal line is drawn through the opposite extremum and runs parallel to the trendline connecting the main peaks or troughs.
This slanted approach allows traders to capture dynamic shifts in market momentum earlier and adapt to real-world market conditions, which are rarely perfectly symmetrical.

Comments
No comments yet. Be the first to share your thoughts!
Authentication Required
You must be logged in to post a comment.