Bar Pipa
We pay for a post of 10$

Italy’s Inflation Revision Caught Markets Off Guard

Italy’s Inflation Revision Caught Markets Off Guard
Why One-Tenth of a Percentage Point Became Important for All of Europe

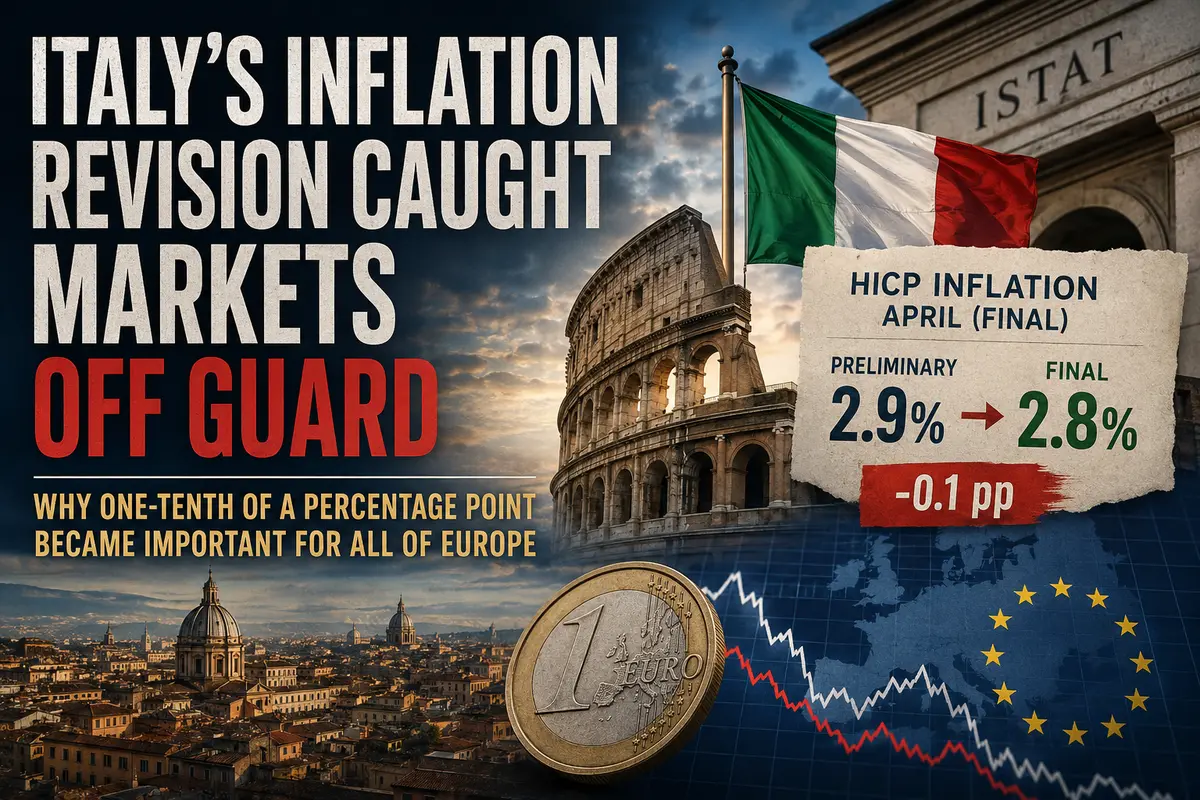
When Italy’s national statistics agency ISTAT released revised inflation data for April on Friday, nothing dramatic seemed to happen at first glance. The preliminary estimate for annual inflation under the harmonized HICP index stood at 2.9 percent, while the final figure came in at 2.8 percent. The difference was just one-tenth of a percentage point. To someone far removed from financial markets, that may look like an accounting detail nobody should care about. But today, it is precisely these “small details” that move bond markets, reshape investor expectations, and force central bankers to study statistical reports line by line.

The modern financial system operates in a state of extreme sensitivity. When the economy is balancing between slowing growth and the threat of a new inflation wave, any deviation from forecasts becomes a signal. Sometimes a single number is enough to sharply alter expectations for interest rates, government bond yields, or the euro exchange rate. That is why the revision of Italy’s inflation data turned out to be far more significant than it initially appeared.

April’s Inflation Surge Looked Too Sharp

The dynamics of April itself look troubling. As recently as March, Italy’s HICP inflation stood at 1.6 percent year-over-year. One month later, it had jumped to 2.8 percent. An increase of 1.2 percentage points in such a short period is not a normal fluctuation — it is a sharp acceleration. And the issue goes beyond the numbers themselves. For Italy, inflation is almost a painful topic because the country’s economy is especially vulnerable to external shocks.

Italy has been living in a state of chronic economic fatigue for years. Formally, it is the eurozone’s third-largest economy, a country with a powerful industrial base, famous global brands, a massive...

Continue reading...
0
0
Tom Maffin

The Swiss Giant Keeps Its Word

The Swiss Giant Keeps Its Word

On Thursday, confirmation arrived from Baar, home to Glencore’s headquarters, of what the market had been expecting since the company released its annual report. Glencore announced that on June 3 shareholders will receive a return of capital of 8.5 cents per ordinary share.

On paper, the figure looks modest. But once multiplied by the billions of shares outstanding, it turns into hundreds of millions of dollars flowing into investor accounts — from London-based funds to South African pension managers.

Formally, the payment still requires shareholder approval at the annual general meeting. In Glencore’s case, though, that is largely procedural. The company typically aligns such decisions with its major shareholders in advance and rarely walks back announced distributions.

There is also an important technical detail: only investors on the Jersey shareholder register at the close of trading on May 8 will qualify for the payment. Jersey is not there by accident. The island has long been part of Glencore’s corporate structure, helping the company navigate different tax and legal regimes.

A Multi-Currency Setup

Glencore operates as a global machine, and its payout structure reflects that. Shareholders can receive the distribution not only in US dollars, but also in pounds sterling, euros, or Swiss francs. Investors who did not submit a currency election by May 11 will automatically receive the payment in dollars.

The company fixed the conversion rates using the average closing exchange rates published by London Stock Exchange Group on May 13. That translates into approximately:

6.29 pence per share;

7.26 euro cents;

6.65 Swiss centimes.

Glencore also disclosed the underlying exchange rates:

GBP/USD — 1.3515;

EUR/USD — 1.1709;

USD/CHF — 0.7826.

For retail investors, this may look like routine disclosure. For institutional holders, however, it is useful operational detail — a quick way to assess how favorable the conversion...

Continue reading...
0
0

The Correlation Between the Dollar and Oil Has Hit a Historic Record Amid War

The Correlation Between the Dollar and Oil Has Hit a Historic Record Amid War
Why the Market Has Entered an Unusual Phase

Until recently, the idea that the US dollar and oil prices could rise almost in perfect sync seemed nearly absurd to most market participants. For decades, the global financial system operated under a different logic: a stronger dollar typically pressured commodities lower, while expensive oil was often associated with a weaker American currency. This relationship was considered one of the market’s unwritten rules.

But the current conflict in the Middle East has not simply disrupted that pattern — it has effectively turned it upside down.

Over the past several weeks, global markets have been pushed into a state of exceptional tension. The military escalation involving Iran and the disruption of critical shipping routes have triggered a serious shock throughout the global energy system. The Strait of Hormuz is not just another point on the map. A massive share of the world’s oil exports passes through this narrow corridor. Any threat to navigation in the region immediately alarms investors because they understand that the consequences extend far beyond a local conflict.

Oil Prices Are Rising on Fears of Supply Shortages

Against this backdrop, Brent crude prices have surged dramatically. A nearly 45% increase in just a few months is no ordinary market fluctuation — it is the kind of move typically seen during periods of global crisis.

What makes this rally especially important is that oil is not climbing because the global economy suddenly needs more energy. In fact, many economies are slowing down. The main driver is fear — fear that physical supply could become severely constrained.

Whenever traders believe that oil flows may be disrupted, prices begin to include a “risk premium.” The higher the probability of further escalation, the larger that premium becomes. As a result, oil prices are currently...

Continue reading...
0
0

Four Days of Decline: Gold Loses Its Shine

Four Days of Decline: Gold Loses Its Shine

Gold ended the week deep in the red on Friday. It marked the fourth consecutive losing session — a stretch the precious metals market has not seen in quite some time. Spot prices slipped another 0.7% and hovered near $4,620 per ounce in early trading. Futures performed even worse, plunging 1.3% to around $4,624. Looking at the week as a whole, the picture is grim for the bulls: gold lost roughly 2% over five trading days.

For an asset traditionally viewed as a safe haven, this behavior looks unusual. But that very unusualness is the story. Gold is currently trapped between two grinding forces: a strengthening U.S. dollar on one side and shifting expectations around Federal Reserve interest rates on the other. As long as those forces continue turning, the metal keeps sliding lower despite the geopolitical fears that would normally send it soaring.

The Dollar Flexes Its Muscles

The U.S. Dollar Index gained another 0.3% during Asian trading on Friday, climbing to a two-week high. For the week, the greenback was on track to rise more than 1% — a sharp reversal after months of speculation that the dollar was losing its dominance amid budget concerns and political instability in the United States.

But economic data released throughout the week shattered those bearish narratives. One report after another exceeded analyst expectations. Producer prices in April posted their strongest annual increase in four years. Four years is a long time in economic terms — enough for supply chains, consumer behavior, and entire market structures to change dramatically. Consumer inflation also came in hotter than expected, while retail sales painted a picture of an American consumer who continues spending despite expensive energy and broad uncertainty.

Under different circumstances, this combination of data might have fueled a rally in equities and perhaps...

Continue reading...
0
0

Asian Currencies Slide; Indian Rupee Hits Record Low

Asian Currencies Slide; Indian Rupee Hits Record Low
Asian currencies head for weekly losses

Asian currencies once again came under heavy pressure, and the current situation can no longer be described as an ordinary short-term correction. The market environment is developing in such a way that the U.S. dollar is receiving support from several directions at once: strong economic data from the United States, rising Treasury yields, expectations of a hawkish Federal Reserve stance, and growing nervousness across global markets. Against this backdrop, emerging Asian currencies are losing stability, while some — such as the Indian rupee — are falling to historic lows.

The rupee is especially symbolic in this situation. For India, an exchange rate approaching 96 rupees per dollar is not just an unpleasant figure on a currency screen. It reflects several deep structural problems at once: expensive oil, dependence on foreign capital, and growing pressure on the country’s trade balance. India imports enormous volumes of energy resources, and when oil prices surge, the economy begins burning through foreign exchange reserves much faster than usual. The higher oil climbs, the more dollars are needed for imports. And if foreign investors simultaneously begin pulling money out of Indian markets, pressure on the national currency intensifies dramatically.

That is exactly the combination now unfolding. Rising tensions in the Middle East have increased fears of disruptions in the Strait of Hormuz — one of the world’s most important energy transit routes. Any threat to supply immediately pushes oil prices higher. For exporting nations this can be beneficial, but for major importers such as India, South Korea, and Japan, it becomes a serious economic burden.

However, oil is only part of the story. The main driver behind the dollar’s strength is still the United States. The American economy continues to show remarkable resilience despite years of elevated interest rates. Markets...

Continue reading...
0
0
Lin Brings

Payments No One Sees: How Coinbase Is Building Financial Infrastructure for Machines

Payments No One Sees: How Coinbase Is Building Financial Infrastructure for Machines

Imagine a world where software pays software. Not people sending money to people, not a human buying a subscription to a service, but one line of code automatically settling with another line of code in a fraction of a second and for a fraction of a cent. It sounds like science fiction, but this is exactly the reality Coinbase is building right now through the x402 protocol. And the protocol’s latest upgrade — the introduction of batch settlements — brings that science fiction closer than ever to the everyday workflow of thousands of developers.

Why is this even necessary? The answer lies in the nature of artificial intelligence. Modern AI agents are resource-hungry creatures. They constantly need access to models, computing power, API calls to databases, and information from external sources. And all of that costs money. When there are hundreds or thousands of such operations per hour, and each one costs mere fractions of a cent, the traditional blockchain economy — with fees attached to every transaction — becomes pointless. Sending an on-chain transaction that costs a dollar just to pay one-tenth of a cent is absurd. That is exactly the absurdity this new solution eliminates.

Batch Settlements: Mathematics for the Microworld

The mechanism implemented by x402 is elegant in its simplicity. Instead of pushing every tiny transaction through the blockchain, the system bundles many small payments into a single package and settles the final balance with one transaction. It’s similar to how a restaurant doesn’t run to the bank after every cup of coffee sold but deposits the day’s revenue in one payment at the end of the day.

Technically, it works like this. The buyer — an AI agent or service that needs resources — first places ERC-20 tokens into an on-chain escrow. This acts as a...

Continue reading...
0
0
Tom Maffin

Half a Billion in the Red: A Number That Cannot Be Hidden

Half a Billion in the Red: A Number That Cannot Be Hidden

The first quarter ended for Forward Industries in a way no shareholder would wish to see. The company, proudly calling itself the world’s largest corporate holder of Solana, reported a net loss of $585.6 million. Nearly six hundred million dollars. This is not an accounting abstraction or a paper entry — it is real blood draining from the balance sheet, impossible to disguise with optimistic press releases about a brighter future.

And the bad news does not stop there. The loss recorded in the financial statements reflects only part of the picture. There is also what accountants call an unrealized loss — paper-based, perhaps, but no less painful because of it. And here the numbers become outright catastrophic. Today, the gap between what Forward paid for its tokens and what they are worth now has reached almost one billion dollars. $983 million — just shy of a round and terrifying figure, but the essence remains unchanged. The company is sitting on losses the size of a small nation’s budget, while the market watches with the cold curiosity of an anatomist.

Let’s break down the arithmetic, because it is brutally simple. At the beginning of the year, Forward held nearly seven million Solana tokens — precisely 6.98 million. The company bought them at an average price of $232.08 each. Today, the market price hovers around $91.24. A simple multiplication reveals the outcome: the position’s total valuation has shrunk to $636.9 million. They bought high, now they hold and hope for a miracle — and so far, the miracle has not arrived.

Solana at $91: How the Bet Collapsed

To understand the scale of the disaster, one must step away from accounting figures for a moment and look at the asset itself. Solana has been one of the brightest blockchain projects of...

Continue reading...
0
0
NorthRay

Buy and Sell: Two Buttons That Control the World (and My Nerves)

Buy and Sell: Two Buttons That Control the World (and My Nerves)

Hi, this is NorthRay.

Remember how in my first post I was afraid to press “New Order”?

I sat there staring at the terminal thinking:
“Should I buy or sell? What if I click the wrong thing? What if I choose incorrectly and get arrested?”

Spoiler: you won’t get arrested.

But back then, those two buttons — Buy and Sell — felt like magic to me. I didn’t understand what they did. I was just clicking randomly.

Then I figured it out.

And now I’ll explain it so simply that even my grandma would understand (she still doesn’t get why I stare at charts all day, but at least now she knows what the buttons mean).

What Buy Means in Simple Terms

Buy means buying. You’re betting that the price will go UP.

Simple example:

Imagine you’re at an apple market.

Today, an apple costs $1.

You think:
“Tomorrow apples will cost $2.”

So you buy an apple now for $1.

Tomorrow the price becomes $2.

You sell the apple. Your profit is $1.

That’s Buy.
You bought cheap and sold expensive.

Trading works the same way:

— You open a Buy trade.
— The price goes up.
— You close the trade and keep the difference.

When to press Buy:
When you think the price will rise.

What Sell Means in Simple Terms

Sell means selling. But not the usual kind. Here, you sell something you don’t actually own yet.

Sounds weird? Let me explain.

Simple example:

You’re at the same apple market.

Today, an apple costs $2.

You think:
“Tomorrow apples will drop to $1.”

You don’t have any apples. But the broker says:
“I’ll lend you an apple. Sell it now for $2. Tomorrow, buy a cheaper apple for $1 and return it to me.”

So you...

Continue reading...
0
0

Istanbul, Thursday: The Numbers Everyone Feared

Istanbul, Thursday: The Numbers Everyone Feared

On Thursday in Istanbul, the Central Bank’s quarterly inflation report presentation took place — an event that only a few years ago was a routine bureaucratic procedure, but now feels more like a wartime emergency briefing. Central Bank Governor Fatih Karahan stepped before the press and announced figures that likely made Turkish households reach for a strong cup of tea.

The interim year-end inflation target was raised from 16 percent to 24 percent. In a single stroke — an increase of eight percentage points.

This was not a minor adjustment, a technical clarification, or some statistical footnote that could be blamed on imperfect models. It was an admission that reality has turned out far harsher than even the most pessimistic analysts expected. And the main culprit was identified directly: the war involving Iran and its inflationary consequences, which, according to Karahan, will remain significant in the short term.

The Bank did not hide behind euphemisms or vague references to “geopolitical uncertainty.” The source of the shock was named explicitly.

A Chain of Revisions: 2027, 2028, and Beyond

But the revision did not stop with the current year. Karahan also announced that the Bank had raised its interim target for the end of 2027 from 9 percent to 15 percent. A new benchmark of 9 percent was then set for the end of 2028.

These figures tell an entire story on their own.

The Bank is effectively acknowledging that inflation will remain in double digits for at least another two years. The road downward will be long, painful, and filled with obstacles. Even by the end of 2028 — two and a half years from now — inflation, according to the Central Bank’s own projections, is still expected to stand at 9 percent.

That is not a number any central banker...

Continue reading...
0
0

The Big Twenty-Four: Who Made the List and Why It Matters

The Big Twenty-Four: Who Made the List and Why It Matters

On May 8, asset management company Bitwise — long considered one of the key bridges between cryptocurrencies and traditional finance — published a short but remarkably revealing post on X. Accompanying it was a chart listing the world’s 24 largest financial institutions, each already involved with cryptocurrencies in one way or another. The post read: “Banks and crypto: better together.” Behind that simple phrase may lie the most important institutional story of 2026.

The list spans nearly every imaginable area of crypto activity. Trading, custody, private funds, exchange-traded products, payments, and tokenization — six columns populated by heavyweight names. Bank of America, Goldman Sachs, JPMorgan Chase, BlackRock, Fidelity Investments, HSBC, Deutsche Bank, Citigroup, Visa, and Mastercard — the list reads like the table of contents of a handbook on the global financial elite. Most importantly, these firms are no longer merely observing the crypto market or experimenting with pilot programs. They are integrating crypto infrastructure directly into their core business operations, treating it as an essential component alongside equities trading or bond custody.

Exchange-Traded Products as the Main Gateway

The broadest entry point for institutional investors has become crypto exchange-traded products — the very ETPs that regulators viewed as dangerous and exotic only a few years ago. Today, they are the main highway through which pension funds, insurance companies, wealth managers, and private banks enter the crypto market.

Bank of America now provides clients of Merrill Lynch, its wealth management division, access to spot Bitcoin ETPs. This marks a dramatic shift considering the bank’s previously skeptical stance toward cryptocurrencies. Vanguard, which once famously blocked Bitcoin ETFs and faced a wave of criticism from its own clients, now allows brokerage customers to trade crypto ETPs. It is a silent 180-degree turn driven not by ideology, but by straightforward client demand.

Alongside...

Continue reading...
0
0
Navigation menu
instaforex banner