Bar Pipa
We pay for a post of 10$

Analytics

Nikkei Crashes 4%, Yen Hits 160 & Kioxia Implodes
Nikkei Crashes 4%, Yen Hits 160 & Kioxia Implodes

Monday, 8 June 2026  ·  Tokyo / Sydney Open  

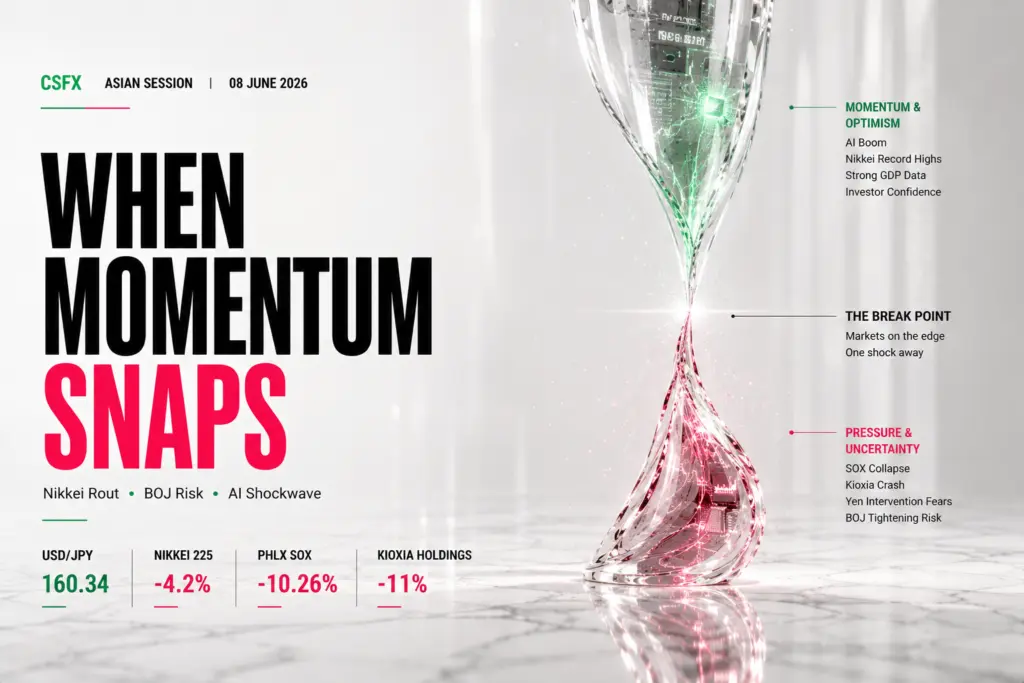
★  SOX -10.26% Friday  ·  USD/JPY 160.34 — BoJ Intervention Zone  ·  Japan Q1 GDP +0.5% Beat  ·  Kioxia -11%  ★

AUD/JPY 113.09  ·  USD/JPY 160.34  ·  Copper $6.30/lb  ·  Nat Gas $3.166  ·  ASX 200 8,522.2  ·  XRP $1.11  ·  Cardano $0.16

Session Prices — Tokyo / Sydney Open, 8 June 2026

Nikkei 225 at 63,791 (▼ -4.20%). ASX 200 at 8,522.2 (▼ -0.49%). USD/JPY at 160.34 (▲ +0.06%). AUD/JPY at 113.09 (▼ -0.34%). Copper HG at $6.30/lb (▼ -0.31%). Natural Gas at $3.166/MMBtu (▼ -1.24%). XRP at $1.11 (▲ +2.63%). Cardano ADA at $0.16 (▼ -2.44%). Gold XAU/USD at $4,312.20 (▼ -1.11%). WTI Crude at $93.70 (▲ +3.40%). Bitcoin at $62,874 (▲ +2.28%).

Session Overview — Three-Way Stress Test

Monday's Asian session has opened under a three-way stress test of historic proportions: the worst Philadelphia Semiconductor Index collapse since March 2020, a yen in its third consecutive session grazing the BoJ's intervention danger zone at 160 per dollar, and stronger-than-expected Japanese GDP data that paradoxically makes Tokyo's equity market more — not less — vulnerable by raising the probability of a BoJ rate hike this month. The result is a Nikkei 225 down nearly 4%, Kioxia Holdings cratering 11%, and a cross-asset risk-off wave reverberating into AUD/JPY, the ASX 200, copper, and crypto simultaneously.

Japan's Q1 2026 GDP expanded at 0.5% quarter-on-quarter, beating the 0.3% consensus — and rising 1.8% year-on-year, surpassing the 1.3% forecast. Growth was driven by firming private consumption gaining 0.3% QoQ and robust external demand. In any other context, this would be unambiguously constructive for Japanese equities. In June 2026, however, it is being read as the final ingredient needed for the Bank of Japan to raise interest rates at its upcoming late-June meeting...
Continue reading...
0
0

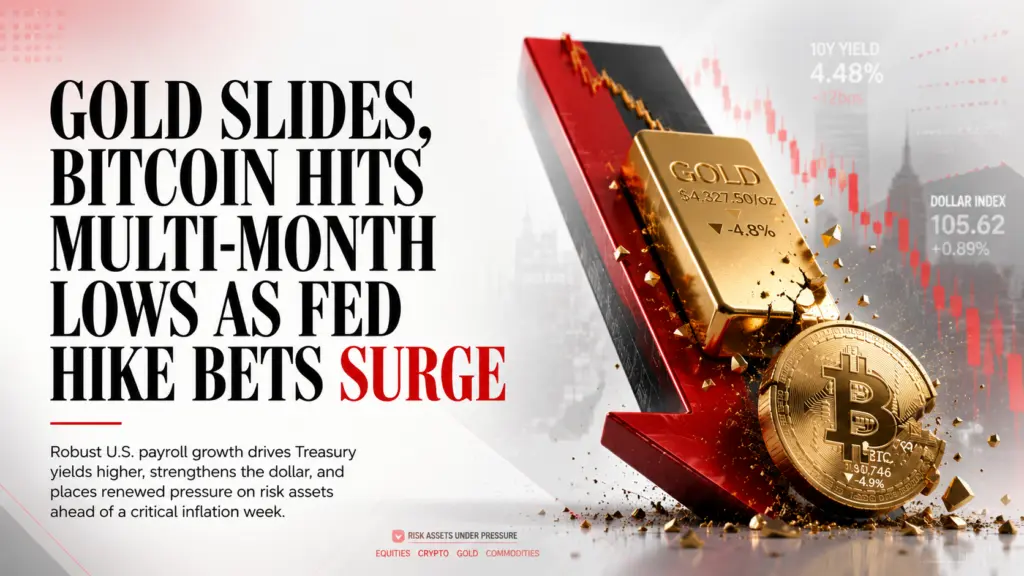
NFP Shock Crushes Gold & Equities, Bitcoin Hits 19-Month Low as Fed Rate Hike Fears Grip US Markets

NFP Shock Crushes Gold & Equities, Bitcoin Hits 19-Month Low as Fed Rate Hike Fears Grip US Markets

Week of 9–13 June 2026  ·  US Session  

★  US CPI Wednesday  ·  Fed Rate Hike Repricing  ·  Hormuz Watch  ·  Bitcoin 19-Month Low  ·  Visa Stablecoin Threat  ★

USD/CAD 1.3939  ·  USD/CHF 0.7960  ·  Gold $4,327.50  ·  WTI $91.77  ·  Dow 50,721.50  ·  Visa $323.57  ·  10Y 4.48%  ·  BTC $60,746  ·  LINK $7.36

Past Week in Review — 2–6 June 2026

The week of 2–6 June 2026 will be remembered as the week the US jobs market reset global rate expectations. Friday's NFP print of 172,000 — more than double the 85,000 consensus — triggered a violent repricing across every major asset class. Gold fell to its lowest since March 2026, the Dow dropped 1.35%, the Nasdaq shed nearly 4%, and the 10-year Treasury yield surged toward the 4.5% barrier that has historically acted as a stress threshold for equities. Bitcoin fell to a near 19-month low of $60,746 as the combination of risk-off selling, a stronger dollar, and renewed regulatory uncertainty around stablecoins created a multi-front bear environment. Chainlink, down 16.9% on the week to $7.36, reflected the broader altcoin de-rating underway.

For FX traders, USD/CAD navigated conflicting signals — a surging dollar from NFP-driven rate hike repricing versus a collapsing WTI crude price, down 2.69% on Friday on Iran ceasefire optimism. USD/CHF broke above 0.7870 on post-NFP dollar strength. Visa's stablecoin headline — confirming joint development of a platform with Stripe and Mastercard — introduced structural disruption risk to the payments incumbent's long-term revenue model. The US 10-year yield climbed 12 basis points on the week to 4.48%, approaching the critical 4.5% threshold that has historically triggered equity multiple compression, gold selloffs, and crypto de-risking. The week closes with every major US asset class positioned around a single fulcrum: Wednesday's US CPI for May.

Weekly...

Continue reading...
0
0

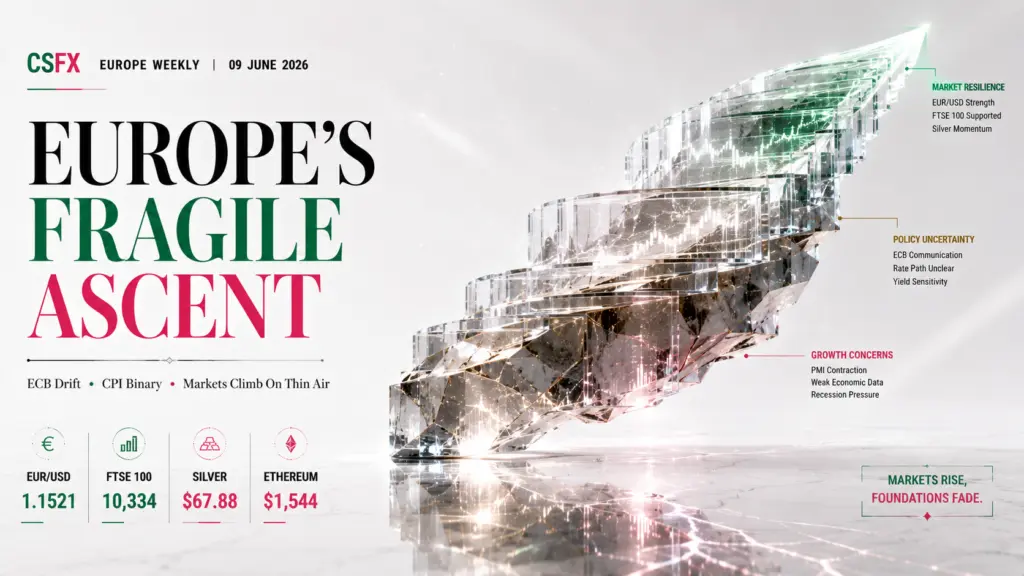
EUR/USD Surges to 1.1521, FTSE 100 Breaks 10,000 & Ethereum Consolidates Above $1,500

EUR/USD Surges to 1.1521, FTSE 100 Breaks 10,000 & Ethereum Consolidates Above $1,500

Week of 9–13 June 2026

★  US CPI Wednesday  ·  BoE Thursday  ·  USDA WASDE Wednesday  ·  LLOY Motor Finance  ·  ECB Rate Watch  ★

EUR/USD 1.1521  ·  GBP/USD 1.3337  ·  Silver $67.88  ·  Corn $417.96/bu  ·  FTSE 100 10,334.3  ·  LLOY 99.15p  ·  EU 10Y 2.84%  ·  ETH $1,544.43  ·  DOGE $0.0796

Past Week in Review — 2–6 June 2026

The European session week of 2–6 June 2026 was defined by a softening macro backdrop across the continent. EUR/USD's surge above 1.1500 — a level that had held for six consecutive weeks — was fuelled by broad USD weakness and market expectations of an ECB pivot. The Eurozone composite PMI fell to 49.6, its first contraction reading in five months, and two prominent ECB board members openly discussed cutting the deposit rate further in Q3, opening the path toward 1.1600 to 1.1650 as the next realistic near-term target.

GBP/USD closed at 1.3337, supported by the Bank of England's hold consensus and USD underperformance. EUR/GBP compressed to 0.8524 as the ECB's dovish drift diverged sharply from the BoE's services-CPI-constrained hawkishness. In equities, the FTSE 100's breakout above 10,000 to 10,334.3 was driven by broad commodity strength, recovering energy stocks, and diversified financials. Lloyds Banking Group surged 69.8% to 99.15p on relief that motor finance provision fears appear more contained than initially feared, approaching the psychologically significant 100p level for the first time in years.

In commodities, corn at $417.96/bu gained 5.80% on the week driven by the USDA's surprise 1.2 million acre reduction in its US corn acreage estimate — the largest single-month revision in four years — bringing the crop to its most bullish fundamental setup in six months. Silver surged 116% from prior year levels to $67.88/oz on broad USD weakness and safe-haven demand. The EU 10-year Bund...

Continue reading...
0
0

USD/JPY Breaches 160, NZD Under RBNZ Hawkish Watch & Global Risk-Off Grips Asia

USD/JPY Breaches 160, NZD Under RBNZ Hawkish Watch & Global Risk-Off Grips Asia

Week of 9–13 June 2026  ·  Asia-Pacific Session

★  EXTREME EVENT RISK WEEK  ·  BoJ Intervention Live  ·  US CPI Wednesday  ·  RBNZ June 15–16  ·  EIA Thursday  ★

USD/JPY 160.24  ·  NZD/USD 0.5796  ·  Copper $6.31/lb  ·  Nat Gas $3.22  ·  Hang Seng 24,680  ·  SOL $60.24  ·  LTC $42.56

Past Week in Review — 2–6 June 2026

The week of 2–6 June 2026 delivered a series of threshold events across every instrument in CSFX's Asia coverage. The dominant development was USD/JPY crossing 160.00 — the level the Bank of Japan has defended twice in the past 14 months — turning intervention from a tail risk into an active event probability. Goldman Sachs' full liquidation of Solana ETF exposure triggered a 5.75% single-week selloff in SOL, resetting institutional sentiment for the Solana ecosystem. On the commodity side, natural gas's 17.82% monthly surge — driven by Middle East LNG supply disruptions and above-average US temperatures — was only partially reversed by Friday's 3.21% pullback on reduced LNG export volumes. The Hang Seng's four-session losing streak, led by SMIC and Tencent declines, reflects the AI-sector correction on Wall Street feeding directly into Hong Kong's technology-heavy index. Copper declined 4.25% on the week, pulled lower by China demand uncertainty, though the structural electrification thesis remains intact and the dip has brought the price to CSFX's target entry zone. Litecoin was the hardest hit, falling 11.94% through the prior $47 support band and into the $40–$44 demand zone where the 2027 pre-halving accumulation thesis now activates.

Weekly closes: USD/JPY at 160.24, breaching the 160.00 BoJ intervention threshold. NZD/USD down 1.93% on the week to 0.5796, pulling back sharply from its 5-week high. Copper down 4.25% to $6.31/lb on softer China industrial data, now 6% below the $6.716 all-time high. Natural gas down 3.21%...

Continue reading...
0
0

NFP Beats Hard, S&P Lifts as Dollar Firms & Bitcoin Slides Below $61K

NFP Beats Hard, S&P Lifts as Dollar Firms & Bitcoin Slides Below $61K

Friday, 5 June 2026  ·  New York Open  ·  Capital Street FX Research Desk

NFP +172K May  ·  Unemployment 4.3%  ·  US 10Y 4.52%  ·  Fed Hike Probability 85%

Fed Funds 5.25%  ·  CPI Apr 3.4%  ·  Next FOMC Jun 17–18  

Session Prices — New York Session, 5 June 2026

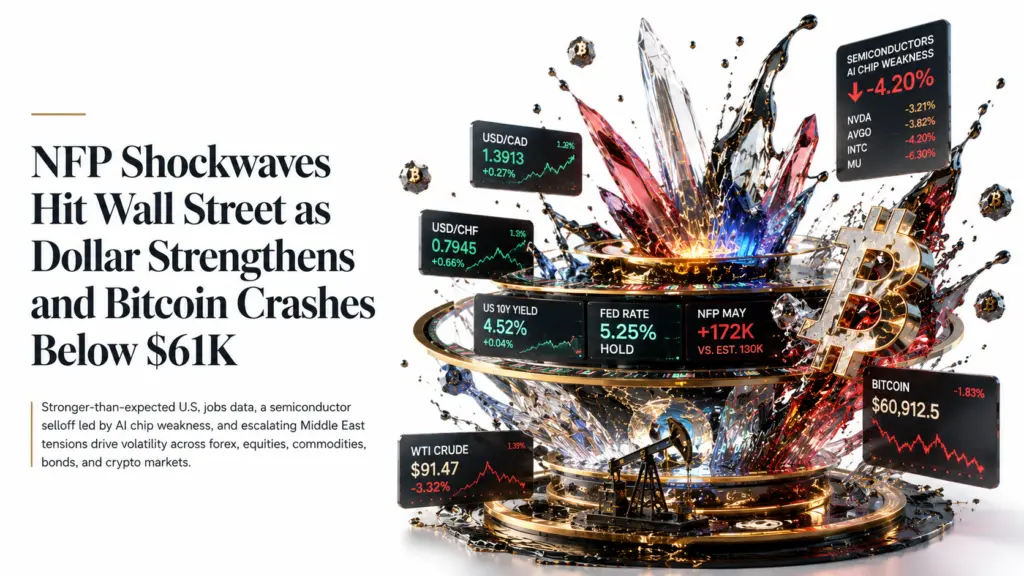
S&P 500 at 7,550.5 (+0.59%). Nasdaq Composite at 39,432 (+0.61%). Dow Jones at 51,448 (+0.99%). USD/CAD at 1.3913 (+0.27%). USD/CHF at 0.7945 (+0.66%). US 10-year Treasury yield at 4.52% (+0.04%). WTI Crude at $91.47 (-3.32%). Gold XAU/USD at $4,348.10 (-2.58%). Wheat CBOT July at 608.75¢/bu (-0.29%). Bitcoin at $60,912.5 (-1.83%). Cardano ADA at $0.1604 (-2.10%). Intel at $107.31 (-4.20%). VIX at 16.52.

The NFP Story — Three Crossfires at Once

Friday's New York session opened into a market already shaken by three simultaneous stress tests: a stronger-than-expected NFP print, a sector-crushing selloff in semiconductor stocks triggered by Broadcom's AI chip outlook, and a crypto market that has shed more than 14% across seven consecutive sessions. The Federal Reserve's rate path is the thread binding them all — and today's jobs data just made the June 17-18 FOMC meeting materially more hawkish in character.

May's non-farm payroll report delivered 172,000 new jobs, firmly beating the consensus estimate of 130,000 and following an upward revision of April to 214,000. The unemployment rate held at 4.3%. Gains were led by leisure and hospitality, local government, and healthcare. Markets now price an 85% probability of at least one 25 basis-point rate hike before year-end, up from 60% a week ago. The 10-year Treasury yield climbed to 4.52% immediately post-release. The NFP result effectively forecloses any near-term Fed cut — the first rate reduction is now pushed to early 2027 in the base case.

The technology sector is experiencing its most severe single-session decline...

Continue reading...
0
0

ECB Eve Jitters, Euro Firms on Inflation Data & CAC 40 Steadies Friday, 5 June 2026 | European Session — London Open | Capital Street FX Research Desk

ECB Eve Jitters, Euro Firms on Inflation Data & CAC 40 Steadies Friday, 5 June 2026 | European Session — London Open | Capital Street FX Research Desk

KEY EVENT: ECB Rate Decision — June 11  |  25bp Hike 90% Priced  |  ECB Deposit Rate 2.00%  |  Euro CPI 3.2% (May, highest since late 2023)

EUR/USD 1.1638  ·  EUR/GBP 0.8644  ·  Lead $2,014.51/T  ·  Corn 420.56¢/bu  ·  CAC 40 8,278.1  ·  AstraZeneca £13,150  ·  EU 20Y 3.48%  ·  USDT $1.0001  ·  BNB/USD $594.5


Session Overview — European Markets

Friday's European session opens with an unusual and defining tension: the euro is firming ahead of a rate hike that is already almost fully priced — a reminder that in modern markets, anticipation can both deliver and disappoint. With the European Central Bank's June 11 decision six days away and May eurozone inflation confirmed at 3.2%, the question is no longer whether the ECB will hike, but how hawkish the guidance will be and what comes next.

The macro backdrop is dense. Eurozone inflation rose to 3.2% in May — its highest reading since late 2023, with core at 2.5% and services inflation surging to 3.5%. These data points have pushed money markets to price a near-certain 25 basis-point hike at the June 11 meeting, lifting the ECB deposit rate from 2.00% to 2.25%, with a second hike priced for September and a third increasingly likely before year-end. ECB Governing Council member Isabel Schnabel on Monday added a hawkish note: it is too early to determine the exact number of rate hikes — a deliberate signal that the ECB is not inclined to front-run market guidance. Bank of Italy Governor Fabio Panetta was equally pointed: the forward-looking picture calls for a recalibration to counter the risk of persistent inflationary tensions.

Beneath the ECB narrative, the geopolitical picture remains the dominant risk overlay. Iran hostilities continue to disrupt oil supply chains and push energy-driven inflation across Europe. A conditional Lebanon...

Continue reading...
0
0
John Madnes

Asian Stocks Fall as Chip Rally Cools

Asian Stocks Fall as Chip Rally Cools

When the Party Ends

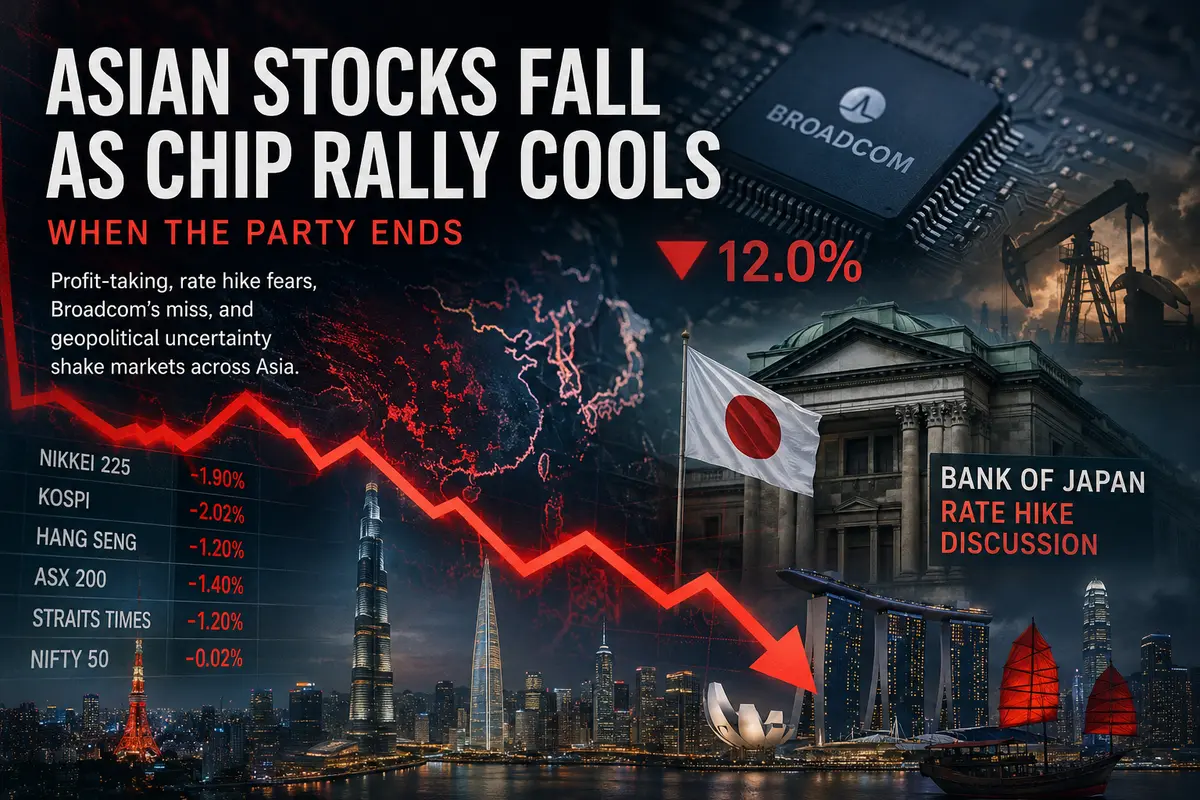
Thursday began with a hangover across Asian equity markets. After several days of record-breaking gains in technology and semiconductor stocks, reality set in. Indexes drifted lower—not in a panic, not in a crash, but steadily enough to leave little doubt: the rally is taking a pause.

Several factors contributed to the shift. The main one is simple exhaustion. After the Nikkei reached a fresh all-time high and South Korea’s KOSPI approached its own peaks, investors decided it was time to take profits—especially against a backdrop of increasingly unsettling news.

There were also more concrete triggers. Comments from the Governor of the Bank of Japan regarding possible interest-rate hikes. Mixed results from Broadcom that weighed on the entire semiconductor sector. Ongoing uncertainty surrounding U.S.-Iran negotiations. Together, these factors created a cocktail that Asian markets found hard to stomach.

S&P 500 futures, which often set the tone for global trading, fell 0.4% in after-hours trading. American investors are taking profits as well. The example is contagious.

Japan: Records Give Way to Losses

The Japanese market, which was celebrating only yesterday, found itself deep in the red today. The Nikkei 225 lost 1.9%, while TOPIX, the broader Tokyo Stock Exchange index, fell 1.4%. These are significant moves—the kind that prompt analysts to revisit their forecasts.

What happened?

First, profit-taking. The Nikkei hit record highs this week, and many investors who bought stocks a month or two ago saw their portfolios rise by 20–30%. The temptation to lock in real gains rather than admire paper profits proved stronger than faith in further upside.

Second—and perhaps more importantly—there were comments from Bank of Japan Governor Kazuo Ueda. Speaking at a seminar on Wednesday, he said something markets were not expecting, at least not yet.

Ueda warned that inflation in Japan could...

Continue reading...
0
0

THE SILENT ORATOR: HOW US TREASURY BONDS AND THE YIELD CURVE DICTATE THE DIRECTION OF EVERY FINANCIAL MARKET — AND WHAT THEY ARE SAYING RIGHT NOW | CAPITAL STREET FX

US 30Y Treasury Yield: 5.025% — first close above 5% since 2007

US 10Y Treasury Yield: 4.463% — elevated on fiscal concerns

US 2Y Treasury Yield: 3.992% — pricing near-term cuts ahead

2Y/10Y Spread: +47bps — re-steepened from record -108bps inversion

10Y TIPS Real Yield: ~2.1% — highest sustained level since 2008

30Y TIPS Real Yield: 2.70% — historically restrictive

DXY Dollar Index: 98.97 — weakening despite elevated rates

USD/JPY: 159.26 — JGB yield approaching 2.70%, 30-year high

EUR/USD: 1.1654 — near 1-year high

GBP/USD: 1.3458 — near 3-day highs

XAU/USD Gold: $4,542 — off all-time high of $5,595, stabilised above $4,500

PCE Inflation: 3.8% YoY, Core 3.3% — fifth year above target

Fed Funds Rate: 4.25-4.50% — zero cuts priced for 2026

Fed Chair: Kevin Warsh — sworn in 22 May 2026, 11th Chair

US National Debt: $36.2 trillion — growing at $1 trillion every ~100 days

Japan Treasury Holdings: ~$1.1 trillion — $220 billion at repatriation risk

Inversion Duration: 803 days — longest ever recorded, now re-steepened

Historical Parallels: 1994 Bond Massacre, 2007 Re-Steepening Trap, 1981 Volcker Peak

INTRODUCTION: A MARKET THAT SPEAKS WITHOUT WORDS

On the afternoon of 29 May 2026, nobody made a speech. Nobody needed to. The US Treasury sold $25 billion in 30-year bonds and the auction cleared at 5.025% — a number that appeared on trading terminals in Tokyo, London, and New York within milliseconds of the hammer falling. No finance minister issued a statement. No central banker stepped to a podium. A single number crossed the wire, and the largest financial market on earth began, without discussion or ceremony, to rearrange itself around it.

The bond market does not hold press conferences. It...

Continue reading...
0
0
Tom Maffin

Invisible Magnets: Where Tuesday’s Option Barriers Could Halt Currency Moves

Invisible Magnets: Where Tuesday’s Option Barriers Could Halt Currency Moves

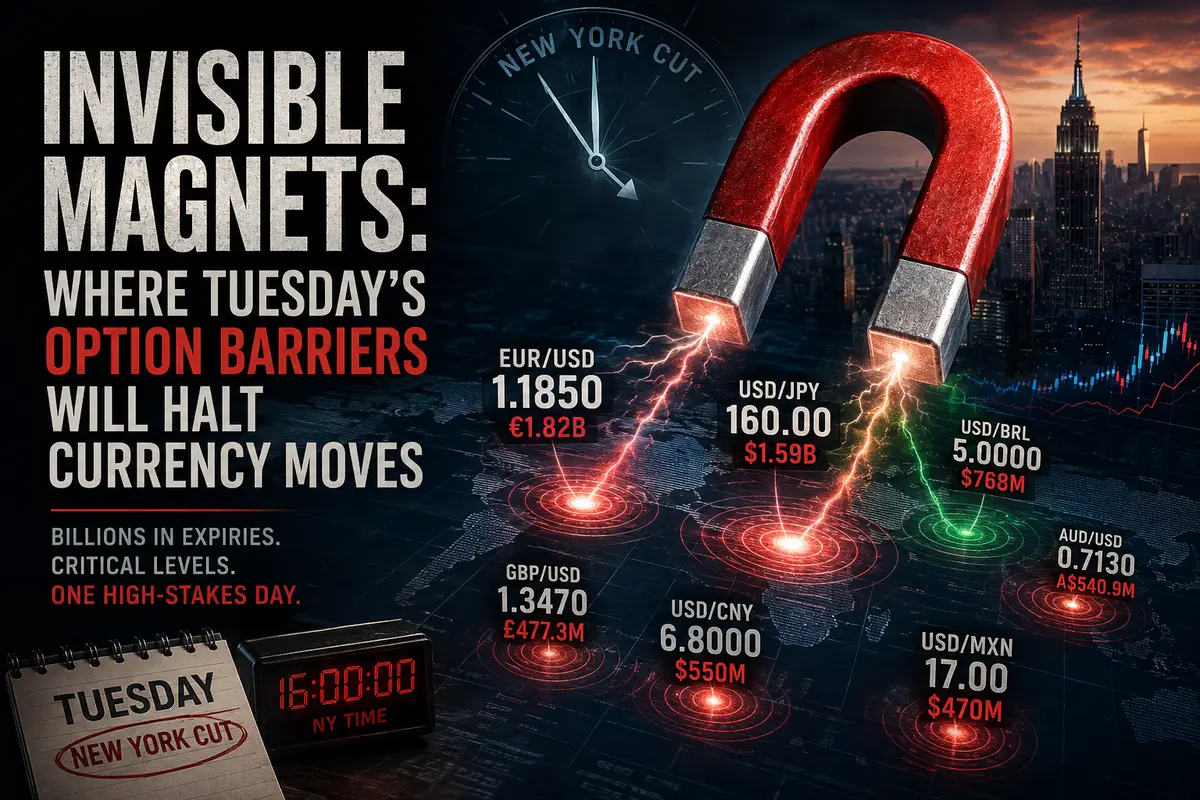
Tuesday’s New York cut. For most people, it’s simply the close of the U.S. trading session. For FX traders, it’s a moment of truth. Options contracts worth billions of dollars are set to expire, and these expiries often exert an almost gravitational pull on spot exchange rates, drawing them toward specific levels. Market makers hedging their positions will do everything possible to keep prices near major strikes. Once the options expire, however, those anchors disappear—and the market may make a sharp move. Let’s look at the key currency pairs and where the traps are set today.

EUR/USD: Nearly €2 Billion at 1.1850

The main magnet for the euro today sits at 1.1850, where options totaling €1.82 billion are due to expire. This is not just a large expiry—it is a gravitational anomaly. The spot rate could be pulled toward this level during the final hours before the New York cut.

Additional anchors include €1.51 billion at 1.1750 and €1.27 billion at 1.1700. Together, these levels create a web of attraction within which the pair may fluctuate. Market makers will actively manage their positions to minimize payouts on expiring contracts. If EUR/USD trades below 1.1850, they may buy euros and push the price higher; if it trades above, they may sell and pull it back toward the strike. This is classic options-related gravity, making sharp moves before expiry less likely.

Notably, an even larger expiry is scheduled for Wednesday: €2.47 billion at 1.1710. This suggests that even after Tuesday’s cut, the market will not gain complete freedom—the next anchor is already waiting.

USD/JPY: 160.00 Is the Red Line

For dollar-yen, the primary magnet is 160.00, where $1.59 billion in options expire. The 160 level is the same red line that triggered large-scale foreign exchange intervention by the...

Continue reading...
0
0
Lin Brings

Oil Calm Before the Storm: WTI Pulls Back, but Tensions Remain High

Oil Calm Before the Storm: WTI Pulls Back, but Tensions Remain High

Friday’s Asian trading session brought a brief respite to the oil market. July WTI futures fell by 1.5%, dropping to $87.56 per barrel. Brent followed its U.S. counterpart lower, losing just over 1% and settling at $91.73 per barrel. At first glance, this looks like a routine correction after the sharp rally triggered by the latest strikes on Iran. But a closer look at the numbers suggests otherwise: this is not merely a pullback—it is a market holding its breath before the next move. Too much explosive risk has accumulated beneath the surface, too many unresolved questions remain, and too much depends on what unfolds over the weekend.

Down 1.5%: Profit-Taking or a Trend Reversal?

Friday’s decline in WTI fits a classic pattern. After Thursday’s surge of more than 3%, fueled by reports of strikes on Bandar Abbas and a retaliatory attack by Iran’s Islamic Revolutionary Guard Corps (IRGC), traders chose to lock in profits ahead of the weekend. Few are willing to hold long positions through Saturday and Sunday when anything could happen—from fresh military strikes to an unexpected diplomatic breakthrough. This fear of the “geopolitical weekend” is a familiar feature of every major Middle Eastern crisis.

Support at $87.27 remains intact. Prices bounced from that level, preventing bears from gaining momentum. This suggests that the underlying fundamentals have not changed: the Strait of Hormuz remains effectively disrupted, supply chains are impaired, and the global oil market remains undersupplied. A decline of 1.5% is not a trend reversal—it is simply a pause after a short sprint.

Resistance at $99.43 looms overhead, separating the current range from the triple-digit prices seen during the hottest phase of the conflict. If tensions continue to escalate, that level could be tested as early as next week. If, against all expectations, there...

Continue reading...
0
0
Navigation menu
instaforex banner