NFP Beats Hard, S&P Lifts as Dollar Firms & Bitcoin Slides Below $61K

Friday, 5 June 2026 · New York Open · Capital Street FX Research Desk
NFP +172K May · Unemployment 4.3% · US 10Y 4.52% · Fed Hike Probability 85%
Fed Funds 5.25% · CPI Apr 3.4% · Next FOMC Jun 17–18
Session Prices — New York Session, 5 June 2026
S&P 500 at 7,550.5 (+0.59%). Nasdaq Composite at 39,432 (+0.61%). Dow Jones at 51,448 (+0.99%). USD/CAD at 1.3913 (+0.27%). USD/CHF at 0.7945 (+0.66%). US 10-year Treasury yield at 4.52% (+0.04%). WTI Crude at $91.47 (-3.32%). Gold XAU/USD at $4,348.10 (-2.58%). Wheat CBOT July at 608.75¢/bu (-0.29%). Bitcoin at $60,912.5 (-1.83%). Cardano ADA at $0.1604 (-2.10%). Intel at $107.31 (-4.20%). VIX at 16.52.
The NFP Story — Three Crossfires at Once
Friday’s New York session opened into a market already shaken by three simultaneous stress tests: a stronger-than-expected NFP print, a sector-crushing selloff in semiconductor stocks triggered by Broadcom’s AI chip outlook, and a crypto market that has shed more than 14% across seven consecutive sessions. The Federal Reserve’s rate path is the thread binding them all — and today’s jobs data just made the June 17-18 FOMC meeting materially more hawkish in character.
May’s non-farm payroll report delivered 172,000 new jobs, firmly beating the consensus estimate of 130,000 and following an upward revision of April to 214,000. The unemployment rate held at 4.3%. Gains were led by leisure and hospitality, local government, and healthcare. Markets now price an 85% probability of at least one 25 basis-point rate hike before year-end, up from 60% a week ago. The 10-year Treasury yield climbed to 4.52% immediately post-release. The NFP result effectively forecloses any near-term Fed cut — the first rate reduction is now pushed to early 2027 in the base case.
The technology sector is experiencing its most severe single-session decline in six weeks. Broadcom’s post-earnings guidance revealed softer-than-expected AI chip demand for its custom ASIC business, triggering a cascade through the entire semiconductor complex. Micron fell 6.3%, Marvell lost 8%, Broadcom itself slipped 3.8%, and Intel is down 4.2% to $107.31 on sector contagion rather than company-specific weakness. The VIX has moved to 16.52 from 14.1 — not yet in fear territory above 20, but directionally uncomfortable.
The Middle East conflict continues to set a floor under energy prices even as oil softened on Trump’s overnight comments that peace negotiations were approaching their final stage. Iranian Foreign Minister Araghchi flatly contradicted this, stating no meaningful progress had been made. Hezbollah separately rejected a US-mediated ceasefire proposal. WTI holds near $91.47 and the geopolitical risk premium remains structurally embedded. Disciplined position-sizing is essential across all asset classes today.
Breaking News — Session Headlines
NFP +172K Smashes Consensus of 130K — Fed Hike Probability Surges to 85%
The Bureau of Labor Statistics reported 172,000 new non-farm jobs in May, well above the consensus forecast of 130,000 and following an upward revision of April to 214,000. Unemployment held at 4.3%. The 10-year yield jumped to 4.52% immediately post-release. Markets now price an 85% probability of a Fed rate hike before year-end, up from 60% a week ago. Any Fed cut is effectively pushed to 2027. The dollar initially firmed but has since pared gains against safe-haven CHF as risk sentiment deteriorated from the tech selloff.
Broadcom AI Chip Guidance Triggers Semiconductor Rout
Broadcom’s post-earnings guidance flagged softer-than-expected demand for its custom ASIC AI chips, cascading through the semiconductor space. Micron fell 6.3%, Marvell lost 8%, Broadcom itself slipped 3.8%, and Intel dropped 4.2% to $107.31 on sector contagion. Nasdaq futures were down 1.25% pre-market. The AI chip rally that powered semiconductors to cycle highs is now undergoing its most severe valuation reassessment since April 2026. This is the dominant intraday driver of US equity weakness.
Iran Peace Talks Stall — Hezbollah Rejects Ceasefire; WTI Holds $91
President Trump stated peace negotiations with Iran were approaching their final stage. Iranian Foreign Minister Araghchi immediately contradicted the claim, saying no meaningful progress had been made. Hezbollah rejected a US-mediated ceasefire between Israel and Lebanon. WTI is at $91.47. Gold holds near $4,348 as safe-haven demand persists. Markets price zero probability of a resolution before the weekend. The Middle East risk premium remains structurally embedded in energy and metals pricing.
Bitcoin Below $62K — Record $4.4B ETF Outflows; Strategy Underwater
Bitcoin has declined to $60,912.5, down 1.83% on the day and 12.4% over the past week. Spot Bitcoin ETFs have recorded $4.4 billion in net outflows across 13 consecutive sessions — the largest withdrawal event in the ETF complex’s history. Strategy, formerly MicroStrategy, holds 843,000 BTC at an average cost of $75,500 and is now more than $14,500 per coin underwater. Strategy already made its first BTC sale since 2022 last week. Cardano fell to $0.1604 after its community voted to cancel the 2026 Singapore Summit. Standard Chartered maintains the low is almost in, citing resilient ETF holdings and likely Strategy buybacks.
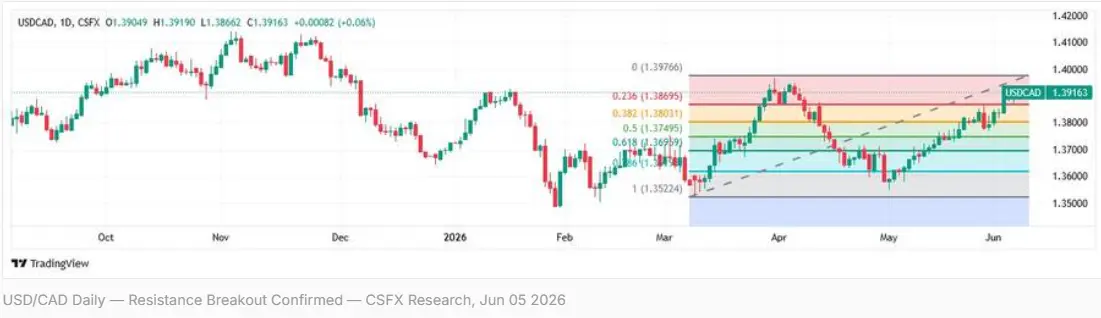
USD/CAD — Strong NFP Meets Oil Weakness and BoC Hold
USD/CAD firmed to 1.3913 on the strong NFP print as dollar demand and oil’s decline weighed on the loonie. Canada’s economy contracted at an annualised rate of 0.1% in Q1 2026, following a revised 1.0% contraction in Q4 2025. Markets broadly expect the Bank of Canada to hold at the June 10 meeting. USD/CAD has broken above the 1.3878 to 1.3916 resistance cluster, with the 1.40 target from April 2026 back in focus.
US 10Y Yield Climbs to 4.52% — Bear Steepener Post-NFP
The US 10-year Treasury yield jumped to 4.52% post-NFP, from 4.48% on Thursday. The yield curve is upward-sloping and steepening: 3M at 3.72%, 2Y at 4.08%, 10Y at 4.52%, 30Y at 4.99% — a bear steepener that typically occurs when markets anticipate persistent inflation and reluctant central bank tightening. Bond holders face meaningful duration risk in this environment.
Foreign Exchange — USD/CAD and USD/CHF
USD/CAD — 1.40 in Sight as Oil Drops and BoC Holds
USD/CAD has broken decisively above the 1.3878 to 1.3916 resistance cluster, trading at 1.3913. The NFP beat and oil’s sharp drop to $91.47 — a double headwind for CAD — delivered the breakout that was pending. With the pair clearing this resistance, the next target is the psychological 1.40 level, last touched in April 2026. Immediate pullback support now sits at 1.3878 — any dip toward this level is a buy opportunity. The contrasting policy backdrop reinforces the bullish USD/CAD case: the Fed is leaning back toward a hike at 85% market probability while the Bank of Canada holds amid a double-dip recession in Q4 2025 and Q1 2026. WTI crude’s drop to $91.47 directly weakens the oil-linked CAD bid. The pair initially pulled back post-NFP in a textbook buy-the-rumour, sell-the-fact move — the structural trend remains upward.
Technical Analysis and Trade Signal — USD/CAD:
Direction: Long USD (Bullish bias)
Entry: 1.3913 — confirmed breakout level; buy on dips
Stop Loss: 1.3860 — below breakout support zone
Take Profit: 1.4000 — psychological target; April 2026 high
Key Risk: BoC June 10 hawkish surprise would sharply strengthen CAD and challenge the setup
USD/CHF — Safe-Haven Franc Overwhelms NFP Dollar Bid
USD/CHF has broken below the key 0.7900 handle as safe-haven demand for the Swiss franc intensifies on the combination of Middle East conflict headlines and the Nasdaq’s semiconductor rout. The pair is approaching the May 26 low at 0.7856 — a break of which opens a run toward the 0.7800 psychological level. The Swiss National Bank has remained in a delicate position: Switzerland’s ultra-low inflation means CHF strength is less threatening than in prior cycles, allowing the franc to strengthen on geopolitical safe-haven demand without forcing SNB intervention. With the Middle East situation unresolved and Hezbollah rejecting ceasefire proposals, risk-off flows into CHF have structural momentum for the remainder of the session. The NFP beat initially supported USD/CHF, but risk sentiment deterioration from the tech rout has overwhelmed the dollar bid, confirming that safe-haven demand is the dominant driver today.
Technical Analysis and Trade Signal — USD/CHF:
Direction: Short USD / Long CHF (Bearish USD bias)
Entry: 0.7920 — sell into resistance after failed NFP bid
Stop Loss: 0.7970 — above key resistance; bull reclaim level
Take Profit: 0.7856 — May 26 low; psychological target zone
Key Risk: Any Iran ceasefire headline would rapidly reduce CHF safe-haven flows; hard stop essential
Commodities — Gold and Wheat
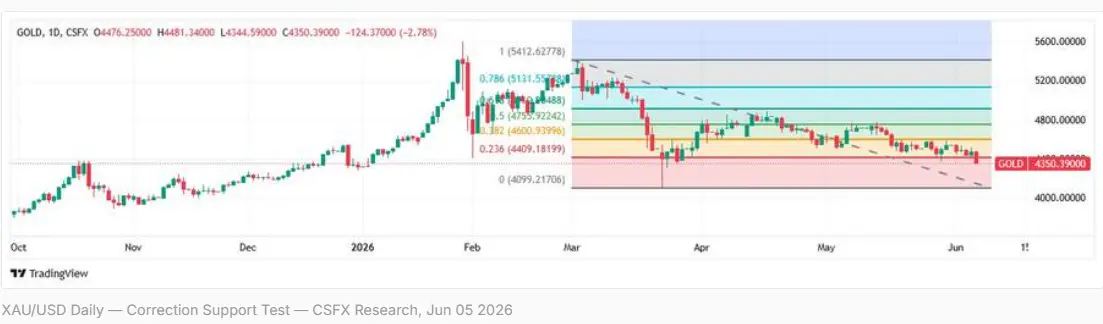
Gold XAU/USD — Record Demand Underpins; NFP Is a Near-Term Headwind
Gold remains in a corrective phase from its January 28 all-time high of $5,602, down approximately 20% at current levels near $4,348. However, the pace of decline has slowed materially as buyers defend the $4,376 to $4,450 support band. Gold’s weekly decline of over 2% reflects dual headwinds: a strong NFP print that strengthens the dollar and reduces safe-haven urgency, and Middle East uncertainty that paradoxically creates two-way risk — de-escalation would accelerate gold’s decline while escalation supports it. The structural demand narrative remains intact — Q1 2026 global gold demand hit 1,231 tonnes, the highest January-March figure on record, with private investors buying 397.7 tonnes, up 50% year-on-year. However, a Fed that is now leaning toward hiking rather than cutting eliminates the key 2026 bull thesis of lower real rates, creating a meaningful near-term headwind. The strategy: accumulate gold on weakness into the $4,376 to $4,430 zone for a medium-term recovery toward $4,600 to $4,750 when Middle East tensions ease. Do not aggressively chase the downside — the structural demand floor is too close.
Technical Analysis and Trade Signal — Gold XAU/USD:
Direction: Buy Dip (Tactical Long)
Entry: $4,430 — buy pullback into structural support zone
Stop Loss: $4,376 — below key support band; structural damage signal
Take Profit: $4,510 — near-term resistance; range top
Key Risk: Sustained hawkish Fed repricing and strong dollar are the dominant headwinds; do not chase the downside
Wheat ZW July — Supply Bear Thesis Intact Despite Short-Cover Bounce
CBOT July wheat is trading at 608.75¢/bu, bouncing from session lows near 587¢. The bounce is short-covering rather than a structural reversal: price remains well below the June swing high of 660¢ and the SRW wheat complex trades below its downward-sloping moving averages. The seasonal pattern underlines the bear case — wheat typically hits seasonal lows in June-July as northern hemisphere harvest pressure builds. Three converging supply-side pressures drive the wheat bear case. First, Russia’s IKAR institute raised its 2026 wheat output estimate to 91.5 million metric tonnes with exports seen at 47.5 MMT for 2026-27. Second, China refused to endorse the Trump administration’s claim that it would buy at least $17 billion annually in US agricultural products, undermining the May 660¢ rally — Beijing stated only a guiding target exists, not a firm commitment. Third, favourable weather across US winter wheat regions and recent Australian rainfall have boosted yield expectations. The conventional argument that elevated oil prices support wheat via ethanol demand is overwhelmed by the supply narrative. Short wheat into rallies toward the 615 to 620¢ zone.
Technical Analysis and Trade Signal — Wheat ZW July:
Direction: Short (Sell the Bounce)
Entry: 615¢ — sell into extended short-cover rally; prior support zone
Stop Loss: 632¢ — above structural resistance; bear thesis broken
Take Profit: 581¢ — prior session low / contract support zone
Key Risk: Weather shock (drought, early frost) would rapidly reverse this trade; monitor USDA crop reports
Equities — S&P 500 and Intel
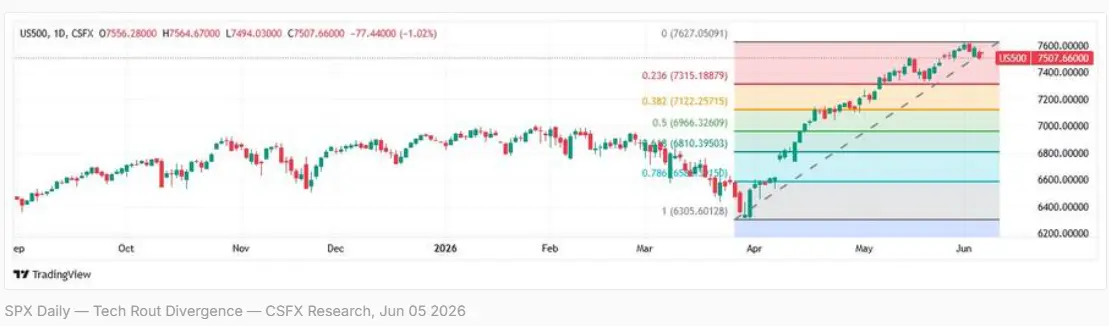
S&P 500 — Bifurcated Market; Tech Rout Meets Value Rotation
The S&P 500 is navigating a bifurcated session: the value-oriented Dow at +0.99% and the small-cap Russell 2000 at +1.45% are holding up, while the technology-heavy Nasdaq at +0.61% masks the severity of the semiconductor selloff dragging quality-adjusted index performance. The index trades at 7,550.5, up 0.59% but with the VIX at 16.52, up sharply from yesterday’s 14.1 — not yet in fear territory above 20, but directionally uncomfortable. Key near-term support sits at 7,420, the May 31 closing level before the S&P 500 record run; a close below would be technically significant. Resistance sits at the June 2 intraday high of 7,600. Today’s equity market navigates three simultaneous negatives: the Broadcom-induced semiconductor selloff spreading via sector correlation into the broader Nasdaq; the NFP beat that strengthens the case for higher-for-longer rates, reducing equity valuations via discount rate expansion; and the Middle East conflict premium keeping energy costs elevated and compressing corporate margins. The Russell 2000’s strength signals capital rotation from growth-tech into domestically-oriented value — a classic strong-economy-but-higher-rates regime shift. The playbook: reduce tech overweights on any NFP-driven bounce, add selectively to financials and healthcare.
Technical Analysis and Trade Signal — S&P 500:
Direction: Sell Bounce (Tactical Short)
Entry: 7,555 — sell any NFP-driven bounce near resistance
Stop Loss: 7,610 — above June 2 intraday high
Take Profit: 7,420 — May 31 closing support level
Key Risk: Value rotation into financials and healthcare could sustain index; discriminate by sector rather than shorting blindly
Intel INTC — Sector Contagion Creates a Buy-the-Dip Opportunity
Intel is down 4.2% to $107.31 on sector contagion from Broadcom’s AI chip guidance miss — a decline that is unambiguously sector-driven rather than company-specific. Intel’s own May 11 all-time high of $132.75 is the new 52-week ceiling, and the current $107 level is approximately 19% below that ATH. The $103.50 zone is critical support; a breach below opens a retest of $96, the April support level. Volume at 1.96 million shares versus a daily average of 111 million suggests institutional spread-driven selling, not retail panic. Intel’s turnaround under CEO Lip-Bu Tan remains structurally compelling: the CPU-as-AI-orchestration thesis, the 18A process node tracking ahead of plan, a $3.3 billion substrate plant in India announced June 1, and a Foxconn AI infrastructure development partnership. Q1 2026 revenue was $52.85 billion on a full-year basis. The 459% gain from the May 2025 low of $19.55 means the 143x forward P/E multiple is stretched — valuation risk is the legitimate bear case, not the AI thesis itself. Buy below $104 for a swing trade toward $122, which represents a return to pre-Broadcom-selloff levels.
Technical Analysis and Trade Signal — Intel INTC:
Direction: Buy Dip (Swing Trade)
Entry: $103.50 — buy at session support on sector contagion
Stop Loss: $96.00 — below April structural support; thesis broken
Take Profit: $122.00 — pre-Broadcom selloff level; swing target
Key Risk: Valuation at 143x forward P/E is stretched; sector sentiment is the short-term swing factor. Q2 earnings in late July is the next re-rating catalyst
Fixed Income — US 10-Year Treasury
US 10Y — Bear Steepener Confirmed; Target 4.70% Ahead of FOMC
The US yield curve is upward-sloping and steepening: 3M at 3.72%, 2Y at 4.08%, 10Y at 4.52%, 30Y at 4.99%. This is a bear steepener — long-end yields rising faster than short-end — which typically occurs when markets anticipate persistent inflation and reluctant central bank tightening. Three forces are driving yields higher. First, labour market resilience: the NFP beat and JOLTS data showing job openings at their highest since November 2024 confirm the economy has not yet cooled enough for the Fed to pivot. Second, sticky inflation: CPI remains at 3.4% against the Fed’s 2% target, with Middle East-driven energy costs keeping the inflation floor elevated. Third, fiscal risk: the expanding US deficit-to-GDP ratio requires ever-larger Treasury issuances that pressure long-end yields. The tactical trade is short Treasuries — via TLT or ZN futures — targeting a yield move toward 4.70% by the June 17-18 FOMC. If the Fed delivers hawkish language, the 30-year could approach 5.25%. Reduce size ahead of the weekend given geopolitical binary risk.
Technical Analysis and Trade Signal — US 10Y Treasury:
Direction: Short Treasuries / Long Yields (Bearish Duration)
Entry: 4.52% yield — short bond price at current levels
Stop Loss: 4.30% yield — below key yield support; cover short
Take Profit: 4.70% yield — pre-FOMC hawkish repricing target
Key Risk: Any geopolitical peace deal would trigger a flight-to-safety bond rally; reduce size into the weekend
Digital Assets — Bitcoin and Cardano
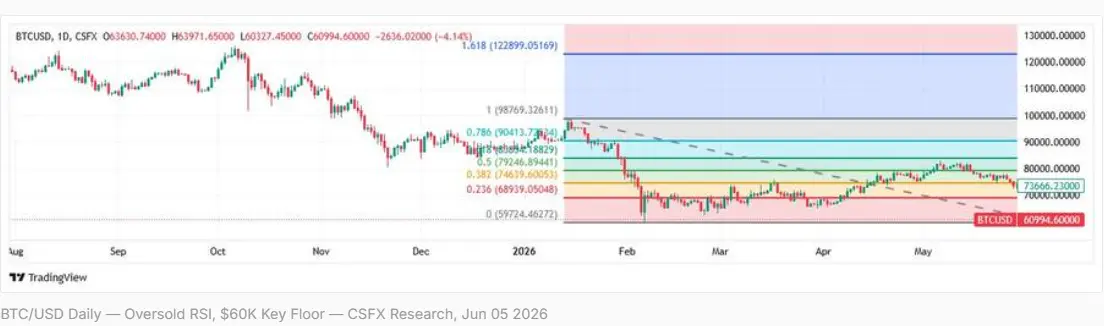
Bitcoin BTC/USD — $60K Floor Is Everything; Standard Chartered Sees Bottom Near
Bitcoin opened at $63,812 on Friday and has fallen to $60,912.5 as of the New York open, down 1.83% on the day and 14.2% on the week — more than 51% below its October 2025 all-time high of $126,200. The RSI on daily and weekly timeframes is deeply oversold, which has historically preceded relief bounces as selling pressure exhausts. Immediate defence: $62,000, matching today’s session low. Below $62,000, the major psychological floor is $60,000; a clean break opens the door toward the $55,000 region. Reclaiming $64,000 is the first step toward reversing the structure; only a daily close above $68,000 would signal the bearish structure is genuinely breaking. Five compounding forces are driving the selldown: the NFP beat strengthening the dollar and raising real rates; spot Bitcoin ETF outflows of $4.4 billion across 13 consecutive sessions — the largest in ETF era history; Strategy’s first bitcoin sale since 2022, symbolically cracking the never-sell policy pillar with $2.5 million in sales; geopolitical risk-off from the Middle East; and Hezbollah’s rejection of ceasefire proposals eliminating any weekend de-escalation catalyst. Standard Chartered maintains the low is almost in, citing resilient ETF holdings and likely Strategy buybacks — a contrarian but well-grounded view for medium-term investors.
Technical Analysis and Trade Signal — Bitcoin BTC/USD:
Direction: Tactical Buy Near $60K Floor (Near-Term Bearish, Medium-Term Contrarian Long)
Entry: $60,500 — tactical long near psychological $60,000 floor
Stop Loss: $55,000 — hard stop; structural breakdown level
Take Profit: $68,000 — first resistance; mean-reversion target
Key Risk: ETF outflow pressure is structural and ongoing; this is a tactical bounce trade, not a trend reversal. The stop at $55K must be hard
Cardano ADA/USD — Summit Cancelled; Van Rossem Hard Fork June 30 Is the Catalyst
Cardano is trading at $0.1604, down 2.1% on the day and 7.84% on the week, remaining 94% below its September 2021 all-time high of $3.10. ADA faces a dual negative catalyst: the broad crypto risk-off that drags altcoins lower with amplified beta, and a governance-specific shock — the community voted to cancel the flagship 2026 Singapore Summit by rejecting a 7.8 million ADA treasury proposal that fell 1.46 percentage points short of the two-thirds threshold required. Key technical support sits at $0.165; resistance at $0.220 is the near-term hurdle. The weekly bullish engulfing pattern that formed in early May has now been fully reversed by the June selloff. The medium-term positive catalyst is the Van Rossem Hard Fork scheduled for June 30 — Protocol Version 11 — which prioritises Plutus smart contract efficiency improvements. Momentum typically builds in the two to three weeks before a major Cardano hard fork. A tactical position initiated at $0.175 with a June 30 catalyst horizon has asymmetric risk-reward if Bitcoin stabilises above $60,000.
Technical Analysis and Trade Signal — Cardano ADA/USD:
Direction: Speculative Buy (Pre-Hard Fork; Small Size Only)
Entry: $0.175 — pre-hard fork accumulation zone
Stop Loss: $0.152 — below structural support; capitulation level
Take Profit: $0.240 — hard fork catalyst target; near-term resistance zone
Key Risk: Van Rossem HF June 30 is the sole medium-term catalyst; BTC must hold $60K for this to work. Position size must be small given governance uncertainty
Economic Calendar — US Session, 5 June 2026
NFP (+172K) and Unemployment (4.3%) were released at 08:30 ET and are the dominant session drivers. Remaining events for the session: Wholesale Inventories April Final at 10:00 ET (forecast -0.3%, low impact); Baker Hughes Oil Rig Count at 11:00 ET (medium impact — rising rig count would pressure WTI); 3-Year Treasury Note Auction at 13:00 ET (medium impact — weak demand would extend the 10Y yield climb above 4.55%). Ongoing: Middle East ceasefire headlines remain a high-impact binary risk all day — any credible ceasefire would crash oil $3 to $5 per barrel and strengthen risk assets, while Hezbollah’s current rejection means no weekend deal is priced. Looking ahead: Bank of Canada rate decision on June 10 (hold expected; any hawkish surprise would sharply strengthen CAD). FOMC rate decision on June 17-18 is the dominant macro event of the month — today’s NFP has materially upgraded the probability of a hawkish outcome.
Session Summary — All Roads Lead to the FOMC
Friday’s US session opened into a three-way crossfire that defines the current macro regime with unusual clarity. The NFP beat confirms US economic resilience — but in an inflation era, a resilient economy is not unambiguously good for risk assets. It means the Federal Reserve stays hawkish, rates stay high, discount rates compress equity valuations, and speculative assets like Bitcoin face sustained headwinds. The S&P 500’s mixed performance alongside the Nasdaq’s semiconductor rout illustrates the second crossfire: AI-hype normalisation. Intel’s 4.2% decline despite its compelling turnaround story shows sector beta dominates on risk-off days.
The actionable playbook for the remainder of the session: maintain the USD/CHF short bias toward 0.7856 on Middle East safe-haven flows; watch USD/CAD’s 1.3916 resistance for the next leg toward 1.40 ahead of the June 10 BoC meeting; short Treasuries targeting 10Y yield at 4.70% ahead of the FOMC — but reduce size ahead of the weekend given geopolitical binary risk. Accumulate Bitcoin near the $60,000 to $62,000 zone with a hard stop at $55,000 given structural ETF outflow pressure. Buy Intel below $104 for a swing trade toward $122. Treat the Cardano pre-hard fork window below $0.175 as a small asymmetric speculative position. Reduce leverage into the weekend close: the Middle East situation is binary and unforeseeable, and the FOMC on June 17-18 is the dominant macro event of the month.
Read Full Report: https://www.capitalstreetfx.com/market-analysis/nfp-beats-tech-rout-bitcoin-bleeds-us-session-5-june-2026/

Comments
No comments yet. Be the first to share your thoughts!
Authentication Required
You must be logged in to post a comment.