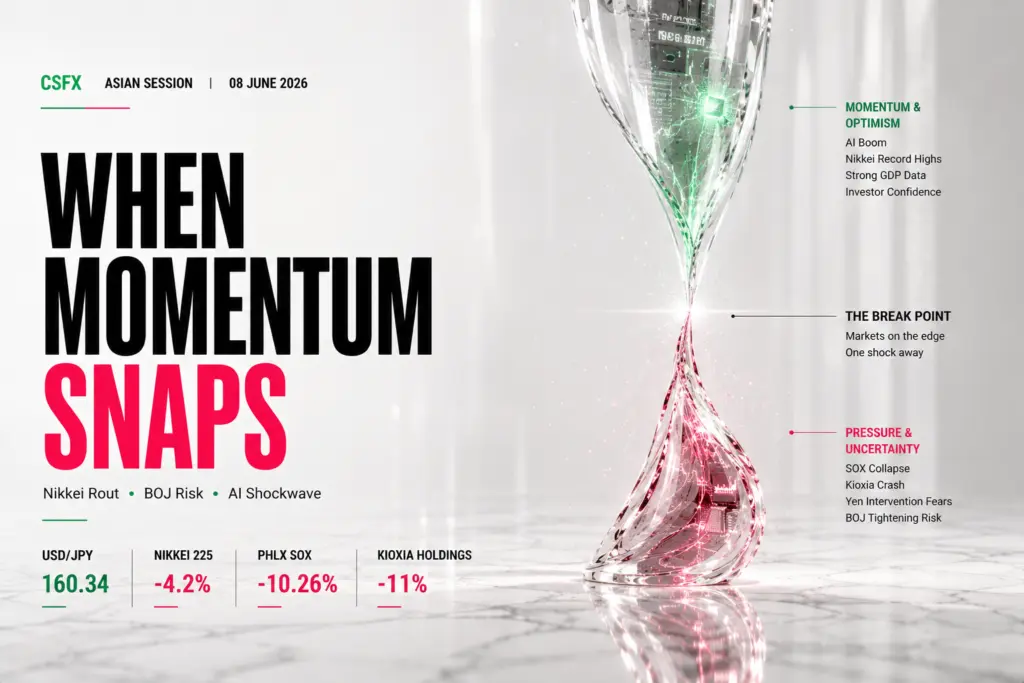
Nikkei Crashes 4%, Yen Hits 160 & Kioxia Implodes
Monday, 8 June 2026 · Tokyo / Sydney Open
★ SOX -10.26% Friday · USD/JPY 160.34 — BoJ Intervention Zone · Japan Q1 GDP +0.5% Beat · Kioxia -11% ★
AUD/JPY 113.09 · USD/JPY 160.34 · Copper $6.30/lb · Nat Gas $3.166 · ASX 200 8,522.2 · XRP $1.11 · Cardano $0.16
Session Prices — Tokyo / Sydney Open, 8 June 2026
Nikkei 225 at 63,791 (▼ -4.20%). ASX 200 at 8,522.2 (▼ -0.49%). USD/JPY at 160.34 (▲ +0.06%). AUD/JPY at 113.09 (▼ -0.34%). Copper HG at $6.30/lb (▼ -0.31%). Natural Gas at $3.166/MMBtu (▼ -1.24%). XRP at $1.11 (▲ +2.63%). Cardano ADA at $0.16 (▼ -2.44%). Gold XAU/USD at $4,312.20 (▼ -1.11%). WTI Crude at $93.70 (▲ +3.40%). Bitcoin at $62,874 (▲ +2.28%).
Session Overview — Three-Way Stress Test
Monday’s Asian session has opened under a three-way stress test of historic proportions: the worst Philadelphia Semiconductor Index collapse since March 2020, a yen in its third consecutive session grazing the BoJ’s intervention danger zone at 160 per dollar, and stronger-than-expected Japanese GDP data that paradoxically makes Tokyo’s equity market more — not less — vulnerable by raising the probability of a BoJ rate hike this month. The result is a Nikkei 225 down nearly 4%, Kioxia Holdings cratering 11%, and a cross-asset risk-off wave reverberating into AUD/JPY, the ASX 200, copper, and crypto simultaneously.
Japan’s Q1 2026 GDP expanded at 0.5% quarter-on-quarter, beating the 0.3% consensus — and rising 1.8% year-on-year, surpassing the 1.3% forecast. Growth was driven by firming private consumption gaining 0.3% QoQ and robust external demand. In any other context, this would be unambiguously constructive for Japanese equities. In June 2026, however, it is being read as the final ingredient needed for the Bank of Japan to raise interest rates at its upcoming late-June meeting — adding discount-rate pressure onto tech stocks with stretched multiples already hammered by Friday’s US semiconductor rout. Markets are now pricing a BoJ hike at the June meeting as a live risk, with probability estimates approaching 65%.
The catalyst for the tech carnage traces directly to Friday’s US close: the Philadelphia Semiconductor Index plunged 10.26% — its largest single-session drop since March 2020 — after Broadcom’s post-earnings guidance flagged softer-than-expected AI chip demand for its custom ASIC products. Kioxia Holdings fell as much as 11% intraday, while SoftBank Group dropped 9%. Other notable laggards include Renesas Electronics, Furukawa Electric, and IBIDEN. The Nikkei 225 touched an intraday low of 63,791 before a partial recovery, having now shed more than 4,600 points from its 2026 year-to-date high of 68,670. South Korea’s KOSPI plunged over 8%, triggering circuit breakers, with Samsung and SK Hynix both down 10%.
The third thread binding the session is the yen. USD/JPY is trading at 160.34, hovering for a third consecutive session near the psychologically critical 160 level — the exact trigger point for Japan’s historic ¥11.7 trillion intervention last month, the country’s largest-ever currency defence. Finance Minister Katayama has repeated verbal warnings that authorities stand ready to intervene, and BoJ Governor Ueda has flagged that acting too late on inflation could require a stronger policy response. The yen has now retraced the entire intervention gain, raising questions about whether the MOF has the political will — and the remaining foreign reserves — to attempt another round. For AUD/JPY and USD/JPY traders, intervention risk is the dominant binary for this session.
Breaking News — Asian Session Headlines
Nikkei 225 Crashes to 63,791 — Kioxia -11%, SoftBank -9% as SOX Contagion Sweeps Asia
The Nikkei 225 opened 0.9% lower on Monday and widened its losses to nearly 4% intraday, touching 63,791 before a partial recovery. The sell-off is a direct consequence of Friday’s Philadelphia Semiconductor Index collapse of 10.26% — the largest since March 2020 — triggered by Broadcom’s softer-than-expected AI chip demand guidance. Kioxia Holdings led the carnage with an 11%+ intraday decline, while SoftBank Group fell 9%. Year-to-date Nikkei gains have now narrowed sharply from the 68,670 high. South Korea’s KOSPI plunged over 8%, triggering circuit breakers, with Samsung and SK Hynix both down 10%.
USD/JPY at 160.34 — Third Session in BoJ Intervention Zone; MOF Issues Fresh Verbal Warnings
USD/JPY is trading at 160.34, its third consecutive session at or near the 160 level that triggered Japan’s ¥11.7 trillion intervention last month. Finance Minister Katayama reiterated that authorities stand ready to intervene, while PM Takaichi warned of responding to excessive FX movements. The yen has now retraced the entire intervention gain, raising doubts about Tokyo’s ability and willingness to mount another costly defence. BoJ Governor Ueda flagged that acting too late on inflation could require a stronger response — a tacit rate-hike signal. BoJ rate-hike probability for late June is now priced at approximately 65%.
Japan Q1 GDP Beats: +0.5% QoQ, +1.8% YoY — Raises BoJ Rate-Hike Probability This Month
Japan’s first-quarter GDP came in at +0.5% quarter-on-quarter, significantly above the 0.3% consensus, and +1.8% year-on-year against a 1.3% expectation. Growth was driven by private consumption gaining 0.3% QoQ and strong external demand. In an environment where the BoJ is actively considering its next rate hike, the beat is being read as pro-tightening, paradoxically hurting Japanese equities by compressing valuation multiples for long-duration tech stocks. Corporate capital spending was flat in Q1 versus 6.5% YoY growth in Q4 2025 — a point of caution for domestic investment momentum. The data cements the BoJ’s hawkish bias for June.
ASX 200 Falls to 8,522 — Resources Resilient, Financials Drag; RBA On Hold
Australia’s S&P/ASX 200 is down 0.49% to 8,522.2, underperforming regional peers in relative terms but outperforming Japan significantly. Resource stocks — iron ore, gold, and energy — are providing a partial buffer given elevated commodity prices, with iron ore holding above $115 per tonne and gold near $4,312. The Australian dollar is under modest pressure against a firmer USD. The RBA held rates at its last meeting and Australia’s TD-MI Inflation Gauge eased 0.3% in May, reducing the urgency for further tightening. China’s Monday trade data release this morning is the key catalyst for AUD and the materials sector.
XRP Rallies 2.63% to $1.11 While ADA Slips to $0.16 — Divergence Widens
A sharp divergence is emerging in crypto during the Asian session. XRP is up 2.63% to $1.11 as favourable US regulatory commentary surrounding the SEC framework continues to support institutional inflows. By contrast, Cardano has fallen to $0.16, as Charles Hoskinson’s recent warning of a wave of failures in the Cardano ecosystem suppressed sentiment. Santiment data shows ADA’s social dominance near a 2026 peak while active addresses hit a four-month high — a historically bearish divergence when social attention surges alongside price weakness. Bitcoin has bounced to $62,874, up 2.28%, offering a partial recovery from last week’s lows. The Van Rossem hard fork scheduled for June 30 remains ADA’s key near-term catalyst.
Oil Surges 3.4% to $93.70 WTI — Copper Steady, Natural Gas Slides
WTI crude has surged 3.4% to $93.70 and Brent is near $96.26 as US-Iran diplomacy remains deadlocked and Middle East supply risk remains elevated. Goldman Sachs has separately raised its copper price forecasts, citing tighter ex-US market conditions, while ex-COMEX copper trades at $6.30/lb with neutral technical signals. Natural gas continues to soften — falling to $3.166/MMBtu as mild spring weather weighs on US cooling demand and pipeline maintenance at Sabine Pass has reduced LNG feedgas flows. The oil spike adds an additional inflationary layer to the BoJ’s rate-hike calculus.
Trade Setups — Seven Instruments, Asian Session 8 June 2026
All levels for reference only. Not financial advice. Visit capitalstreetfx.com for live signals.
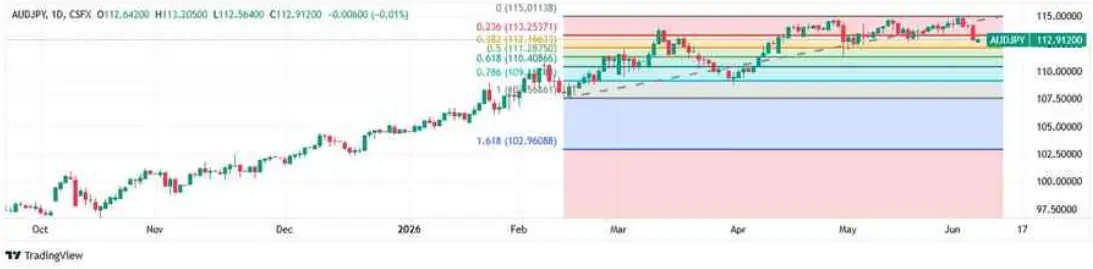
AUD/JPY — Bearish Bias; Sell Rallies to 113.50 | Intervention Risk + China Data
AUD/JPY is caught between two powerful opposing forces. On the AUD side: Australia’s RBA is on hold, domestic inflation is easing with the TD-MI Gauge down 0.3% month-on-month in May, and China’s manufacturing PMI — though still expansionary at 51.8 — has cooled from April’s 52.2 reading. China’s slower industrial profit trajectory of minus 1.2% year-on-year threatens demand for Australian iron ore, AUD’s primary commodity driver. On the JPY side: the BoJ’s hawkish pivot, Japan’s GDP beat, and the omnipresent threat of direct yen intervention near 160 per dollar all strengthen the case for yen appreciation. After extending gains for three consecutive sessions to a high of 113.50, AUD/JPY has turned lower in today’s Asian session. The pair is now testing support at the 112.70 to 112.90 zone, which aligns with the 20-day EMA. Implied volatility on AUD/JPY put options has risen to 11.5% from 9.8% a month ago, signalling the market is positioning for a sharp move to the downside. A break below 112.80 opens the path to 110.80 — the confluence of the 50-day EMA and the May consolidation base. Key triggers: any BoJ/MOF verbal escalation if USD/JPY tests 160.50+; China trade data release this morning; and broad risk-off momentum from the Nikkei’s continued decline, which historically correlates with AUD/JPY downside during Asian hours.
Direction: Bearish — Sell Rallies to Resistance
Entry (Short): 113.50 — intraday resistance; session high from prior three sessions
Stop Loss: 114.20 — above the 1-week range high
Take Profit: 110.80 — 50-day EMA and May consolidation base
Implied Vol: 11.5% (1M) — up from 9.8%; market pricing sharp downside move
Key Risk: China trade data beat supports AUD; BoJ delays intervention beyond this session
USD/JPY — Tactical Short at 160.50 | Most Dangerous Trade in G10; 4:1 Asymmetry
USD/JPY is the most treacherous pair in G10 FX right now, offering asymmetric short risk — but also asymmetric reward if intervention fires. The structural case for USD strength is real: Friday’s NFP beat of +172K versus 130K pushed Fed rate-hike probability to 85%, and the 10-year Treasury yield at 4.52% maintains a substantial carry differential against Japanese JGBs at approximately 1.05%. However, the MOF and BoJ have drawn a clear line in the sand at or near 160. Japan’s prior ¥11.7 trillion intervention caused USD/JPY to fall approximately 5 yen in hours — a move from 160.50 to 155.50 in an afternoon is the risk every long USD/JPY position now carries. USD/JPY is in its third consecutive session hovering precisely at the 160 trigger level. The Bollinger Band squeeze and declining ADX suggest the pair is coiling for a resolution. The week’s high of 160.74 represents the key breakout resistance. A sustained push above 160.75 would target 162.00; any MOF intervention announcement would target 155.00 to 156.00 in the first move. Reduce position size substantially relative to normal given the binary nature of the risk. The risk/reward for a short entry at 160.50 with a 161.40 stop and 156.50 target is approximately 4:1 — the best asymmetric setup in G10 FX today. Key triggers: any statement from MOF Katayama or BoJ Ueda beyond scheduled remarks; USD/JPY breaching 160.75, the level where intervention historically becomes most probable based on prior episodes. Treat positions as binary options — hard stops are essential.
Direction: Tactical Short — Asymmetric Intervention Premium Capture
Entry (Short): 160.50 — inside the active intervention zone
Stop Loss: 161.40 — above the intervention trigger zone; strict hard stop
Take Profit: 156.50 — post-intervention equilibrium target
Risk/Reward: Approximately 4:1 — the best asymmetric setup in G10 FX today
Key Risk: BoJ/MOF delays intervention; pair runs to 161–162 before acting
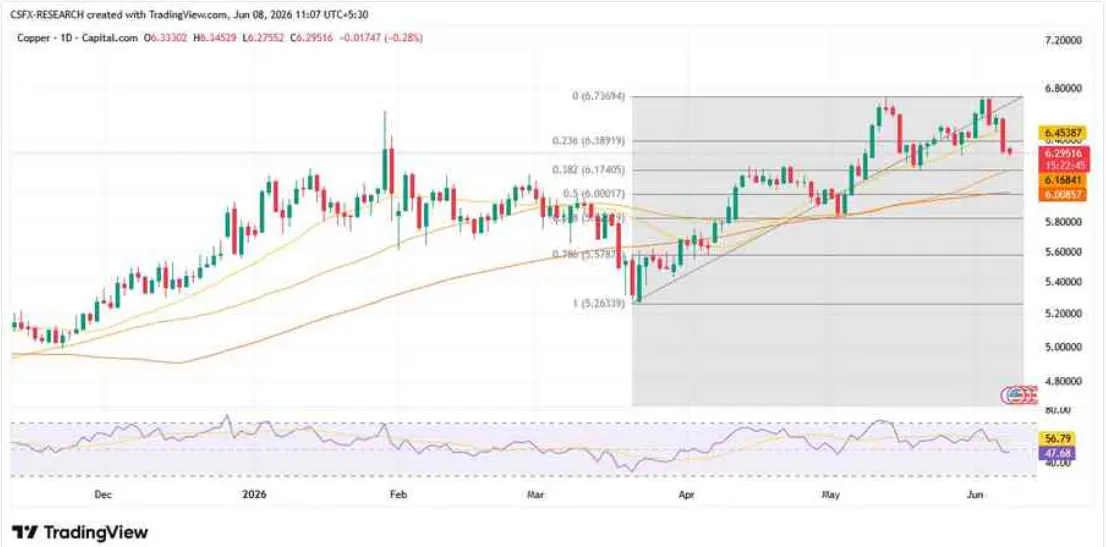
Copper HG — Range Trade; Buy Dips to $6.18 | Goldman Bull Thesis Intact
Copper is navigating a complex fundamental picture. Goldman Sachs has raised its copper price forecasts, identifying ex-US market tightening as the primary driver — supply outside of North American COMEX markets is narrowing due to mine production shortfalls in Chile and Peru, and the energy transition buildout for EV batteries, grid infrastructure continues to sustain structural demand. However, two headwinds are capping upside in the near term: China’s manufacturing PMI eased to 51.8 from 52.2, and Chinese industrial profits contracted 1.2% year-on-year, weakening the demand signal from the world’s largest copper consumer; and risk-off sentiment from the Nikkei crash reduces speculative positioning in industrial metals. Copper has been in a broad range of $6.20 to $6.55 since April, with the current price at $6.30 near the midpoint. Moving averages are converging — the 50-day and 200-day in close proximity — producing a technically indecisive setup. A pullback toward $6.18 — the 20-day EMA and the top of April’s consolidation — would offer a cleaner long entry with support from Goldman’s structural thesis. Avoid chasing strength above $6.48 without a clear China demand catalyst. China’s trade data release this morning is the primary short-term catalyst: a beat in copper import volumes from China would confirm demand resilience and target $6.50; a miss reinforces the slow-demand narrative and could test $6.05 support.
Direction: Neutral — Range Trade; Buy Dips Near Support
Entry (Long): $6.18 — 20-day EMA and April consolidation top
Stop Loss: $6.05 — below consolidation support; thesis invalidated
Take Profit: $6.50 — upper range; China demand confirmation target
Key Catalyst: China trade data import volumes this morning — the directional gate
Key Risk: China data miss reinforces slow-demand narrative; $6.05 comes into play
Natural Gas NG — Bearish Near-Term; Sell Rallies to $3.28 | Supply Surplus Dominant
Natural gas is caught between two contradictory forces. The bullish case: Middle East tensions and tight regional LNG supply have elevated a geopolitical risk premium — US natural gas futures rose past $3.28 last week, a four-month high, as supply from the Middle East remained constrained. The bearish case — currently dominant: mild US and European spring weather has muted cooling demand, US Lower 48 production averaged 108.8 billion cubic feet per day though down from 109.7 in May, and inventories have built at a faster pace than normal with the storage surplus approximately 5 to 6% above seasonal norms. Pipeline maintenance at Sabine Pass is additionally reducing LNG feedgas volumes, dragging the JKM Asia LNG benchmark softer. Natural gas has declined to $3.166, breaking below the $3.21 prior close and returning to the lower end of its recent range. The price is now minus 12.76% year-on-year, underperforming most energy commodities. Resistance sits at $3.28 — the prior week high — while support lies at $2.90, the March 2026 trough. A rebound rally to $3.28 represents a sell-on-strength opportunity if inventory data continues to show above-seasonal builds. The primary Asian session catalyst is temperature forecast updates — any meaningful heat signature in June outlooks would support a rapid reversal toward $3.50+. Watch EIA storage data Thursday.
Direction: Bearish Near-Term — Sell Rallies to Resistance
Entry (Short): $3.28 — prior week high; resistance on any bounce
Stop Loss: $3.45 — above geopolitical risk premium ceiling
Take Profit: $2.90 — March 2026 trough; structural support zone
Key Catalyst: EIA storage data Thursday; temperature forecast updates for US/Europe
Key Risk: Heat wave in June outlooks triggers rapid reversal toward $3.50+
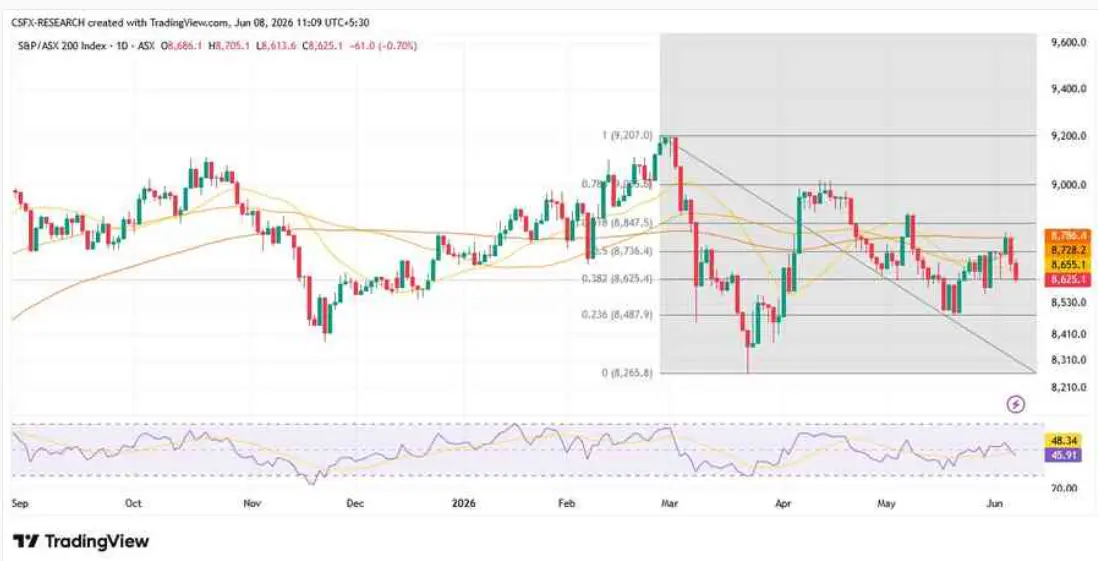
ASX 200 — Neutral; Support Holds at 8,500 | China Data the Wildcard
The ASX 200’s relative outperformance versus the Nikkei’s 3.86% collapse — ASX down only 0.49% — reflects Australia’s different economic composition. The index’s heavy weighting toward resources in materials and energy acts as a natural hedge when commodity prices remain elevated. Iron ore above $115 per tonne, gold near $4,312, and oil surging 3.4% today to $93.70 all support the Australian resource sector. Financials and technology stocks are dragging, mirroring global themes. The RBA’s on-hold stance provides a stable domestic policy backdrop. The ASX 200 has a well-established support band at 8,650 to 8,697, which has held on multiple tests since late May. Above, resistance sits at 8,870, the post-May recovery high, and the 52-week high of 9,202 remains the broader bull target. The index recently snapped an eight-session losing streak and has shown stabilising momentum. Moving averages are beginning to flatten, suggesting the corrective phase is maturing. A break below 8,580 would accelerate toward the 8,262 52-week low — treat that as the invalidation level for any bullish thesis. Key ASX catalysts today: China trade balance data with iron ore import volumes critical for materials; any escalation in US-Iran tensions moving crude sharply; and AUD/USD stability above 0.6400 supporting offshore sentiment. Monitor BHP, Rio Tinto, and Fortescue as the real-time pulse of the materials sector.
Direction: Neutral — Support Holds; Wait for China Data Confirmation
Entry (Long): 8,650 — retest of established support band; multiple prior holds
Stop Loss: 8,580 — below support band; accelerates toward 8,262 52-week low
Take Profit: 8,870 — post-May recovery high; resistance zone
Key Catalyst: China trade data — iron ore import volumes determine materials sector direction
Key Risk: China data miss undermines commodity demand assumptions; 8,580 tested
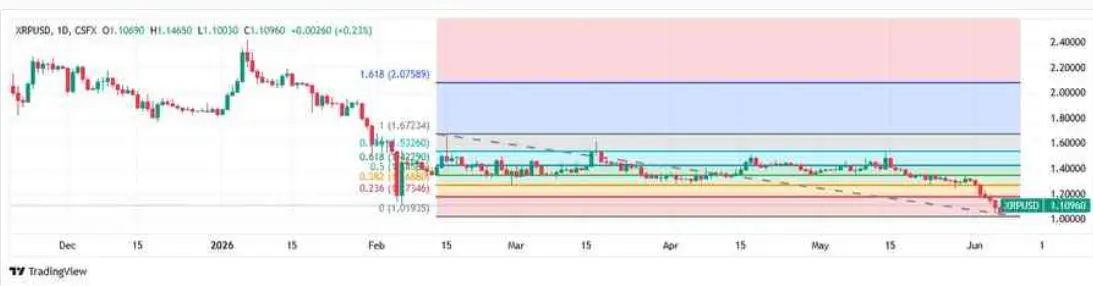
XRP / Ripple — Bullish; Buy Dips to $1.07 | Regulatory Tailwind; RSI Caution
XRP is one of the clearest beneficiaries of the evolving US regulatory framework for digital assets. Favourable SEC commentary and growing institutional interest in XRP-based settlement infrastructure have supported a sustained price premium versus other major altcoins. In today’s Asian session, XRP is up 2.63% to $1.11, diverging sharply from Cardano’s decline and broadly outperforming the altcoin complex. The XRP/USD pair is trading above both its 50-day moving average at $1.07 and its 200-day moving average at $1.09 — a confirmed dual-MA bull alignment. The 14-day RSI at 74.01 signals overbought conditions — the primary caution for momentum longs. Overbought RSI does not preclude further upside in trending markets, but it does increase the probability of a short-term mean-reversion pullback to the $1.07 to $1.09 zone. A healthy pullback to $1.07, near the 50-day MA support, would offer a high-quality re-entry point. Resistance sits at $1.14 — the June target — and $1.16, the upper Bollinger Band. A monthly close above $1.11 extends the bull case toward $1.17 to $1.22 for Q3 2026. Watch for any additional US regulatory clarity on the XRP classification framework — each positive statement has historically produced 3 to 5% intraday spikes. Avoid chasing above $1.14 without a clear catalyst.
Direction: Bullish — Buy Dips; RSI Caution at Current Overbought Levels
Entry (Long): $1.07 — 50-day MA support; pullback re-entry from overbought
Stop Loss: $0.98 — below key structural support
Take Profit: $1.16 — upper Bollinger Band; June cycle target
RSI Warning: 14-day RSI at 74.01 — overbought; do not chase at $1.11
Key Risk: Broader crypto risk-off pulls XRP below dual-MA support despite regulatory tailwind
Cardano ADA — Accumulate Below $0.175 | Van Rossem Hard Fork June 30 Catalyst
Cardano occupies a contradictory position in crypto right now: deteriorating price action — down 2.44% today to $0.16 — yet surging on-chain activity and social engagement. Santiment data shows active addresses at a four-month high and social dominance near a 2026 peak — metrics that have historically preceded relief rallies when accompanied by capitulation-level pricing. Charles Hoskinson’s warning of a wave of failures in the Cardano ecosystem is the key bearish overhang, introducing uncertainty about ecosystem execution. The 50-day and 200-day moving averages are both above the current price and falling — confirming a structural bear trend in the short-to-medium term. The 200-day MA has been declining since May 9, 2026 — a medium-term bear signal. However, at $0.16, the price is approaching levels that have historically represented strong long-term accumulation zones relative to the project’s on-chain activity. The Van Rossem governance hard fork on June 30 is the key catalyst — hard forks have historically produced 20 to 40% appreciation in ADA in the 2 to 3 weeks preceding the event. The current $0.16 level already meets the below-$0.175 accumulation guideline from prior analysis. Target $0.200 into the hard fork with a hard stop at $0.130. Monitor DeFi TVL on the Cardano network — growing TVL amid price weakness is a bullish divergence signal.
Direction: Neutral — Accumulate Below $0.175; Van Rossem Hard Fork June 30
Entry (Long): $0.152 — below current $0.16; deeper accumulation if weakness continues
Stop Loss: $0.130 — capitulation level; hard fork thesis structurally broken
Take Profit: $0.200 — hard fork catalyst target; prior consolidation zone
Hard Fork Date: June 30 — Van Rossem Protocol Version 11; Plutus efficiency upgrade
Key Risk: Hoskinson ecosystem warning creates sustained selling; $0.130 support tested
Economic Calendar — Asian Session, 8 June 2026
All times JST (Japan Standard Time). CSFX instrument impact notes for each release.
08:50 JST — Japan Q1 GDP Final (QoQ / YoY) RELEASED (HIGH). Beat: +0.5% QoQ versus +0.3% forecast, +1.8% YoY versus +1.3% forecast. Already moved market — Nikkei down 4%, BoJ hike probability raised to 65%, JPY pairs volatile.
09:30 JST — Japan Corporate Capital Spending Q1 YoY (MEDIUM, forecast +4.0%, prior +6.5%). Flat corporate capex confirms domestic investment caution. Directional for Nikkei domestic outlook and BoJ assessment of economic breadth.
10:00 JST — China Trade Balance May (HIGH, forecast $75 billion surplus, prior $72 billion). THE primary commodity catalyst this morning. Beat in iron ore and copper import volumes is bullish AUD, copper, and ASX 200 materials sector. Miss reinforces the slow-demand narrative and weighs on AUD/JPY and copper.
10:30 JST — Australia ANZ Job Advertisements May (MEDIUM, forecast +1.2%, prior +1.8%). Labour market signal for RBA forward guidance. Below zero would revive cut speculation; above +2.0% confirms employment resilience and reduces cut probability.
11:00 JST — Japan Eco Watchers Survey Outlook (LOW, forecast 48.0, prior 47.3). Contextual for domestic Japan sentiment. Below 47 adds to consumer confidence concerns; above 50 signals expansion — unlikely given today’s market conditions.
All day — MOF/BoJ FX Intervention Watch USD/JPY approximately 160 (CRITICAL — BINARY). Prior intervention: ¥11.7 trillion in May. Any MOF/BoJ statement triggers immediate 300 to 500 pip JPY move. This is the session’s dominant binary risk — monitor continuously.
14:00 JST — Singapore GDP QoQ Final Q1 2026 (MEDIUM, forecast +0.6%, prior +0.8%). Directional for regional risk appetite and Singapore dollar pairs. Miss below +0.4% adds to Asia-Pacific growth concern narrative.
15:00 JST — BoJ Summary of Opinions June meeting preview (HIGH). Hawkish bias expected given GDP beat. Any explicit rate-hike language causes immediate JPY surge and Nikkei acceleration lower. Balanced or dovish tone would provide temporary relief for Japanese equities. Critical for all JPY pairs this session.
17:00 JST — SpaceX IPO pricing finalisation, June 11 expected (MEDIUM). $1.75 to $2 trillion valuation. Capital outflow concern for Asian tech stocks — if IPO pricing signals strong institutional demand, risk appetite for Asian tech may further deteriorate as capital rotates.
Asian Session Summary — 8 June 2026
Monday’s Asian session has opened under a convergence of risks that reveals the interconnected fragility of global financial markets in a hawkish-rate, geopolitically volatile environment. The Nikkei 225’s 4% collapse — led by Kioxia’s 11% crash and SoftBank’s 9% slide — is not fundamentally about Japan; it is the global semiconductor guidance cycle’s aftershock reaching Asia’s most technology-weighted major index. The Broadcom AI chip demand miss from Friday’s US close has cascaded across every semiconductor complex in the world, and Japan’s SOX-correlated tech names have borne the heaviest burden this session.
The actionable playbook for the remainder of the Asian session requires disciplined bifurcation: intervention risk in USD/JPY demands small positions with hard stops; AUD/JPY’s bearish bias is reinforced by both yen strength prospects and cooling China demand signals; and the commodity complex is internally divergent — oil’s Middle East risk premium has structural legs while natural gas supply surplus continues to cap upside. In currencies, both JPY pairs offer asymmetric reward on the yen-strengthening side if BoJ/MOF escalates beyond verbal intervention — but position size must reflect the binary nature of the trade. In commodities, copper’s Goldman-backed fundamental thesis supports buy-the-dip below $6.18, while natural gas shorts at $3.28 offer a better risk/reward than attempting to buy the recovery prematurely.
In crypto, the XRP/ADA divergence is the session’s most actionable signal: XRP’s regulatory tailwind is a sustainable premium driver, while ADA’s Van Rossem hard fork on June 30 represents a medium-term catalyst that supports accumulation below $0.175. Bitcoin’s recovery toward $62,874 is the rising tide that could lift both, but monitor whether that recovery sustains through the European session open before adding risk. The biggest near-term event risks: any BoJ/MOF intervention statement on USD/JPY as an intraday binary; China’s trade balance release this morning with commodity and AUD ripple effects; and SpaceX’s IPO pricing on June 11 as a broader risk appetite signal for Asian markets all week. Reduce leverage on JPY pairs; maintain patience on hard fork catalysts; and watch China data before adding copper exposure.
Read Full Report: https://www.capitalstreetfx.com/market-analysis/daily-market-analysis/

Comments
No comments yet. Be the first to share your thoughts!
Comments only for logged-in users.