THE SILENT ORATOR: HOW US TREASURY BONDS AND THE YIELD CURVE DICTATE THE DIRECTION OF EVERY FINANCIAL MARKET — AND WHAT THEY ARE SAYING RIGHT NOW | CAPITAL STREET FX
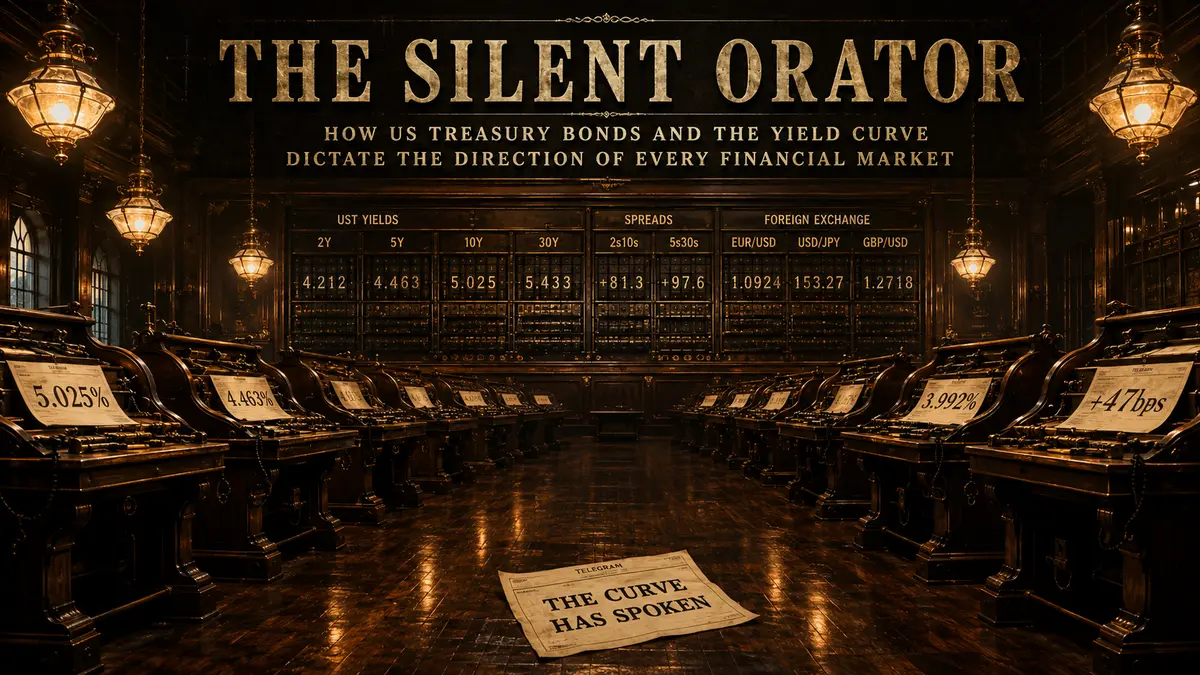
US 30Y Treasury Yield: 5.025% — first close above 5% since 2007
US 10Y Treasury Yield: 4.463% — elevated on fiscal concerns
US 2Y Treasury Yield: 3.992% — pricing near-term cuts ahead
2Y/10Y Spread: +47bps — re-steepened from record -108bps inversion
10Y TIPS Real Yield: ~2.1% — highest sustained level since 2008
30Y TIPS Real Yield: 2.70% — historically restrictive
DXY Dollar Index: 98.97 — weakening despite elevated rates
USD/JPY: 159.26 — JGB yield approaching 2.70%, 30-year high
EUR/USD: 1.1654 — near 1-year high
GBP/USD: 1.3458 — near 3-day highs
XAU/USD Gold: $4,542 — off all-time high of $5,595, stabilised above $4,500
PCE Inflation: 3.8% YoY, Core 3.3% — fifth year above target
Fed Funds Rate: 4.25-4.50% — zero cuts priced for 2026
Fed Chair: Kevin Warsh — sworn in 22 May 2026, 11th Chair
US National Debt: $36.2 trillion — growing at $1 trillion every ~100 days
Japan Treasury Holdings: ~$1.1 trillion — $220 billion at repatriation risk
Inversion Duration: 803 days — longest ever recorded, now re-steepened
Historical Parallels: 1994 Bond Massacre, 2007 Re-Steepening Trap, 1981 Volcker Peak
INTRODUCTION: A MARKET THAT SPEAKS WITHOUT WORDS
On the afternoon of 29 May 2026, nobody made a speech. Nobody needed to. The US Treasury sold $25 billion in 30-year bonds and the auction cleared at 5.025% — a number that appeared on trading terminals in Tokyo, London, and New York within milliseconds of the hammer falling. No finance minister issued a statement. No central banker stepped to a podium. A single number crossed the wire, and the largest financial market on earth began, without discussion or ceremony, to rearrange itself around it.
The bond market does not hold press conferences. It does not publish forecasts or issue clarifications when it has been misunderstood. It communicates entirely through movement — through a number on a screen, through the shape of a curve drawn between short and long maturities, through the relationship between what it costs to borrow money today and what the market believes that money will be worth tomorrow. When it has something important to say, it says it by moving.
Right now, it is moving.
The 30-year yield at 5.025% is the highest since 2007. The year Bear Stearns collapsed. The 2-year/10-year spread spent 803 consecutive days inverted — the longest inversion in the recorded history of the modern bond market — and has now re-steepened to +47 basis points. A new Fed Chair believes the neutral rate is structurally higher than any existing model assumes. Japan holds $1.1 trillion in US Treasuries and its domestic rate normalisation is changing the hedging arithmetic on every dollar of that holding. The dollar is weakening despite elevated nominal rates — a divergence that has appeared only three times in the modern era.
This article covers 236 years of the Treasury yield speaking, the three times it was most consequentially ignored, and what the current configuration means for every position across USD/JPY, EUR/USD, gold, and the instruments that move when the world’s reference rate changes.
PART I: THREE CHANNELS — WHY MOST TRADERS ARE ONLY HEARING ONE
The bond market sends three simultaneous signals through three distinct channels. Every major financial crisis in this article was preceded by two of those channels issuing clear warnings while the third was the only one being read by the consensus. Understanding all three is the prerequisite for reading the current configuration correctly.
CHANNEL ONE — THE LEVEL
The 10-year yield is the price the world charges America to borrow money for a decade. Compressed into that single number is everything the market collectively believes about inflation, growth, Fed policy, fiscal sustainability, and geopolitical risk — all at once. It is the global reference rate from which every other financial asset is priced.
When the real yield — the nominal yield minus inflation expectations — is positive and high, capital is expensive and leverage is punished. When the real yield is negative, capital is artificially free and risk accumulates in hidden corners of the system until the constraint is removed. The decade between 2012 and 2022, when the real 10-year yield was negative for most of it, was the period that built the excesses the market is now unwinding. Silicon Valley Bank. The regional banking crisis of 2023. The commercial real estate losses that are still being recognised in 2026. All are direct descendants of the period when the real yield told investors that risk was free, and they believed it.
The current 10-year real yield of approximately 2.1% is the highest sustained level since 2008. The 30-year real yield at 2.70% is historically restrictive — it means that inflation-adjusted borrowing costs for the longest US government maturities are higher than they have been for most of the past 15 years. This is the channel most traders are reading. It explains why equity valuations have compressed from their 2021 peaks. It explains the headwind for gold against inflation-protected bonds.
Here is the more important question: the Fed’s dot plots assume a neutral rate of 2.5%. Kevin Warsh — the man now running the institution — believes it is closer to 3.5–4%. If Warsh is right, the current Fed funds rate of 4.25–4.50% is barely restrictive at all. It only feels tight because every model and every portfolio was calibrated on the assumption that 2.5% neutral is correct. That is not a marginal calibration error. That is the difference between a fever that will break and a condition that is being misdiagnosed.
CHANNEL TWO — THE SHAPE
If the level tells you the price of money, the shape of the yield curve tells you what the market believes is coming next. An inverted curve — where you earn more lending to the government for two years than for ten — sends a single, historically reliable message: conditions will deteriorate, rates will need to fall, and either the economy will slow or something in the financial system will break.
The 2-year/10-year spread has inverted before every US recession since 1955. Every single one. No exceptions across 70 years of data. The 2022-2024 inversion reached -108 basis points at its most extreme — the deepest inversion in the modern era — and lasted 803 consecutive days, the longest inversion ever recorded in the post-war bond market.
The curve has now re-steepened to +47 basis points. And this is the number that every trader who understands market history is watching with something between fascination and unease — because the consensus reading of this moment, in financial media and investment bank research, is that the re-steepening represents the all-clear.
In 1989, 2000, and 2007, the consensus made the same call at the same moment. In each case, the re-steepening was not the danger passing. It was the danger arriving.
The mechanism: the short end of the curve begins pricing emergency rate cuts not because inflation has been defeated but because credit is deteriorating, bank stress is building, and the first signs of systemic strain are appearing. Simultaneously, the long end holds or rises because it is pricing fiscal concerns, inflationary persistence, or sovereign credibility questions that the Fed’s eventual emergency cuts do not resolve. The spread widens because both ends are right — about different things, simultaneously. The short end is right that rates will need to fall. The long end is right that fiscal conditions are deteriorating. The distance between those two truths, measured in basis points, is the measure of the damage ahead.
The current configuration — where the 30-year is above 5% on fiscal and inflation concerns while the 2-year is pricing cuts — is precisely this pattern. Not similar. The same pattern. In the same configuration that preceded each of the three major credit events of the post-war era.
CHANNEL THREE — THE REAL YIELD
Strip out inflation expectations from the nominal yield and what remains is the real yield — the true cost of money. This is the channel that governs gold, emerging market currencies, and risk assets with a precision that nominal yields cannot match. The relationship is mechanical, not coincidental.
When the real yield rises, gold faces structural headwinds because every basis point of real yield is a basis point of opportunity cost against holding a non-yielding asset. When the real yield falls, that headwind disappears and the structural gold bull case reasserts. The relationship has held across every TIPS cycle since the instrument was introduced in 1997.
The current 10-year real yield of 2.1% explains gold’s pullback from $5,595 to $4,542 without requiring any additional narrative. At 2.1% real yield, the opportunity cost of holding gold versus TIPS is real and material. What changes this: a confirmed Fed cutting cycle lowers the real yield and removes the headwind. A fiscal credibility event — a failed Treasury auction, a sovereign downgrade — accelerates central bank gold buying and supports the structural floor.
THE UNUSUAL DIVERGENCE IN CHANNEL ONE
The current configuration contains one anomaly that has the most experienced fixed income analysts concerned: the dollar is weakening despite elevated nominal yields. DXY at 98.97 while the 10-year stands at 4.463% is a configuration that should not exist in a normal rate-differential framework. Higher US rates should attract capital flows and support the dollar. They are not.
The explanation: the market is applying a fiscal discount to US credit that overrides the rate premium. When the dollar weakens despite high rates, the market is pricing not just monetary policy but institutional credibility risk. The US is running a fiscal deficit of approximately 7% of GDP in a non-recessionary environment, with national debt at $36.2 trillion growing at $1 trillion every 100 days, and a political system that has not demonstrated consensus to address either. That combination is beginning to price into the dollar in the way that similar combinations have historically priced into the currencies of smaller economies.
This divergence — high rates, weak currency — has appeared only three times in the modern dollar era. Each time it preceded a significant global financial realignment.
PART II: 236 YEARS OF THE YIELD SPEAKING — THE FOUNDING AND THE FIRST TEST
HAMILTON AND THE FIRST US TREASURY BOND, 1790
In September 1789, Hamilton walked into the Treasury Secretary’s office and found a government $75 million in debt, no central bank, no functioning tax system, and no established credit with any lender. He proposed the solution that created American sovereign credit: the federal government would assume all state debts and consolidate them into a single class of federal bonds. His logic was more fundamental than his political opponents understood: a creditor class with capital at stake in the republic’s solvency is not a conflict of interest — it is a constituency for institutional stability.
The first US Treasury bond was issued in 1790. Within two years it was trading at par on the Amsterdam exchange. The message was simple: America either honours its obligations or it does not. The market had decided it did. That lesson has not changed: sovereign credit is built on consistent behaviour. Every time the US has tested that credit — the Civil War greenback inflation, the Nixon Shock of 1971, the debt ceiling confrontations of the 21st century — the bond market has been the primary institutional check. It does not vote. It does not legislate. It prices.
THE CIVIL WAR AND THE MASS INVESTOR, 1861–1865
Jay Cooke sold $362 million in US government bonds directly to approximately 21 million ordinary citizens through 2,500 sub-agents — creating the retail bond investor. The greenback’s inflation established the central tension that remains unresolved in 2026: the conflict between a government’s preference for cheap financing and the market’s demand for real value.
FINANCIAL REPRESSION, 1942–1951
In April 1942, the Fed formally agreed to cap Treasury bill rates at 0.375% and 10-year yields at 2.5% — buying whatever volume was necessary. The government could not afford to finance WWII at market rates and directed the central bank to suppress the yield’s message. The pent-up inflationary pressure was released progressively after the Treasury-Fed Accord of March 1951. The 2020–2022 episode — the Fed holding rates near zero while describing 8% inflation as “transitory” — is the most direct modern parallel. The bond market was speaking throughout both periods. Both times, institutional listeners were hearing something other than what was being said.
PART III: THE THREE MOST EXPENSIVE MISREADINGS IN MODERN HISTORY
MISREADING 1: THE 1994 BOND MASSACRE — THE UNANIMOUS CONSENSUS
Coming out of the 1990-91 recession, the consensus in early 1994 was that the Federal Reserve would hold rates flat through the year. Not merely a majority view — a near-unanimous view. Every major investment bank, every large fund, every treasury desk was positioned for stability. The logic was sound: inflation was low, the recovery was moderate, and the Fed had given no signal of imminent tightening.
The Fed hiked 25 basis points on 4 February 1994 — a routine small adjustment that the market was supposed to have already priced. It had not. The reason it had not was exactly the consensus: when positioning is uniform, no one is holding the hedge. The 10-year yield rose 280 basis points over the following 12 months — the worst year for the US bond market in the post-war era. The 30-year yield rose from approximately 6.2% to 8.2%. The Mexican peso collapsed 53% as capital fled emerging markets. Orange County, California, filed for bankruptcy with $1.7 billion in losses from leveraged interest rate positions. Several European governments faced bond market crises as the rate shock transmitted globally.
Bond legend Bill Gross articulated the lesson afterward: the most dangerous moment in fixed income is the moment when the consensus is most uniform. Because uniform positioning means that any surprise — even a small one — forces simultaneous repositioning across the entire market in the same direction.
Today’s zero-cuts consensus for 2026 is the most uniform rate positioning since the first quarter of 1993. Not similar to that period. The same configuration. The same one-directional positioning that made 1994 so damaging.
MISREADING 2: THE 2007 RE-STEEPENING TRAP
The 2Y/10Y spread re-steepened from inversion in May 2007. The consensus immediately celebrated. The financial press ran articles about the resilient economy and the successful navigation of the housing market correction. The soft landing had been achieved. The yield curve had given the all-clear.
Bear Stearns’ first hedge fund disclosed severe losses in June 2007. Bear Stearns itself required an emergency Fed-backed rescue in March 2008. Lehman Brothers failed in September 2008. The global financial system effectively froze in October 2008. From the re-steepening that the consensus read as the all-clear in May 2007 to Lehman in September 2008 was approximately 16 months.
The re-steepening in 2007 was not the danger passing. It was the credit deterioration becoming visible simultaneously in both ends of the curve — the short end pricing the emergency cuts that the Fed would eventually deliver, the long end refusing to rally because fiscal and structural concerns were real and growing. Both ends were right. About different things.
The current 2-year yield at 3.992% is pricing some cuts. The current 30-year at 5.025% is refusing to price the fiscal improvement that those cuts would require. This is the 2007 configuration. Not similar to it. The same configuration. With the same internal logic.
MISREADING 3: “TRANSITORY” — 2021
The Federal Reserve spent most of 2021 describing 8%+ inflation as “transitory” while holding the Fed funds rate at 0–0.25% and the 10-year yield below 1.5%. The word “transitory” appeared in Fed communications approximately 75 times between May and November 2021. The bond market was speaking throughout this period — the 10-year was gradually rising from 0.9% in January 2021 to 1.5% by December 2021 — but the message was being suppressed by the Fed’s forward guidance and its explicit commitment to not tighten until certain labour market thresholds were met.
The 10-year yield reached 4.25% by October 2022 — a 275 basis point move in ten months that produced larger calendar-year losses in the US bond market than any year in the post-war era. Those losses directly contributed to the failure of Silicon Valley Bank in March 2023 — which held a large proportion of its assets in long-duration bonds purchased at near-zero yields in 2020–21 — and several other regional lenders that made the same mistake at scale.
The bond market had been pricing inflation in 2021. The institutional listening infrastructure had been tuned to hear “transitory.” The result was the most destructive single-year repricing of US fixed income in modern history.
PART IV: KEVIN WARSH AND THE NEUTRAL RATE QUESTION
Kevin Warsh was sworn in as the 11th Chair of the Federal Reserve on 22 May 2026. He received the lowest Senate confirmation vote count of any Fed Chair in the institution’s modern history — a fact that tells you something precise about the political moment and about the degree of establishment consensus behind his appointment. He is the first Fed Chair since Paul Volcker to inherit a situation where the bond market is not calmly accepting the institution’s authority but actively testing it.
Warsh believes the neutral rate of interest — the theoretical rate at which monetary policy is neither stimulative nor restrictive — is closer to 3.5–4% than the 2.5% embedded in every current dot plot published by the Federal Reserve. He has said this publicly. He has written it in academic work. It is his stated view.
If the neutral rate is 2.5%, the current Fed funds rate of 4.25–4.50% is genuinely restrictive — approximately 175–200 basis points above neutral. Tightening is working. Inflation will eventually respond. The Fed can be patient. Rate cuts can begin when the data is clear.
If the neutral rate is 4%, the current Fed funds rate of 4.25–4.50% is barely restrictive at all — only 25–50 basis points above neutral. The economy is running near an effectively accommodative policy stance. Inflation at 3.8% PCE headline and 3.3% core — five years above target — is not responding because the tool being applied is too weak, not because the tool needs more time to work. Every model built on the 2.5% neutral rate assumption is systematically miscalibrated. Every risk system that tells portfolio managers their duration exposure is appropriate given “current restrictive conditions” is running on a wrong input.
The 30-year yield at 5.025% is, among other things, a statement from the bond market about which of these two views is more likely correct. It is not pricing a world in which 2.5% neutral is accurate and current policy is substantially restrictive. It is pricing a world in which longer-term rates settle structurally higher, fiscal conditions deteriorate further, and the Fed’s ability to cut rates all the way back toward 2–3% is constrained by persistent inflation that the neutral rate model failed to predict.
PART V: JAPAN — THE $1.1 TRILLION REPATRIATION RISK
Japan holds approximately $1.1 trillion in US Treasury bonds — the largest single foreign holding of any country. This position was built during the era of near-zero Japanese interest rates, when Japanese institutional investors — pension funds, life insurance companies, regional banks, the Government Pension Investment Fund (GPIF) — could not earn adequate returns in domestic JGB markets and sought yield in US Treasuries, typically hedging the currency exposure back to yen.
The Bank of Japan raised rates to 0.75% in 2026 — the highest since 1995 — with a 6-3 hawkish vote split on the April meeting and a June hike as the base case if Japanese CPI at 2.8% YoY remains elevated. The 10-year JGB yield is now approaching 2.70% — near its highest level in approximately 30 years.
The hedging arithmetic has changed decisively. When the Fed funds rate was 5.5% and the BOJ rate was 0%, the interest rate differential was 550 basis points. A Japanese investor earning 4.4% on US Treasuries and paying 550 basis points of hedging cost was effectively earning a negative return on a currency-hedged basis. They were holding US Treasuries anyway for diversification and because the GPIF’s allocation mandates required it.
As the BOJ has raised rates and the Fed has held, the differential has compressed. The hedge-adjusted yield on US Treasuries for a Japanese investor is now approximately 0.5–1.0% — barely above the JGB yield that can now be earned in the domestic market without currency risk. The marginal Japanese institutional investor who was buying US Treasuries for yield is now asking whether they should be buying JGBs instead.
Morgan Stanley estimates that a 20% repatriation of Japan’s US Treasury holdings — approximately $220 billion moving from US bonds to Japanese government securities — would produce measurable upward pressure on US 10-year yields and a significant decline in USD/JPY. The repatriation does not require a decision to exit. It requires only a decision not to reinvest maturing US Treasury holdings in new US Treasury purchases — a passive repatriation through inaction.
For traders: the BOJ meeting dates, the JGB yield level, and any signals from the GPIF about allocation changes are now among the most important inputs for USD/JPY positioning. The August 2024 episode — when USD/JPY fell 12% in two weeks on a 15 basis point BOJ rate hike, triggering a global carry unwind and an equity market crash in Japan and South Korea — established the template for what happens when this repatriation calculation tips. Every basis point rise in the JGB yield moves more Japanese institutional capital past the threshold.
USD/JPY at 159.26. JGB at 2.70%. 30-year Treasury at 5.025%. The two endpoints of the most important rate differential in global markets are both moving toward convergence. The speed of convergence determines whether the carry unwind is orderly.
PART VI: GOLD AT $4,542 — THE REAL YIELD TIGHTROPE
Gold’s all-time high of $5,595 and its current level of $4,542 are arithmetically explained by the movement in real yields. The 10-year TIPS real yield rose from approximately 1.5% to approximately 2.1% over the period of gold’s pullback. The 30-year TIPS reached 2.70%. Every basis point rise in real yield is a basis point of annual opportunity cost for holding gold against inflation-protected government bonds. The relationship is mechanical and documented across every TIPS cycle since 1997.
The structural floor: central banks have been buying gold for 16 consecutive months. PBOC buying streak: 16 months. RBI reserves: 880 tonnes. This demand is not yield-sensitive — central banks are optimising for reserve asset security and geopolitical insulation, not for the TIPS spread. It continues regardless of where real yields sit.
The current gold position is the most direct expression of this analysis’s central tension. What breaks it in each direction: a confirmed Fed cutting cycle lowers real yields and sends gold toward $5,000+. A fiscal credibility event — failed Treasury auction, sovereign downgrade, debt ceiling crisis — accelerates central bank diversification and sends gold above $5,595 all-time high. Geopolitical normalisation — specifically Hormuz resolution — reduces the safe-haven premium and could push gold toward $4,000 support.
PART VII: THREE SCENARIOS AND TWELVE TRADE SETUPS
SCENARIO 1: WARSH CREDIBILITY HOLDS (30% PROBABILITY)
Inflation breaks sustainably below 3% within the next 12 months. The neutral rate debate resolves in the dovish direction. The 10-year yield falls toward 3.5–3.8% as real yields compress with inflation normalisation. Risk assets rally as the cost of capital falls. Gold breaks above $5,000 on declining real yields removing the primary structural headwind.
Trade setups — Scenario 1:
– Long gold: entry current, stop $4,300, target $5,200
– Short USD/JPY: entry 158-160, target 142, stop 165
– Long EUR/USD: entry 1.16-1.17, target 1.22, stop 1.13
– Long US 10-year Treasury futures: hold while yield below 4.8%
SCENARIO 2: FISCAL REALITY WINS — BASE CASE (50% PROBABILITY)
Inflation remains sticky at 3-4%. The 10-year holds at 4.2-4.8% driven by fiscal supply — the Treasury must issue approximately $2 trillion in net new debt this calendar year. The 30-year tests 5.5% by Q4. USD range-bound. USD/JPY declines progressively toward 145-150 as carry unwinds in manageable stages.
Trade setups — Scenario 2:
– Short USD/JPY: entry 160-162, target 148, stop 167
– Long gold: entry against $4,200 stop, target $4,900
● Long US 2-year Treasury against 4.20% yield level — front end pricing cuts is correct in this scenario
● Short crude oil on demand destruction if 10-year holds above 4.5%
SCENARIO 3: FISCAL CRISIS — TAIL RISK (20% PROBABILITY)
A failed Treasury auction, sovereign rating action, or debt ceiling crisis triggers a disorderly yield spike. The 30-year tests 6%+. The Fed faces the impossible choice: fight inflation or provide emergency liquidity. If it provides liquidity, the dollar weakens sharply. Gold surges above $6,000. The yen strengthens as Japan repatriates. EM currencies face stress.
Trade setups — Scenario 3:
● Long gold below $4,800: no stop — this is the scenario where gold is the primary structural safe haven
– Short USD/JPY: target 130, trailing stop
● Short US financial sector indices — bank credit quality deteriorates
● Long CHF (short USD/CHF) — traditional safe haven
PART VIII: WHAT TO WATCH — THE FIVE INDICATORS THAT MATTER
INDICATOR 1: TREASURY AUCTION TAIL
The gap between the stop-out rate and the when-issued yield at each Treasury auction is the most direct real-time signal of foreign and domestic demand for US sovereign debt. A significant tail — defined as more than 2 basis points — at a major auction signals that demand is thinning at current yield levels and that yields will need to rise further to clear supply. The 30-year auction is the most watched. The 10-year auction results are released weekly.
INDICATOR 2: BOJ COMMUNICATION AND JGB YIELD LEVEL
Any signal from the Bank of Japan about the pace of further rate hikes changes the USD/JPY calculation directly and the Japan repatriation risk timeline immediately. Watch for the spread between the 10-year JGB yield and the hedge-adjusted yield on US Treasuries for Japanese investors. When that spread approaches zero on a sustained basis, the repatriation calculation tips.
INDICATOR 3: WARSH’S PUBLIC COMMUNICATIONS
Kevin Warsh is new to the role and the market is still calibrating his communication style. Any speech or testimony that clarifies his view on the neutral rate — in either direction — is an event risk for the entire US yield curve. A statement moving toward 4% neutral is significantly bond-bearish. A statement moderating toward 3% neutral is bond-bullish.
INDICATOR 4: PCE INFLATION COMPONENTS
The monthly PCE release is the Fed’s preferred inflation gauge. The specific component to watch is core services ex-housing — sometimes called “supercore” — which Fed officials have identified as the most persistent component and the one most indicative of whether the inflation problem is structural or cyclical. Three consecutive months of supercore declining toward 2.5% or below would change the Scenario 1 probability materially.
INDICATOR 5: FOREIGN TREASURY HOLDINGS DATA
The Treasury International Capital (TIC) data, released monthly with a six-week lag, reports changes in foreign holdings of US Treasury securities. A sustained decline in Japanese holdings — even in the absence of active selling, through non-reinvestment of maturing bonds — is the leading indicator of the repatriation dynamic becoming structural rather than marginal. Watch for the Japan line in the TIC data.
PART IX: THE HISTORICAL CONTEXT — WHERE 5% ON THE 30-YEAR HAS APPEARED BEFORE
The 30-year Treasury yield has closed above 5% in four previous periods:
1980-2001: The post-Volcker era. Above 5% for the entire Volcker disinflation period and most of the 1980s-1990s. The decline from the 15.8% peak in September 1981 to approximately 4.5% by 2005 was the single most powerful tailwind for every financial asset in the modern era.
2007: The year of comparison. Above 5% through most of the first half of 2007 before falling sharply as the financial crisis developed. It preceded the worst financial crisis since the Depression by approximately 12 months.
2013 briefly: The Bernanke taper tantrum. Crossed 5% then retreated on policy reassurance.
2023 briefly: The fastest rate hike cycle in 40 years pushed the 30-year above 5% in October 2023. Fell back on recession fears.
2026 — Now: First sustained close above 5% since 2007. The absolute level is not historically extreme — it was above 5% for most of the 1980s and 1990s. What makes it significant is the fiscal trajectory underneath it: $36.2 trillion in debt, $1 trillion added every 100 days, a 7% of GDP deficit in a non-recessionary environment. The market accepted near-zero yields after 2008 on the understanding that fiscal conditions were manageable. It is no longer operating on that understanding.
CLOSING NOTE
The yield is speaking. It has been speaking since Hamilton issued the first bond in 1790, and every major financial event in the 236 years since has been preceded by the yield communicating something that the consensus was not hearing clearly enough.
The 30-year at 5.025% is not a prediction. The 803-day record inversion followed by a re-steepening to +47 basis points is not a prediction. The new Fed Chair’s view that the neutral rate is structurally higher than any existing model assumes is not a prediction. Japan’s $1.1 trillion in US Treasury holdings facing a changed hedging arithmetic is not a prediction.
These are measurements. The bond market is communicating them without holding a press conference, without issuing a forecast, without explaining itself or requesting that anyone listen. It says what it has to say by moving. For the trader who knows how to read the three channels simultaneously — the level, the shape, and the real yield — the communication is clear.
The question is not what the yield is saying. The question is the same one it has always been: are you listening?
Full analysis — all 17 parts, 236 years of bond market history, three scenarios with twelve specific trade setups across USD/JPY, EUR/USD, gold, US Treasuries, TIPS, and equity indices:

Comments
No comments yet. Be the first to share your thoughts!
Authentication Required
You must be logged in to post a comment.