Bar Pipa
We pay for a post of 10$

Taipei Monday: Down Ten Percent in a Single Session

Taipei Monday: Down Ten Percent in a Single Session

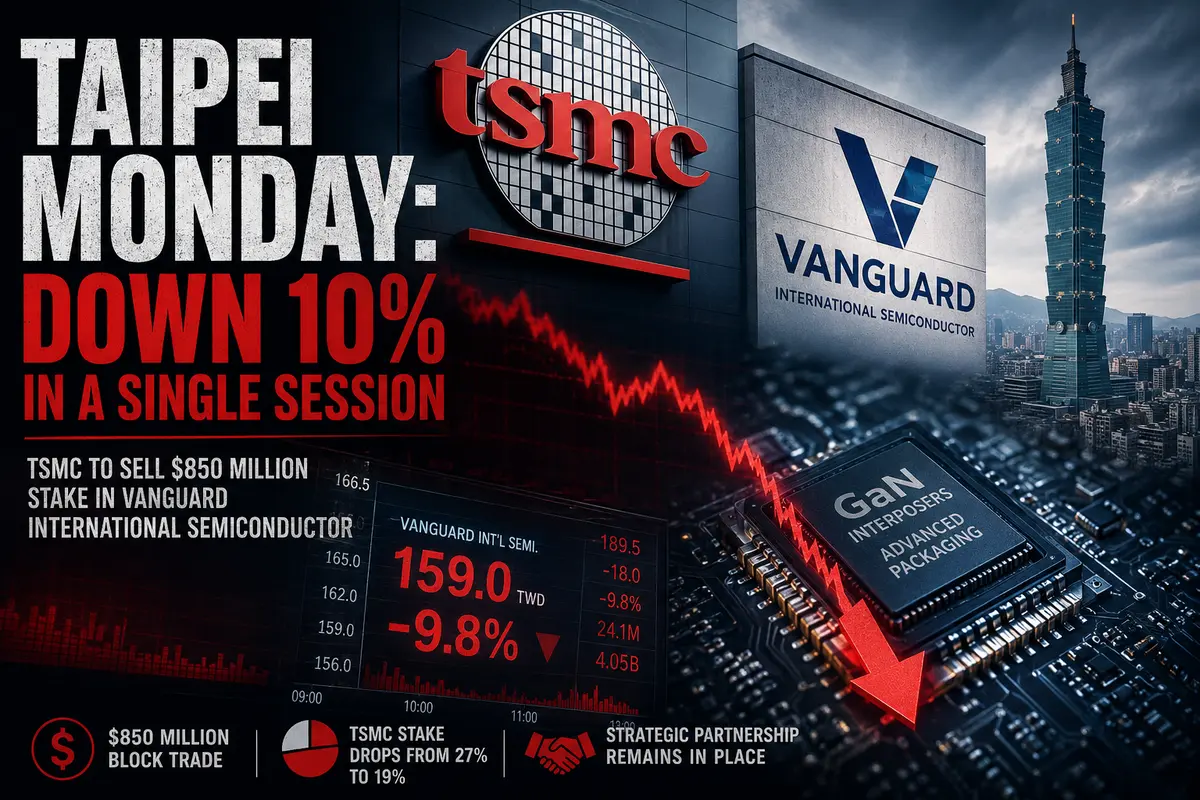
Monday morning on the Taipei exchange began with a steep dive for Vanguard International Semiconductor. The company’s shares plunged nearly ten percent, falling to 159 New Taiwan dollars apiece. For a stock that had seemed relatively stable as recently as Friday evening, the move came as a real shock. A ten-percent drop in a single trading session is not a routine correction, not a technical pullback, and not a reaction to general market noise. It is a verdict delivered by investors after learning about the decision of the company’s largest shareholder.

And that shareholder is none other than TSMC, the world’s largest contract chipmaker — a company whose very name makes competitors from Silicon Valley to Shenzhen nervous. On Friday, the giant announced plans to sell up to 152 million Vanguard shares to institutional investors through a block trade. Not gradually, not through the open market, and not with careful regard for short-term market conditions — but all at once, in a large, deliberate transaction executed with corporate precision.

The Math of the Deal: From 27% to 19%

The numbers behind the transaction are substantial. Once completed, TSMC’s stake in Vanguard will shrink from just over 27 percent to exactly 19 percent. The stake changing hands is valued at roughly NT$26.8 billion — about US$850 million at current exchange rates. Nearly a billion dollars’ worth of Vanguard shares will move to new institutional owners, while TSMC will either lock in a sizable profit or free up capital for other purposes.

Why did the market react with a selloff rather than indifference? The answer lies in investor psychology. When the company’s largest and best-informed shareholder decides to reduce its stake by nearly a third, investors inevitably interpret it as a signal. A signal that the company which knows Vanguard better than...

Continue reading...
0
0

A Month and a Half Down: Gold Falls Back to March Levels

A Month and a Half Down: Gold Falls Back to March Levels

Monday began with a heavy blow for the precious metals market. During Asian trading, spot gold plunged 1.3%, falling to $4,483.67 per ounce. This marks the lowest level since late March — a month and a half of gains and optimism erased in a single trading session. Futures performed even worse, dropping 1.7% and settling near $4,484. For those accustomed to viewing gold as an unshakable fortress during turbulent times, what is happening now feels almost like betrayal: the world is burning, yet the safe-haven asset is failing to provide safety.

But the gold market has never been a simple mechanism reacting solely to geopolitics. It has its own rules, its own internal logic — and right now, that logic is working against the metal with the same force that political crises usually work in its favor. To understand what is happening, one must step away from war headlines and look at the bond market — because that is where the main drama is unfolding, casting its shadow over precious metals prices.

Yields Not Seen in Decades

The main killer of gold on Monday was the global rise in bond yields. Not in one country or one region, but almost everywhere simultaneously, as if an invisible conductor had waved a baton and forced the world’s bond markets to move in unison.

In the United States, yields on 10-year Treasury bonds climbed to a monthly high. This is the benchmark that guides nearly every other debt market in the world, and when it rises, the consequences ripple through the entire financial system. But an even more striking signal came from Japan. Yields on Japanese 10-year government bonds reached their highest level in 29 years on Monday. Nearly three decades — longer than the careers of many traders currently sitting at their...

Continue reading...
0
0
Luis Silva

Forex Gold Trading: Strategy, Psychology, and Market Realities (XAU/USD)

Forex Gold Trading: Strategy, Psychology, and Market Realities (XAU/USD)

The Forex market provides investors with a multitude of instruments, but gold (ticker XAU/USD) traditionally holds a special place on this list. Operating simultaneously as a commodity and the world's oldest currency, gold combines the properties of a highly liquid speculative asset and a safe-haven tool during periods of global instability. Trading the "yellow metal" requires a trader to do more than just blindly follow technical indicators; it demands a deep understanding of macroeconomics, geopolitics, and the specifics of how the margin market operates.

In this article, we will break down the features of XAU/USD trading in detail, study key fundamental and technical factors, and finally, conduct an express analysis of the current market situation.

Specifics of XAU/USD as a Trading Instrument

Unlike classic currency pairs (e.g., EUR/USD or USD/JPY), gold possesses a unique intrinsic value. It cannot be printed by a Central Bank decision, and its global production is limited by natural factors. This makes gold the primary historical hedge against inflation.

On the Forex market, gold is traded against the US dollar. This means that the contract price reflects how many US dollars must be paid for one troy ounce (31.1 grams). For successful trading, a trader must consider the key characteristics of this instrument:

High Volatility: Gold is capable of moving dozens of dollars (thousands of pips) within a single trading day. This opens up huge opportunities for short-term trading (scalping, intraday) but comes with increased risks.

Global Liquidity: XAU/USD trading runs almost around the clock. The highest activity and sharpest movements occur during the American session when the New York exchanges open (specifically COMEX), as well as at the crossover of the European and American sessions.

Dependence on the US Currency: Because gold is quoted in dollars, there is a long-term inverse correlation between the...

Continue reading...
0
0
Anton Algo

Mean Reversion in the Forex Market

Mean Reversion in the Forex Market
Trading Bollinger Bands and Overbought/Oversold Zones

The mean reversion strategy exploits a statistical regularity: after a strong deviation, the price tends to revert to its mean value. In the forex market, this idea appeals to traders due to its apparent simplicity—buy "cheap," sell "expensive." However, behind this apparent ease lie strict mathematical conditions, the violation of which turns a profitable system into a loss generator. Let’s examine which pairs are truly prone to reversion, how to confirm it statistically, and why the absence of a stop-loss is deadly dangerous.

Which Pairs Are Prone to Mean Reversion

orex instruments are heterogeneous in nature. Majors such as EURUSD, USDJPY, and GBPUSD exhibit pronounced trending movements, especially during periods of monetary policy divergence. Mean reversion works on them only fragmentarily—mainly during the Asian session or in periods of low volatility when the market is consolidating. Non-dollar cross rates (EURGBP, EURCHF, AUDNZD) have historically shown a stronger tendency toward stationarity, as their dynamics are driven by the difference between two non-dollar economies, not subject to global capital flows with the same intensity. Pairs involving the Swiss franc, particularly EURCHF, deserve special attention: the Swiss National Bank long maintained a currency ceiling, and even after its removal, the pair still exhibits periods of sustained reversal. Exotic pairs like USDSGD or USDHKD often have managed exchange rates, making them attractive for mean-reversion systems, but low liquidity and wide spreads eat away potential profits.

Instrument selection is a critical step. Do not apply reversal logic to a pair in a long-term fundamental trend. For example, USDTRY has shown a sustained upward trend in recent years due to the Turkish central bank’s inflationary policies, and any attempt to catch reversals is doomed.

Statistical Tests for Stationarity: ADF and the Dickey-Fuller Test

Stationarity is a property of a time...

Continue reading...
0
0
Lin Brings

Morning Explosion in Asian Trading

Morning Explosion in Asian Trading

Monday began with a sharp surge in oil prices. As soon as Asian markets opened, July futures for North Sea Brent crude jumped 1.3%, reaching $110.71 per barrel. For early morning trading, when liquidity is still relatively thin, this is a highly significant move. It indicates that a buildup of news over the weekend was bound to spill over into prices.

Traders arriving at their desks in Tokyo, Singapore, and Shanghai were greeted by a troubling picture on their terminals: oil was climbing again, the geopolitical fire in the Middle East showed no signs of cooling, and diplomatic efforts had yet to produce meaningful results. While they were sipping their morning coffee, algorithmic trading systems were already pricing in a new phase of escalation.

Drone Over Barakah: An Attack That Changes the Rules

The key trigger behind the morning spike was an event that at first glance might have seemed like a local incident, but in reality carries far-reaching implications. On Sunday, drones struck a facility near the Barakah nuclear power plant in the United Arab Emirates. The fire that broke out after the attack was contained, but the aftermath left a far deeper impact than the material damage itself.

Barakah is not just a power plant. It is the first and only operational nuclear power station in the Arab world, a symbol of the UAE’s technological ambitions, and a site under close scrutiny from international nuclear safety regulators. A drone strike near such a facility represents an entirely new level of escalation. This is no longer about tankers in the Persian Gulf or oil infrastructure. It is about the potential for a nuclear catastrophe in a densely populated region, and the market reacted accordingly — as a signal that the conflict has entered a far more dangerous phase.

According...

Continue reading...
0
0

The Silent Battle for the Yen

The Silent Battle for the Yen

Japan is once again fighting for its currency. This time quietly — without loud ministerial statements or dramatic press conferences. But the numbers emerging from banking analytics speak for themselves. According to estimates by Citi, the Japanese government has already spent around 10 trillion yen over the past few weeks buying its national currency. In dollar terms, that is roughly $63 billion. Sixty-three billion dollars disappearing into the foreign exchange market within days — a scale that is hard to comprehend, yet that is the price Tokyo is paying to convince the world that the yen should not be cheap.

The data on current deposits at the Bank of Japan are the breadcrumbs analysts use to trace invisible interventions. The central bank does not loudly announce its actions, but statistics do not lie. On April 30, about 5 trillion yen disappeared from deposits, and between May 1 and May 6 another 5 trillion vanished. Ten trillion in two weeks. These are not random liquidity fluctuations — they are the footprints of the currency regulator’s heavy boots on the sands of the money market.

Why now: the specter of 160 yen per dollar

The trigger for the intervention, as in previous episodes, was the psychological level of 160 yen per dollar. This appears to be the red line Japanese financial authorities cannot tolerate. Once USD/JPY crosses it, alarm bells go off in Tokyo and the intervention machinery swings into action.

After the intervention, the pair obediently fell toward 155 yen. A temporary reprieve bought with billions of dollars. But by the beginning of the current week, the exchange rate had sharply rebounded and climbed back toward 158 yen per dollar. The market, like a stubborn beast, lay down for a moment, caught its breath, and began rising again. This is the...

Continue reading...
0
0
NorthRay

My First Full Lot Made Me $23.50. And Now I’m Looking at Oil, Gold, and Apple.

My First Full Lot Made Me $23.50. And Now I’m Looking at Oil, Gold, and Apple.

Yes, I’m Expanding My Horizons.

Hi, this is NorthRay.

Remember when I said I wanted to try opening a trade with one full lot?

Well, I did it.

And you know what? I didn’t blow up my account. My trade hit take profit.

Profit: $23.50.

So far, this is my biggest “win” on demo.

But instead of sitting back and celebrating, I’m already looking in a new direction. Because currency pairs are only the beginning.


How the 1-Lot Trade Ended

I opened a EUR/USD trade. Lot size — 1.0. Stop-loss and take-profit were mandatory (thanks to previous lessons).

Honestly? It was scary.

Every time the price moved 10–15 pips, my brain instantly calculated:
“That’s already plus or minus $100–150.”

I literally had to sit on my hands to avoid closing the trade too early. I trusted my plan.

And the market rewarded me.

Price reached my take-profit level. The trade closed automatically. That green $23.50 number appeared on my terminal.

I exhaled.

It’s not life-changing money. But for me, it was a signal:
“You’re growing. You’re learning. You’re moving in the right direction.”


But Something Started to Bother Me

After that trade, I sat down and started thinking.

I only trade EUR/USD. Just one currency pair. I already feel like I can “read” it. I’m beginning to understand its personality.

But trading is much bigger than just the euro and the dollar.

There’s also:
— Oil (Brent, WTI)
— Gold (XAU/USD)
— Silver
— Company stocks: Apple, Tesla, Amazon, Google, Microsoft

And honestly? I know almost nothing about them.

What if there are opportunities there too?
What if my strategy works outside of forex?
What if I’m missing something important?

So I decided: it’s time to expand.


What Commodities Are — And Why They Attract Me

For...

Continue reading...
0
0
Anton Algo

Automated trading systems are rapidly displacing humans from financial markets

Automated trading systems are rapidly displacing humans from financial markets

Behind this process lies not a mere trend, but the objective technological superiority of algorithms over human traders. Let us examine the key advantages of trading robots that make them a more effective profit-generating tool.

Emotional Sterility

A trader's worst enemy is not volatility, but their own emotions. Fear of missing out (FOMO) pushes them into overheated assets; greed prevents timely profit-taking; hope keeps them in a clearly losing position until their account is wiped out. Humans are biologically incapable of fully suppressing their emotional background when making decisions, as the same brain regions govern both financial risk and physical threats.
A trading robot has no hormonal system. It knows nothing of panic during a sharp price drop, euphoria from a string of winning trades, or frustration after a stop-loss. The algorithm operates strictly according to its embedded mathematical model, evaluating only numerical market parameters. Concepts like "annoying" or "lucky" do not exist for it. This sterility eliminates affective errors, which account for up to eighty percent of retail traders' losses.

Impeccable Discipline

Developing a profitable strategy is not enough. The main challenge is adhering to its rules for months on end, despite a series of temporary setbacks. Humans tend to subjectively overestimate market situations: after three losing trades in a row, they either miss the fourth, objectively correct signal, or start trying to get revenge on the market by doubling their position size.
A robot never tires of routine and never loses faith in its strategy. If the system dictates opening a short position when moving averages cross, it will execute that action regardless of the prevailing news or sentiment. The algorithm will never attempt to "improve" a signal based on intuition, as it has no illusion of its own superiority over statistics. This mechanical adherence is precisely what...

Continue reading...
0
0
Tom Maffin

The Milan Outlier in a Blood-Red Market

The Milan Outlier in a Blood-Red Market

While Italy’s FTSE MIB opened down 1.15% and the pan-European STOXX 600 slid 1.4%, one stock on the Milan exchange traded as if the broader market meltdown simply didn’t exist. Shares of Technoprobe surged 31% to €25.84 and, at the session high, touched a new yearly peak of €27.40. This wasn’t just a rally — it was a full-blown rocket launch moving against the gravity of the entire market.

The contrast with the broader backdrop was striking enough to make even veteran traders do a double take. Europe’s technology sector was down 3%, materials stocks had dropped 4.3%, yet Technoprobe kept climbing, ignoring geopolitical tensions, stalled US-Iran talks, and fears of disruptions in the Strait of Hormuz. To understand why, you had to look at the numbers the company released before the market opened.

A Quarterly Report That Blew Past Expectations

Technoprobe’s first-quarter 2026 results weren’t merely solid — they were record-breaking. Consolidated revenue came in at €187 million, up 19% year over year. For a mature industrial company, that kind of growth is serious. Those are the sorts of numbers you expect from young tech startups, not established equipment manufacturers.

But the real surprise was EBITDA. Earnings before interest, taxes, depreciation, and amortization reached €69.2 million. Roughly speaking, that puts EBITDA margin near 37% — the kind of profitability usually associated with software companies, not makers of physical hardware. It showed that Technoprobe wasn’t just selling more; it was doing so with increasing efficiency, keeping costs under control and extracting more profit from every euro of revenue.

Earnings per share also beat expectations. Analysts had been looking for €0.08, while the company delivered €0.09 — a 12.5% beat. In a market where companies are often praised for beating estimates by fractions of a percent, a double-digit surprise sends a...

Continue reading...
0
0

Italy’s Inflation Revision Caught Markets Off Guard

Italy’s Inflation Revision Caught Markets Off Guard
Why One-Tenth of a Percentage Point Became Important for All of Europe

When Italy’s national statistics agency ISTAT released revised inflation data for April on Friday, nothing dramatic seemed to happen at first glance. The preliminary estimate for annual inflation under the harmonized HICP index stood at 2.9 percent, while the final figure came in at 2.8 percent. The difference was just one-tenth of a percentage point. To someone far removed from financial markets, that may look like an accounting detail nobody should care about. But today, it is precisely these “small details” that move bond markets, reshape investor expectations, and force central bankers to study statistical reports line by line.

The modern financial system operates in a state of extreme sensitivity. When the economy is balancing between slowing growth and the threat of a new inflation wave, any deviation from forecasts becomes a signal. Sometimes a single number is enough to sharply alter expectations for interest rates, government bond yields, or the euro exchange rate. That is why the revision of Italy’s inflation data turned out to be far more significant than it initially appeared.

April’s Inflation Surge Looked Too Sharp

The dynamics of April itself look troubling. As recently as March, Italy’s HICP inflation stood at 1.6 percent year-over-year. One month later, it had jumped to 2.8 percent. An increase of 1.2 percentage points in such a short period is not a normal fluctuation — it is a sharp acceleration. And the issue goes beyond the numbers themselves. For Italy, inflation is almost a painful topic because the country’s economy is especially vulnerable to external shocks.

Italy has been living in a state of chronic economic fatigue for years. Formally, it is the eurozone’s third-largest economy, a country with a powerful industrial base, famous global brands, a massive...

Continue reading...
0
0
Navigation menu
instaforex banner