Forex Gold Trading: Strategy, Psychology, and Market Realities (XAU/USD)
The Forex market provides investors with a multitude of instruments, but gold (ticker XAU/USD) traditionally holds a special place on this list. Operating simultaneously as a commodity and the world’s oldest currency, gold combines the properties of a highly liquid speculative asset and a safe-haven tool during periods of global instability. Trading the “yellow metal” requires a trader to do more than just blindly follow technical indicators; it demands a deep understanding of macroeconomics, geopolitics, and the specifics of how the margin market operates.
In this article, we will break down the features of XAU/USD trading in detail, study key fundamental and technical factors, and finally, conduct an express analysis of the current market situation.
Specifics of XAU/USD as a Trading Instrument
Unlike classic currency pairs (e.g., EUR/USD or USD/JPY), gold possesses a unique intrinsic value. It cannot be printed by a Central Bank decision, and its global production is limited by natural factors. This makes gold the primary historical hedge against inflation.
On the Forex market, gold is traded against the US dollar. This means that the contract price reflects how many US dollars must be paid for one troy ounce (31.1 grams). For successful trading, a trader must consider the key characteristics of this instrument:
-
High Volatility: Gold is capable of moving dozens of dollars (thousands of pips) within a single trading day. This opens up huge opportunities for short-term trading (scalping, intraday) but comes with increased risks.
-
Global Liquidity: XAU/USD trading runs almost around the clock. The highest activity and sharpest movements occur during the American session when the New York exchanges open (specifically COMEX), as well as at the crossover of the European and American sessions.
-
Dependence on the US Currency: Because gold is quoted in dollars, there is a long-term inverse correlation between the price of XAU/USD and the US Dollar Index (DXY). If the dollar strengthens on the back of tight Fed monetary policy, gold generally depreciates, and vice versa.
Fundamental Factors Influencing Gold Prices
Fundamental analysis for gold is fundamentally different from analyzing stocks or currencies. Gold has no dividends, quarterly reports, or GDP figures. Its price is formed at the intersection of investment demand, monetary policy, and global risks.
1. Central Bank Monetary Policy and Interest Rates
This is the key driver of long-term trends. Gold is a non-yielding asset; it does not bear interest income, unlike government bonds or bank deposits. Therefore, the dynamics of real interest rates (nominal rate minus inflation) are critically important. When central banks (primarily the US Federal Reserve) raise interest rates to fight inflation, the yield on government bonds (Treasuries) rises. It becomes more profitable for investors to hold cash in secure US debt securities than in “gold bullion.” During such periods, gold comes under pressure. Conversely, if rates fall, gold begins to rise sharply.
2. Inflation and Stagflation
Gold is often called the “anti-dollar.” When fiat (paper) currencies depreciate due to excessive money printing or energy crises, investors flee to real assets. However, there is an important nuance here: if inflation rises but central banks aggressively hike rates in response, gold can fall due to rising bond yields. But if stagflation sets in (a situation where inflation is high while the economy stagnates and rates cannot be raised), gold demonstrates explosive growth.
3. Geopolitical Risks and Safe-Haven Status
In times of military conflict, trade wars, sanctions standoffs, and political crises, capital seeks refuge. Historically, the ultimate refuge is gold. Large funds and private investors close risky positions in equities and move funds into XAU, triggering sharp, impulsive price spikes on the chart.
4. Demand from Central Banks and ETF Funds
In recent years, global central banks (especially regulators in emerging markets) have been actively diversifying their foreign exchange reserves by buying physical gold by the ton. This creates a powerful fundamental “floor” for the price, preventing the metal from depreciating deeply even during periods of rising rates. Traders monitor the holdings of the largest gold ETFs (such as SPDR Gold Shares) on a weekly basis: capital inflows into these funds confirm institutional buying interest.
Technical Analysis of XAU/USD
Due to its massive trading volumes, gold is one of the most “technical” instruments in Forex. The XAU/USD chart responds exceptionally well to classic chart patterns and indicator analysis.
Support and Resistance Levels
Psychological round levels (e.g., $4000, $4500, $5000) play a colossal role. Large buy or sell orders, as well as protective stop-losses, always cluster around these marks. A breakout of an All-Time High often leads to a strong acceleration impulse, as there are no historical resistance levels above that price, triggering a classic fear of missing out (FOMO).
Trend Indicators and Oscillators
-
Moving Averages (MA): To determine the global trend on the daily (D1) and weekly (W1) timeframes, traders use the 50-day and 200-day MAs. A crossover of these averages (a “Golden Cross” or “Death Cross”) often signals a change in the long-term trend.
-
RSI (Relative Strength Index) and Stochastic: These help identify zones of extreme overbought or oversold conditions. Gold can remain in an overbought zone for weeks during a powerful trend, so it is more effective to use oscillators on XAU/USD to look for divergences (discrepancies between price movement and the indicator).
Price Action Patterns and Liquidity
On hourly timeframes (H1, H4), gold is prone to forming false breakouts (liquidity sweeps). Large players frequently “hunt” the stop-losses of retail traders just beyond local levels before reversing the price. Price Action patterns (such as the “pin bar,” “engulfing,” or “inside bar”) near key support/resistance zones offer the most reliable entry points with a tight stop-loss.
Express Analysis of XAU/USD for May 18, 2026
To illustrate how these factors work in practice, let us look at the current market situation as of May 18, 2026.
Fundamental Factors (In a Nutshell)
The market is experiencing strong medium-term pressure on gold quotes. A prolonged geopolitical crisis in the Middle East (specifically, the conflict between the US and Iran) has led to a sharp spike in energy prices (Brent crude is holding at high levels). This energy shock has begun to actively feed into broader global inflation.
In response to these inflationary risks, yields on 10-year US Treasuries and bonds from other developed nations have soared to multi-year highs. Markets are pricing in a scenario where the US Federal Reserve will not only refrain from cutting interest rates in 2026 but may even implement additional hikes. As a result, the US Dollar Index (DXY) is on a powerful rally. Despite its safe-haven status, gold is falling under the weight of rising real rates, losing its investment appeal compared to the yielding dollar and government bonds.
Technical Analysis (In a Nutshell)
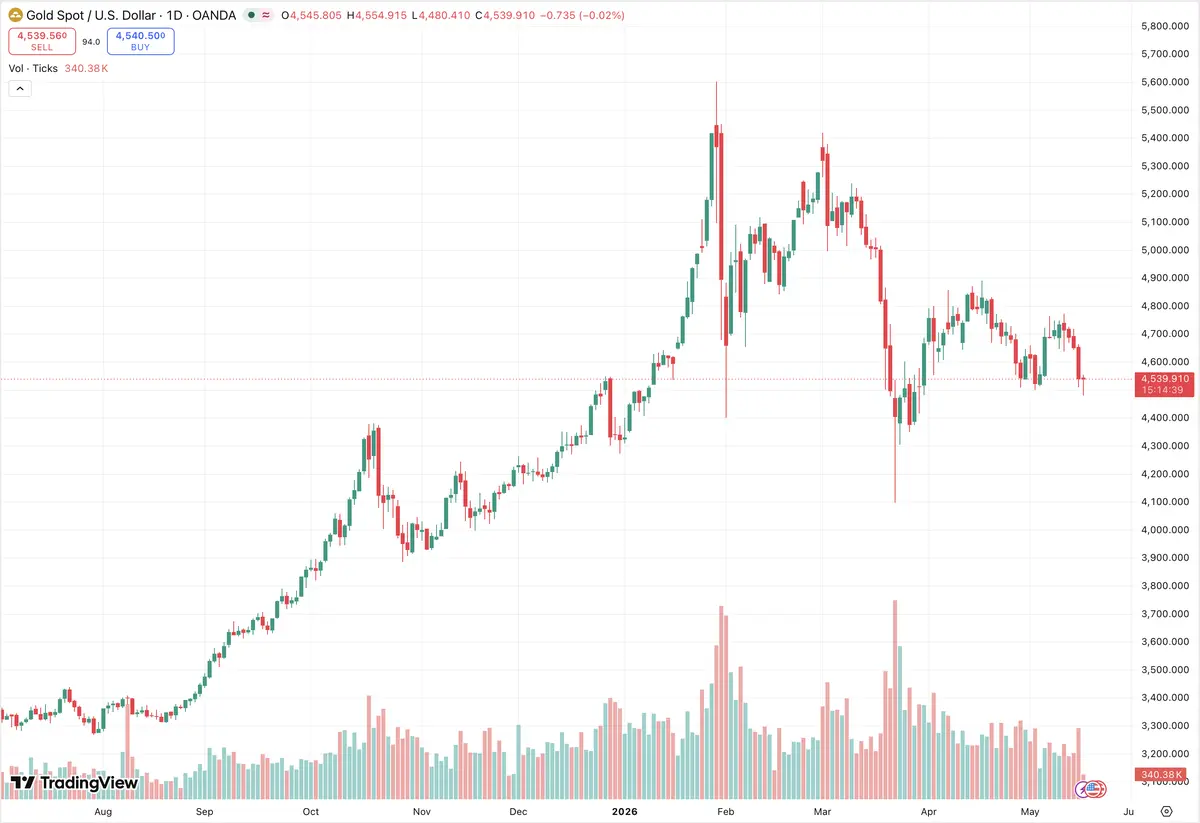
A steady short- and medium-term downtrend is developing on the XAU/USD chart. Last week, gold posted its worst performance in two months, hitting a one-and-a-half-month low and settling below key short-term moving averages. The price has closed in on the psychologically important support area of $4500.
-
Current Quotes: The price is fluctuating in the range of $4535–$4542 per ounce.
-
Indicators: The 14-day RSI on the daily chart is recovering from the oversold zone (around 42), while the MACD indicator sits in negative territory, confirming the strength of the sellers. Most moving averages (from the MA20 to the MA200) on the daily interval signal a sell.
-
Nearest Levels: Key resistance is located in the $4555–$4565 zone. The primary support is the $4500 level.
Conclusion: Market Situation Summary for May 18, 2026
XAU/USD in a nutshell today:
The global trend remains under selling pressure. Rising oil prices due to the conflict surrounding Iran have triggered an inflationary wave, driving up US bond yields and strengthening the dollar, stripping gold of its support.
Technically, the asset is in a downtrend, balancing just above the critical $4500 level. A local technical bounce upward (correction) toward $4555–$4565 is likely in the coming days, where sellers may look to re-engage with large positions for a final assault to break below $4500. Long-term buyers should not rush into positions until signs of a softer stance from the Fed emerge.

Comments
No comments yet. Be the first to share your thoughts!
Authentication Required
You must be logged in to post a comment.