Bar Pipa
We pay for a post of 10$

Metals

The Correlation Between the Dollar and Oil Has Hit a Historic Record Amid War

The Correlation Between the Dollar and Oil Has Hit a Historic Record Amid War
Why the Market Has Entered an Unusual Phase

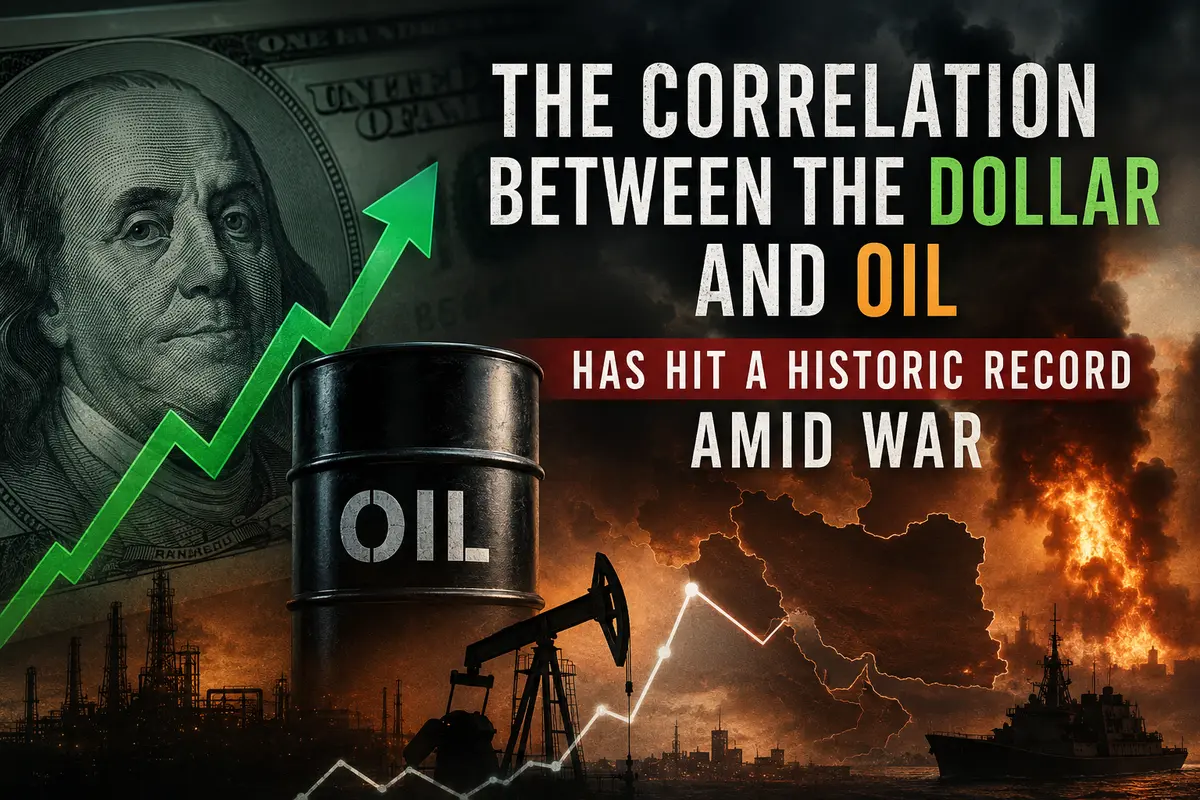
Until recently, the idea that the US dollar and oil prices could rise almost in perfect sync seemed nearly absurd to most market participants. For decades, the global financial system operated under a different logic: a stronger dollar typically pressured commodities lower, while expensive oil was often associated with a weaker American currency. This relationship was considered one of the market’s unwritten rules.

But the current conflict in the Middle East has not simply disrupted that pattern — it has effectively turned it upside down.

Over the past several weeks, global markets have been pushed into a state of exceptional tension. The military escalation involving Iran and the disruption of critical shipping routes have triggered a serious shock throughout the global energy system. The Strait of Hormuz is not just another point on the map. A massive share of the world’s oil exports passes through this narrow corridor. Any threat to navigation in the region immediately alarms investors because they understand that the consequences extend far beyond a local conflict.

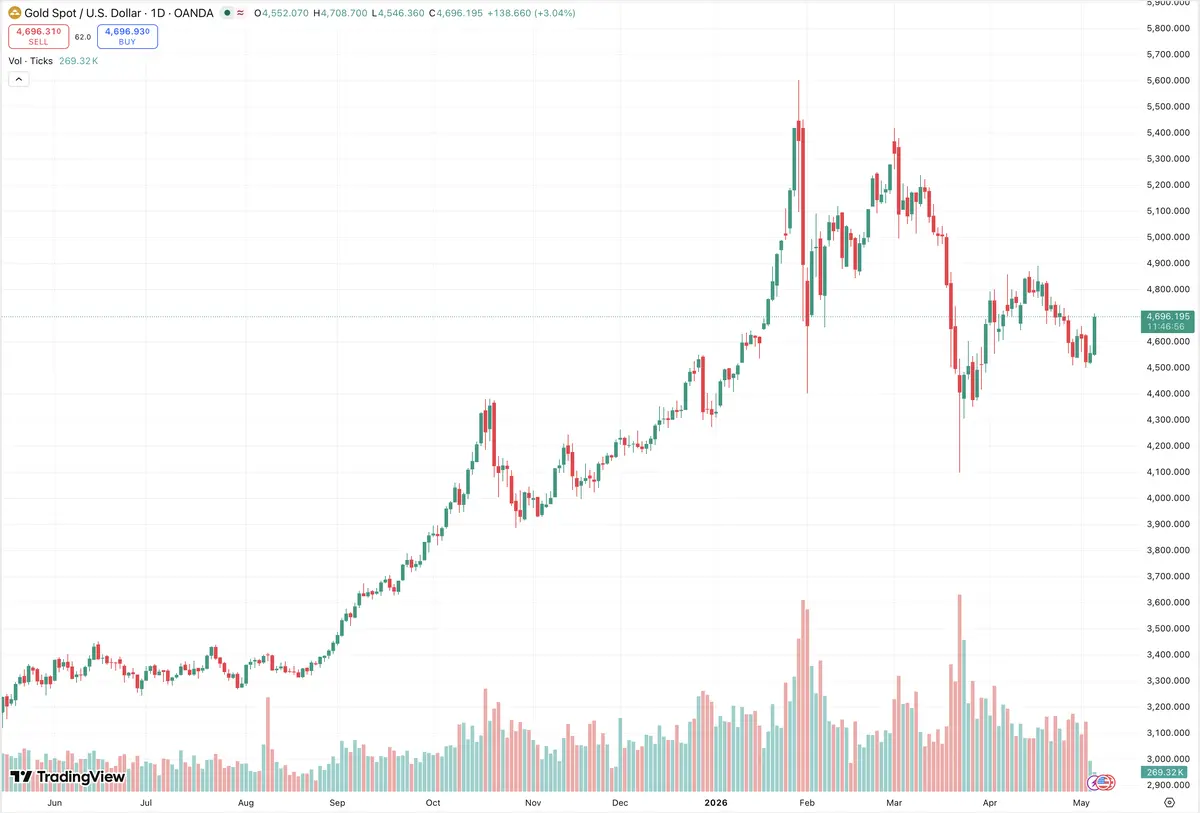
Oil Prices Are Rising on Fears of Supply Shortages

Against this backdrop, Brent crude prices have surged dramatically. A nearly 45% increase in just a few months is no ordinary market fluctuation — it is the kind of move typically seen during periods of global crisis.

What makes this rally especially important is that oil is not climbing because the global economy suddenly needs more energy. In fact, many economies are slowing down. The main driver is fear — fear that physical supply could become severely constrained.

Whenever traders believe that oil flows may be disrupted, prices begin to include a “risk premium.” The higher the probability of further escalation, the larger that premium becomes. As a result, oil prices are currently...

Continue reading...
0
0

Four Days of Decline: Gold Loses Its Shine

Four Days of Decline: Gold Loses Its Shine

Gold ended the week deep in the red on Friday. It marked the fourth consecutive losing session — a stretch the precious metals market has not seen in quite some time. Spot prices slipped another 0.7% and hovered near $4,620 per ounce in early trading. Futures performed even worse, plunging 1.3% to around $4,624. Looking at the week as a whole, the picture is grim for the bulls: gold lost roughly 2% over five trading days.

For an asset traditionally viewed as a safe haven, this behavior looks unusual. But that very unusualness is the story. Gold is currently trapped between two grinding forces: a strengthening U.S. dollar on one side and shifting expectations around Federal Reserve interest rates on the other. As long as those forces continue turning, the metal keeps sliding lower despite the geopolitical fears that would normally send it soaring.

The Dollar Flexes Its Muscles

The U.S. Dollar Index gained another 0.3% during Asian trading on Friday, climbing to a two-week high. For the week, the greenback was on track to rise more than 1% — a sharp reversal after months of speculation that the dollar was losing its dominance amid budget concerns and political instability in the United States.

But economic data released throughout the week shattered those bearish narratives. One report after another exceeded analyst expectations. Producer prices in April posted their strongest annual increase in four years. Four years is a long time in economic terms — enough for supply chains, consumer behavior, and entire market structures to change dramatically. Consumer inflation also came in hotter than expected, while retail sales painted a picture of an American consumer who continues spending despite expensive energy and broad uncertainty.

Under different circumstances, this combination of data might have fueled a rally in equities and perhaps...

Continue reading...
0
0

Gold Pulls Back During Asian Trading

Gold Pulls Back During Asian Trading

Gold futures headed lower during the Asian session on Wednesday, snapping a recent stretch of choppy trading near the elevated levels reached earlier. The COMEX division of the New York Mercantile Exchange recorded a decline in June gold contracts, which settled at roughly $4,707.57 per troy ounce, down about 0.45% at the time of writing.

The session kicked off with the metal searching for a foothold. The intraday low plunged well below the opening levels, and gold was forced to test support around the 4,646.01. A narrow corridor emerged, and the metal spent the entire morning trading within this confined range.

Why is this happening now? Gold is highly sensitive to the mood surrounding the U.S. dollar, and the greenback was sending mixed signals on Wednesday. The U.S. Dollar Index, which measures the dollar's strength against a basket of six major currencies, was barely changed — trading at 98.20, down just 0.02%. On the surface, any slight dollar weakness should nudge gold higher. Instead, investors seemed to hit the pause button, clearly unwilling to pile into aggressive positions ahead of the next batch of macroeconomic news.

Silver and Copper: A Sharp Divergence

While gold was slipping moderately, the silver market was undergoing a far steeper correction. July silver futures tumbled 1.59%, hitting $86.95 per troy ounce. For silver, which often moves in gold's wake but with larger swings, this kind of drop wasn't a shock. When the market gets jittery, industrial demand forecasts for the white metal often get revised downward, and speculators rush to lock in profits.

The copper market told a completely different story. July contracts on this key industrial metal instead rose by 0.26%, climbing to $6.65 per pound. Copper has been living a life of its own lately, paying...

Continue reading...
0
0

Metals Market Today: Investors Move Into Gold While Industrial Metals Wait for Signals From China

Metals Market Today: Investors Move Into Gold While Industrial Metals Wait for Signals From China

The global metals market is entering the middle of May with investors still unsure about where the economy goes next. After months of sharp swings across commodities and financial markets, traders are becoming more selective. Money is flowing back into safer assets like gold, while industrial metals are struggling to regain momentum.

Right now, everything comes down to a few major questions: Will the Federal Reserve finally start cutting interest rates? Can China revive demand in construction and manufacturing? And is the global economy slowing down more than expected?

Those questions are driving nearly every move across the metals market — from gold and silver to copper, aluminum, and nickel.

Gold Keeps Winning the Attention

Gold continues to trade near historic highs and remains the strongest part of the metals market. Investors are still looking for protection against economic uncertainty, stubborn inflation, and geopolitical risks.

There’s also growing belief that the US Federal Reserve may eventually ease interest rates later this year. That matters because lower rates usually weaken bond yields and make gold more attractive.

What’s interesting this time is that gold has stayed strong even while the dollar remains relatively expensive. In previous years, a stronger dollar would normally push gold lower. But the market mood has changed. Investors are less focused on short-term currency moves and more focused on preserving capital.

Central banks are also helping support prices. Several countries continue adding gold to reserves as governments try to reduce dependence on the US dollar and protect themselves from financial instability.

At the same time, geopolitical tensions continue to keep traders nervous. Every new headline involving conflicts, trade disputes, or political uncertainty quickly sends buyers back into safe-haven assets.

Silver Is Moving With Gold — But More Carefully

Silver is benefiting from the same safe-haven demand supporting...

Continue reading...
0
0
Luis Silva

Forex Gold Standard 2026: XAUUSD Analysis for May 08

Forex Gold Standard 2026: XAUUSD Analysis for May 08
Gold trading on the Forex market (ticker XAUUSD) has fully cemented its status as the most volatile and strategically important instrument by 2026. For a trader, gold is not just a metal — it is a "fear barometer" and simultaneously an indicator of the US dollar's real value. The date May 8, 2026, is marked in red on the trading calendar because it combines the end of the spring asset reallocation cycle with the release of key US macroeconomic data. Global Context and Expectations for May 8, 2026 The expected price range for the current trading day is 4,509 – 4,509 – 4,821 per troy ounce. The central price pivot point stands at $4,665. Why these numbers? By mid-2026, the global financial system has entered a phase of "new normalcy," where gold is worth twice as much as at the beginning of the decade due to chronic fiat currency devaluation. May 8 is a Friday — the day of the Non-Farm Payrolls (NFP) report. In 2026, the impact of this report on XAUUSD has intensified: because of automation and changes in the US economic structure, any deviations in employment figures trigger instantaneous price spikes of 500 – 800 pips. We expect the market to remain in a narrow range until 15:30 Moscow time, followed by a powerful breakout of one of the range boundaries. Fundamental Analysis: Macroeconomics and Geopolitics Fed Monetary Policy: By this point, the US Federal Reserve is facing a dilemma: service sector inflation remains stuck at 4.5%, while economic growth is slowing. The market is waiting for a signal of a rate cut. If the May 8 employment data shows figures below 60,000 new jobs, the dollar will begin a sharp decline, pushing XAUUSD toward its all-time high of $4,850. Central Bank De-dollarization: During the first quarter...
Continue reading...
0
0
Luis Silva

Trading Session: May 7, 2026

Trading Session: May 7, 2026
This forecast is based on futures market data, fundamental shifts, and the technical outlook. Additionally, it addresses key macroeconomic drivers expected to shape the dynamics of XAU/USD over the next 24 hours. Market Drivers: Geopolitics vs. Macroeconomics The pivotal event shaping gold's (XAU/USD) trajectory leading up to May 7 has been a shift in market drivers. While earlier in 2026 the metal rallied as a classic safe-haven asset against the backdrop of the military conflict between the U.S. and Iran, market focus has now shifted toward the Federal Reserve's monetary policy. Investors are currently pricing in news regarding the potential imminent cessation of hostilities. Reports circulating in the media — detailing a 14-point Memorandum of Understanding between Washington and Tehran that includes a suspension of uranium enrichment and the restoration of shipping through the Strait of Hormuz — have triggered a sharp plunge in oil prices. The decline in energy prices has instantly dampened inflationary expectations. The market now perceives that the Federal Reserve's need to keep interest rates at their peak for an extended period is diminishing. According to recent data, the probability of a rate hike by year end previously estimated at around 35% — has dropped sharply, giving way to expectations of at least one round of monetary policy easing. The U.S. dollar has begun to lose ground, retreating toward pre-conflict levels, thereby creating a favorable environment for dollar-denominated gold. At the same time, strategists at MS warn that this current euphoria could soon give way to disappointment. Should the conflict drag on — and if the Federal Reserve maintains its hawkish rhetoric — gold could once again face downward pressure from rising bond yields. The real yield on 10-year U.S. Treasury Inflation-Protected Securities (TIPS) remains above the key 1.85% threshold, thereby limiting the appeal of non-yielding...
Continue reading...
0
0
Anton Algo

Why an Advisor Saves Your Deposit When the Market Crashes: A Black Swan Analysis

Why an Advisor Saves Your Deposit When the Market Crashes: A Black Swan Analysis
The market loves to lull you to sleep. Months of steady growth, familiar patterns, analysts whispering about a "new era of stability" — and suddenly your deposit seems like an impregnable fortress. But Nassim Taleb's Black Swan theory is relentless: the very thing no one believes in sweeps everything in its path. COVID-19 in 2020, oil prices crashing into negative territory in 2021, sudden major bank defaults in 2023. In these moments, traders don't lose because they have bad strategies. They lose because they are human. And that's when the machine steps onto the stage. Impartial, fast, and governed by mathematics. In this article, we will dissect the main paradox of trading: why, during the hours of disaster, your greatest asset is a properly configured advisor — not your intuition. The Anatomy of Panic: Why Humans Lose to the Black Swan To understand the value of a robot, you must honestly acknowledge your own weaknesses. In a market crash, the human brain is, unfortunately, not your ally. Evolution gave us a "fight or flight" response but forgot to program a playbook for a market meltdown. When the chart moves two to three percent per minute, adrenaline surges through a trader's blood, followed by cortisol. Fear hormones paralyze your will. A scenario familiar to every live trader: Stop-loss postponed "for a second." You see price pierce your level. Instead of taking the loss, you tell yourself: "It'll reverse now." The market doesn't reverse. It accelerates. The Ostrich Effect. The trader closes the terminal, hoping everything will resolve by tomorrow. This is psychological defense that guarantees a blow-up. False averaging. Wanting to win back losses, the trader doubles down on a falling market, trying to "catch the bottom." There is no bottom. Only a margin call. A human in a crisis is...
Continue reading...
0
0
Luis Silva

XAUUSD May 6, 2026: Gold Battles for $4700, But the Risk Pendulum Still Swings

XAUUSD May 6, 2026: Gold Battles for $4700, But the Risk Pendulum Still Swings
Gold trading against the US dollar on May 6, 2026, is characterized by a corrective recovery following a sharp monthly pullback. XAUUSD quotes have bounced from the psychological 4500 mark and, by mid − European session, are testing the 4500 mark and, by mid − European session, are testing the 4650–$4685 zone. The market is fueled by hopes of de-escalation surrounding Iran alongside a cooling US labor market. This creates a complex cocktail for the precious metal: it receives short-term support, but medium-term risks remain firmly in place. Traders should carefully select take-profit levels by relying on a clear synthesis of fundamentals and technicals. Fundamental Snapshot – Three Pillars and One Hidden Brake The first pillar is the geopolitical pause. Trump's announcement to suspend "Project Freedom" operations and willingness for direct dialogue with Tehran sharply reduced the "fear premium" in the oil market. Brent futures fell below the $75 mark, and the dollar, counter to usual logic, is correcting downward as markets price in a lower probability of military escalation and a sharp inflation spike. For dollar-denominated gold, this is a short-term positive. The second pillar is the softening of the American labor market. Yesterday's JOLTS data (6.866 million job openings) missed the consensus forecast. Today's ADP report (forecast 99k) may confirm a slowdown in hiring, and Friday's Nonfarm Payrolls could come in weaker than expected. Any deterioration in employment statistics diminishes fears of Federal Reserve monetary tightening. Although CME Fed Watch still shows a 35 percent probability of a rate hike in December, clear labor market weakness could push this figure below 25 percent, supporting gold. The third pillar is structural central bank demand. The People's Bank of China has been increasing its reserves for the fifth consecutive week, buying physical metal on dips below 4600. Central banks of...
Continue reading...
0
0
Luis Silva

XAUUSD Forecast for May 5, 2026

XAUUSD Forecast for May 5, 2026

Gold (XAUUSD) trading this week will be shaped by a complex interplay of geopolitical risks, the Fed’s hawkish monetary policy, and key technical levels. Below is a concise overview of the key factors, the expected price range, and practical take-profit recommendations.


Fundamental Background: Oil Shock and a Hawkish Fed

The main fundamental driver for gold in May 2026 is the fallout from the geopolitical crisis in the Middle East. The blockade of the Strait of Hormuz and the rise of Brent crude to $118 per barrel have triggered a supply shock and a sharp acceleration in global inflation. Instead of enhancing gold’s appeal as a safe-haven asset, this shock has backfired: inflation is forcing the Fed and other central banks to keep rates higher for longer, increasing the opportunity cost of holding non-yielding bullion. Expectations for a rate cut in 2026 have all but disappeared, and the futures market is already pricing in a 24% probability of a rate hike by April 2027. The upcoming inauguration of new Fed Chair Kevin Warsh (May 15) only reinforces the market’s hawkish sentiment.

Adding to the downward pressure on prices is the fragile, yet still present, hope for a diplomatic détente between the US and Iran. A 14-point peace plan submitted by Tehran through Pakistani mediation, along with an extension of the ceasefire regime, is temporarily reducing the "chaos premium" built into gold prices. Meanwhile, fundamental support from central banks remains: they bought 244 tonnes in Q1 2026, and total demand rose 2% to 1,231 tonnes. The World Bank forecasts an average gold price of around $4,700 in 2026 but acknowledges that growth drivers are facing growing macroeconomic headwinds.

Technical Picture: Bearish Trend and Battle for Key Levels

The technical configuration of XAUUSD as of May 4 is distinctly bearish. On the daily...

Continue reading...
0
0
Luis Silva

Gold Market on April 29, 2026: In-Depth Fundamental Analysis and Technical Forecast

Gold Market on April 29, 2026: In-Depth Fundamental Analysis and Technical Forecast

Today, April 29, 2026, the gold market (XAUUSD) remains under pressure from sellers. Traders' primary focus is on the US Federal Reserve's interest rate decision, as well as the geopolitical situation in the Middle East. Trading is taking place around the $4,600–$4,620 per troy ounce level following a sharp decline the day before. Let’s examine the key factors that will determine the precious metal's dynamics in the short term.

Fundamental Analysis: Geopolitics and Monetary Policy

The main fundamental factor weighing on gold remains the geopolitical crisis in the Middle East. Negotiations between the US and Iran on ending the conflict and unblocking the Strait of Hormuz have reached an impasse. According to sources, President Donald Trump is not satisfied with Iran's new proposal, which excludes discussion of its nuclear program. This is keeping energy prices elevated: Brent crude is firmly entrenched above $100 per barrel, and the rising cost of energy, in turn, is fueling global inflation expectations—a key negative factor for gold as a non-interest-bearing asset.

It is precisely the fear of accelerating inflation that is shifting central banks' rhetoric. Although the market is almost 100% certain that the Fed will keep rates unchanged today in the 5.25–5.50% range, the main intrigue lies in the commentary from Fed Chair Jerome Powell and the updated economic projections. Rising oil prices are forcing the regulator to abandon ultra-dovish rhetoric. Market participants are hastily revising their expectations: anticipated Fed rate cuts in 2026 are now priced at just 5 basis points, virtually ruling out any monetary policy easing this year. Such a "hawkish" reassessment reduces gold's appeal while simultaneously strengthening the US currency.

Demand statistics are creating additional pressure. According to data, investment demand for gold dropped sharply in the first quarter of 2026. Inflows into gold ETFs fell by 73% compared...

Continue reading...
0
0
Navigation menu
instaforex banner