Trading Session: May 7, 2026
This forecast is based on futures market data, fundamental shifts, and the technical outlook. Additionally, it addresses key macroeconomic drivers expected to shape the dynamics of XAU/USD over the next 24 hours.
Market Drivers: Geopolitics vs. Macroeconomics
The pivotal event shaping gold’s (XAU/USD) trajectory leading up to May 7 has been a shift in market drivers. While earlier in 2026 the metal rallied as a classic safe-haven asset against the backdrop of the military conflict between the U.S. and Iran, market focus has now shifted toward the Federal Reserve’s monetary policy. Investors are currently pricing in news regarding the potential imminent cessation of hostilities. Reports circulating in the media — detailing a 14-point Memorandum of Understanding between Washington and Tehran that includes a suspension of uranium enrichment and the restoration of shipping through the Strait of Hormuz — have triggered a sharp plunge in oil prices.
The decline in energy prices has instantly dampened inflationary expectations. The market now perceives that the Federal Reserve’s need to keep interest rates at their peak for an extended period is diminishing. According to recent data, the probability of a rate hike by year end previously estimated at around 35% — has dropped sharply, giving way to expectations of at least one round of monetary policy easing. The U.S. dollar has begun to lose ground, retreating toward pre-conflict levels, thereby creating a favorable environment for dollar-denominated gold.
At the same time, strategists at MS warn that this current euphoria could soon give way to disappointment. Should the conflict drag on — and if the Federal Reserve maintains its hawkish rhetoric — gold could once again face downward pressure from rising bond yields. The real yield on 10-year U.S. Treasury Inflation-Protected Securities (TIPS) remains above the key 1.85% threshold, thereby limiting the appeal of non-yielding precious metals.
Fundamental Backdrop: The Dollar Under Pressure
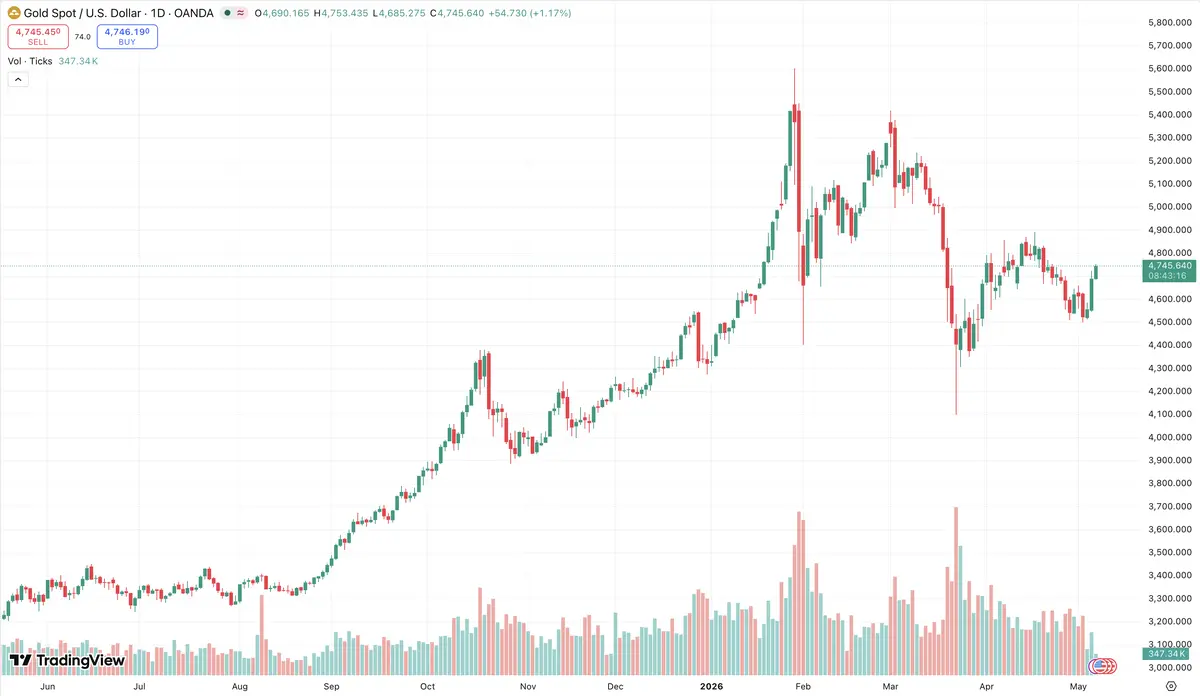
By the evening of May 6, XAU/USD staged a powerful surge of nearly 3% — marking its strongest single-day gain since late March. Prices are currently consolidating near the $4,700 per troy ounce level. Price support was bolstered by U.S. labor market statistics: ADP data showing private-sector job growth of 109,000 came in slightly better than forecasts, yet not strong enough to push the market back toward panic-driven expectations of monetary tightening.
Investors are awaiting Friday’s Non-Farm Payrolls (NFP) data with caution. The consensus forecast projects a modest increase of 60,000 new jobs following March’s sharp surge. Weak figures would reinforce expectations of monetary easing and could propel gold to new highs.
An additional fundamental factor is the sustained high demand for physical gold across Asia, as well as ongoing purchases by central banks. Analysts note that even during market corrections, underlying fundamental demand serves to prevent the market from experiencing a deep decline. The baseline forecast for 2026 remains at the $5,000 level, while Morgan Stanley (MS) projects that the price could reach $5,200 as early as the end of this year.
Technical Analysis: Testing Resistance Zones and Movement Scenarios
From a technical perspective, the outlook remains mixed. The daily chart indicates that the price has broken out of a falling wedge pattern and has established a foothold above the 21-day moving average — currently at $4,701 — suggesting a shift in the short-term trend toward a bullish bias. However, this upward momentum is encountering significant resistance levels.
The key resistance zone is situated between the $4,710 and $4,725 marks. This area is intersected by the 50-day and 100-day moving averages, as well as the 61.8% Fibonacci retracement level of the April decline. On the 4-hour chart, the RSI indicator is exiting the overbought zone, creating a risk of bearish divergence and a subsequent pullback.
The primary scenario for May 7 involves an attempt to break through the $4,725 level. A sustained move above this level would pave the way toward the $4,765 and $4,840 marks. The alternative scenario comes into play in the event of a downward rebound; support would be provided by the $4,645 and $4,588 levels. A break below the $4,605 level would strengthen the sellers’ position and could send prices back to retest the $4,500 zone.
Price Range for May 7, 2026: In Brief
Based on the analysis, the expected trading range for May 7 is between $4,640 and $4,725 per ounce. A sustained move above this channel would signal a medium-term bullish reversal; however, the balance of risks currently favors cautious consolidation, accompanied by attempts to test the upper boundary.
Fresh Buy Stop and Sell Stop Scenarios for Today:
Primary Buy Stop: Enter upon a breakout and sustained move above $4,725. Targets are $4,760, followed by $4,840. The Stop Loss is set at $4,690.
Alternative Sell Stop: Enter upon a drop below $4,640. Targets are $4,588, followed by $4,520. The Stop Loss is set at $4,680.

Comments
No comments yet. Be the first to share your thoughts!
Authentication Required
You must be logged in to post a comment.