

Key Concepts in Technical Analysis

Technical analysis is a powerful framework that allows traders to evaluate markets and identify high-probability trading opportunities by analyzing historical price action. Understanding its core principles is essential for navigating financial markets successfully.
Trend Acceleration: The Momentum Surge
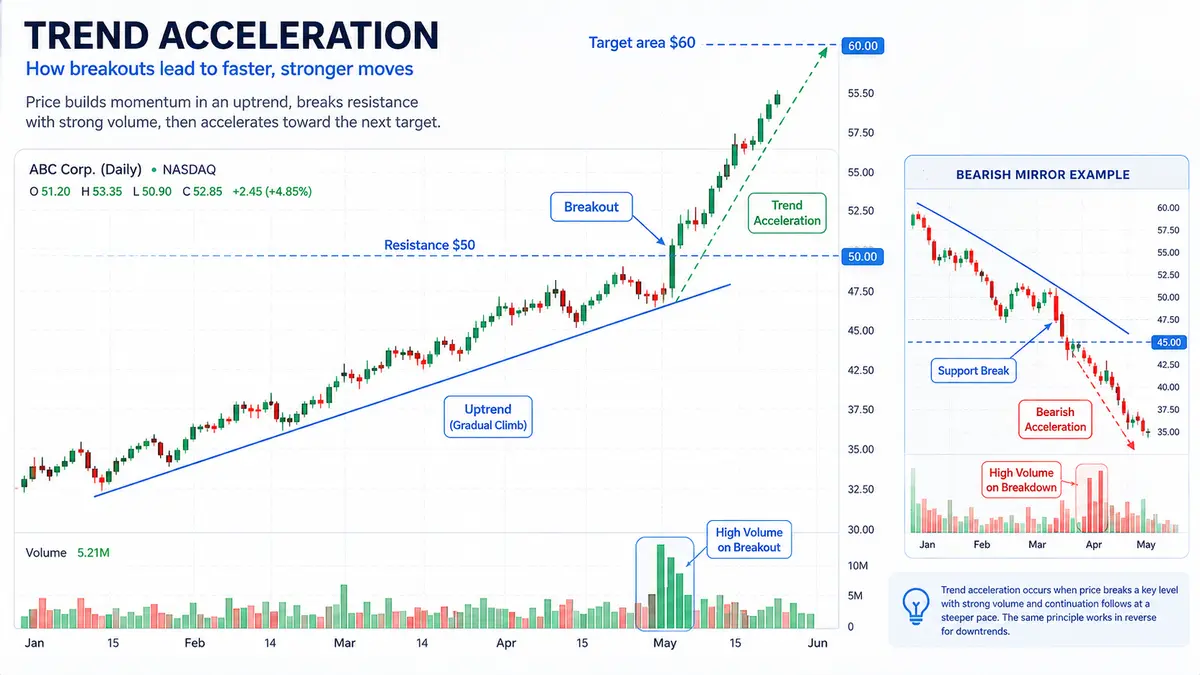
One of the most dynamic phenomena in trading is trend acceleration. This occurs during an established uptrend when the price forcefully breaks through an overhead resistance line, causing the market to climb at a much steeper, more aggressive angle. Conversely, in a downtrend, if the price drops below a critical support line, the sell-off intensifies, and the market falls at a much faster pace.
Both of these scenarios act as excellent confirmations of the prevailing trend’s underlying strength. This acceleration is heavily driven by market psychology — specifically, breakout traders aggressively entering the market and the sudden triggering of stop-loss orders from those caught on the wrong side of the trade.
Example: Imagine a stock steadily climbing in an established uptrend, repeatedly pausing at a resistance level of $50. Once strong buying volume finally pushes the price past $50, short sellers are forced to buy back their shares to cover their losses, while sidelined traders rush in due to FOMO (Fear Of Missing Out). This combined buying pressure causes the price to quickly accelerate to $60 at a much steeper angle than its previous gradual climb.
Strategic Trade Execution
Understanding the market structure dictates the specific positions we should open to maximize success and minimize risk.
The Golden Rule of Technical Analysis
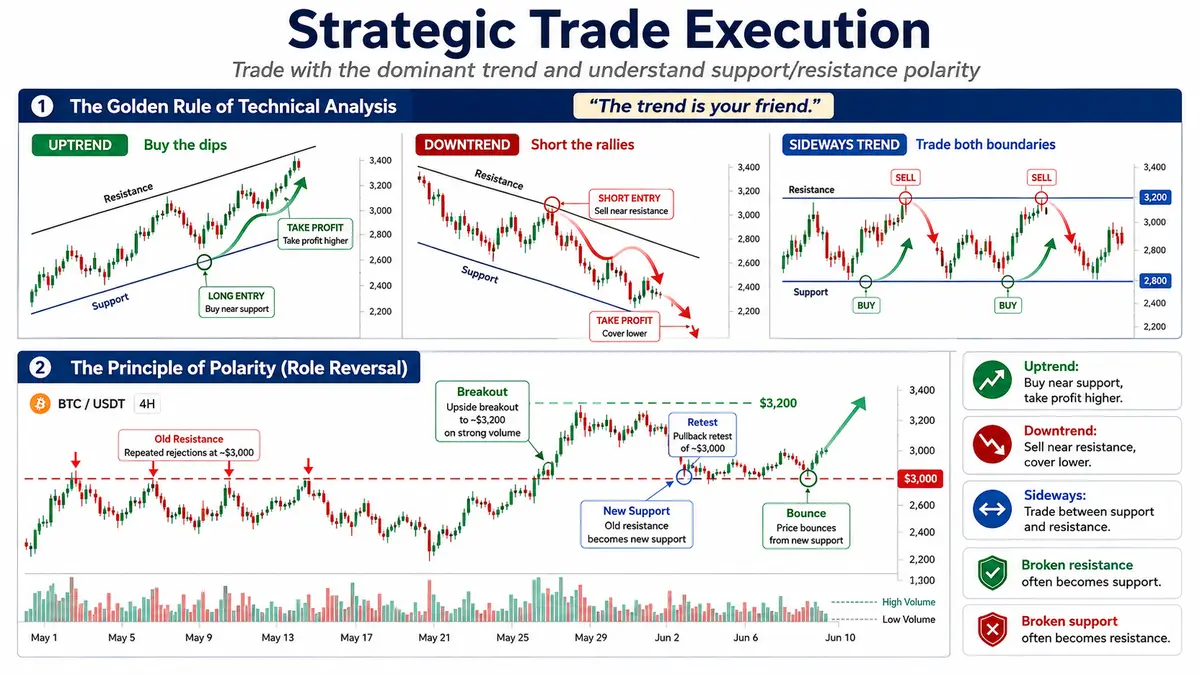
The most fundamental principle to remember is: always execute trades in the direction of the dominant trend. As the classic Wall Street adage goes, “The trend is your friend.” This means you should prioritize buying during an uptrend and selling during a downtrend.
-
During an Uptrend: The strategy is to buy the dips. You open a long position near the lower boundary of the trend (support) and close it at higher levels to take profit.
-
During a Downtrend: The strategy is to short the rallies. You open a short (sell) position near the upper boundary of the descending trend (resistance) and close it when the price drops to the lower boundary.
-
During a Sideways (Flat) Trend: The market lacks a clear directional bias, bouncing back and forth between defined support and resistance zones. In this ranging environment, you can trade both ways: open long positions at the bottom (support) and close at the top, or open short positions at the top (resistance) and close at the bottom.
The Principle of Polarity (Role Reversal)
A cornerstone of chart analysis is the principle of polarity regarding support and resistance levels. If a support line is decisively broken to the downside by price action, that exact same line flips its role and transforms into a new resistance line.
Conversely, if a resistance line is broken to the upside, it becomes a newly established support line.
Example: A cryptocurrency struggles to break the $3,000 mark (resistance) for several weeks, constantly getting rejected. Finally, a massive surge in volume pushes the price to $3,200. A few days later, the price corrects downward to retest the $3,000 level. Because of the principle of polarity, the former $3,000 resistance ceiling now acts as a strong support floor, and the price bounces off it to continue its upward trajectory.
How to Accurately Identify the Current Market Trend
To correctly determine the market trend in real-time, you first need to define your trading horizon. The timeframe you choose directly dictates the chart interval you should be analyzing.
Selecting the Right Timeframe
-
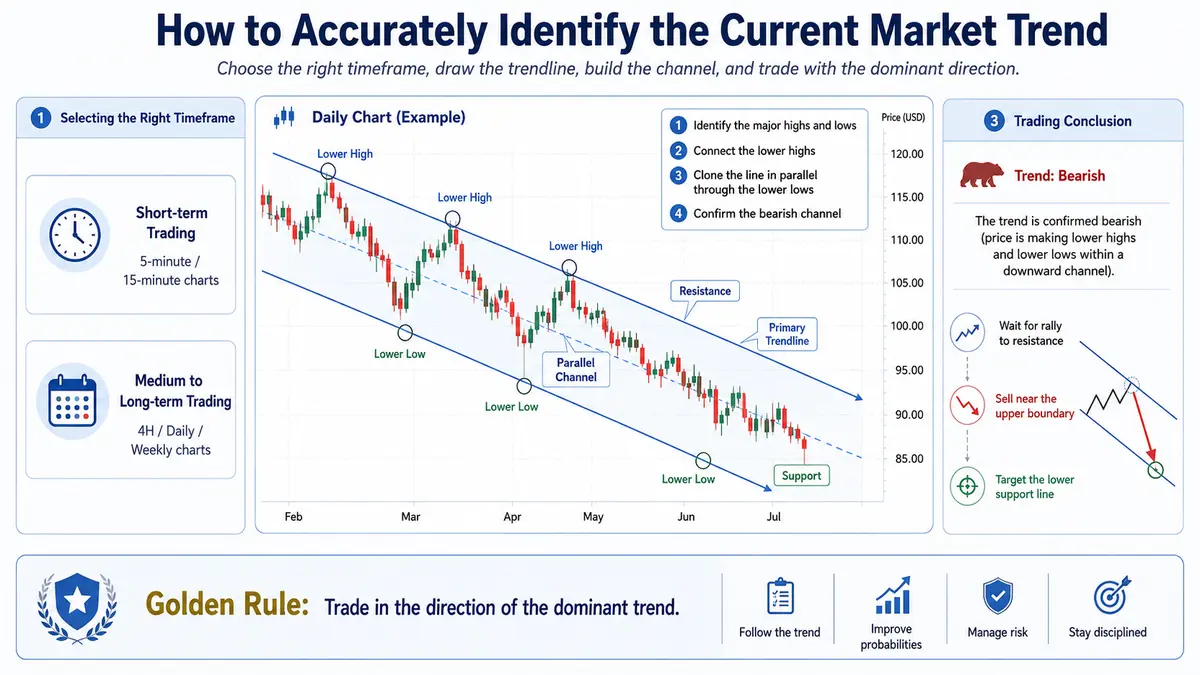
Short-term Trading (Scalping/Day Trading): For quick trades executed within a single session, the most comfortable and relevant intervals are the 5-minute or 15-minute charts.
-
Medium to Long-term Trading (Swing/Position Trading): For longer holds that last days, weeks, or months, you must look at higher intervals, such as the 4-hour, Daily, or Weekly charts.
Drawing Trendlines and Price Channels
To begin building your technical perspective, you need to identify the major peaks (highs) and troughs (lows) on your chosen chart.
Let’s assume you are looking at a daily chart to capture a standard price movement. Here is the process for defining the trend:
-
Identify the Extremes: Find the consecutive high points and low points on the chart.
-
Draw the Primary Trendline: If the market is moving downward, connect the consecutive lower highs with a straight, sloping line. This acts as your descending resistance. Your first boundary is now set.
-
Create the Channel: To gauge the full scope and volatility of the trend, draw a second line exactly parallel to your primary trendline, connecting the corresponding lower lows.
By drawing this parallel line, you have successfully visualized a descending price channel for that daily period. This gives you a clear, geometric framework for the market’s behavior.
Example: After connecting the lower highs and lower lows of an asset over the past month, you clearly see it is confined within a downward-sloping channel. Because the overall confirmed trend is bearish (downward), your trading strategy must align with this reality. Therefore, you wait patiently for the price to rally and touch the upper resistance line of your channel to execute a high-probability sell (short) position, riding the dominant momentum back down toward the support line.

Comments
No comments yet. Be the first to share your thoughts!
Authentication Required
You must be logged in to post a comment.