Bar Pipa
We pay for a post of 10$

#forex #trading

GFATHER

Fair Value Gaps (FVGs) & Inversion Mechanics: Trading Algorithmic Imbalances

Fair Value Gaps (FVGs) & Inversion Mechanics: Trading Algorithmic Imbalances

Fair Value Gaps (FVGs) & Inversion Mechanics: Trading Algorithmic Imbalances

In classical technical analysis, gaps are often treated as rare weekend anomalies or simple exhaustion signs. In institutional order flow, however, Fair Value Gaps (FVGs) are the primary fingerprint left behind when central bank algorithms reprice an asset with explosive efficiency.

An FVG represents a single-sided inefficiency where only buyers (or only sellers) were present during a rapid price expansion. Understanding how algorithms target, rebalance, and invert these gaps gives you a profound edge when entering trades during live market sessions.

The Anatomy of a Fair Value Gap

A valid Fair Value Gap is a three-candle sequence where a sharp displacement candle leaves an unfilled void between the wicks of the surrounding candles.

The Algorithmic Mechanics:

  1. Candle 1: Forms a swing high wick.

  2. Candle 2 (Displacement): Explodes upward with high institutional volume, breaking structure.

  3. Candle 3: Forms a low wick that fails to reach down to the high wick of Candle 1.

The empty space between Candle 1's high and Candle 3's low is the Fair Value Gap. Because price moved too fast for counter-orders to be matched, the algorithm views this price region as "inefficient." It will eventually drag price back into this gap to balance the orders.

Key Algorithmic Levels Within an FVG

When price returns to rebalance a Fair Value Gap, it doesn't move randomly inside the void. Algorithms react to two precise price boundaries:

  • Consequent Encroachment (CE): The exact 50% midpoint of the Fair Value Gap. This is the ultimate algorithmic reaction point. If price touches the 50% CE level and respects it, the setup holds maximum probability.

  • Full Rebalance: If price completely closes through the gap, it has fully delivered liquidity. However, if a candle body closes beyond the far boundary of the FVG,...

Continue reading...
0
0
GFATHER

Advanced Market Structure: CHOCH vs. BOS and Complex Internal Order Flow

Advanced Market Structure: CHOCH vs. BOS and Complex Internal Order Flow

Advanced Market Structure: CHOCH vs. BOS and Complex Internal Order Flow

Every major move on a price chart leaves structural clues. While basic technical analysis teaches traders to draw generic higher highs and higher lows, institutional algorithms navigate market structure with mathematical precision.

To trade alongside smart money, you must distinguish between a temporary pullback, a structural continuation, and an authentic reversal. This requires mastering the exact mechanics of Break of Structure (BOS), Change of Character (CHOCH), and Internal vs. External Liquidity.

Structural Reversal vs. Structural Continuation

The foundation of tracking order flow relies on recognizing whether the algorithm is extending the current trend or actively flipping the directional bias.

1. Break of Structure (BOS)

A Break of Structure represents trend continuation. In a bullish trend, a BOS occurs when price aggressively expands upward and breaks through the previous swing high, confirming that institutional order flow remains buy-side dominant.

  • Key Requirement: For a valid BOS on higher timeframes, price must have a full candle body close beyond the structural swing point, not just a wick sweep.

2. Change of Character (CHOCH)

A Change of Character is the very first structural indication of a potential trend reversal. In a bullish market, a CHOCH occurs when price fails to make a new higher high and instead breaks below the last key swing low that generated the peak.

  • Key Requirement: A CHOCH usually occurs after price has swept a major Higher Timeframe (HTF) liquidity pool or tapped into a supply/demand zone.

Visualizing the Structural Sequence

Understanding how CHOCH transitions into BOS allows you to capture low-risk entries at the absolute turning point of a trend.

  1. The Trap: Price makes a final leg up, sweeping previous buy-side liquidity into an unmitigated 4-Hour supply zone.

  2. The Shift (CHOCH): Price aggressively drops down,...

Continue reading...
0
0
GFATHER

Order Blocks & Breaker Blocks: Uncovering True Institutional Footprints

Order Blocks & Breaker Blocks: Uncovering True Institutional Footprints

In classical technical analysis, retail traders spend years learning to buy at double bottoms or sell at double tops. Yet time and time again, price smashes straight through those levels before reversing in the direction you originally anticipated.

Why does this happen? Because double tops and double bottoms aren't institutional reversal points—they are liquidity traps.

To locate true institutional turning points, you need to look at Order Blocks and Breaker Blocks. These are the literal price points where institutions loaded up massive position inventory, leaving behind footprint tracks that algorithms are programmed to return to and defend.

What Is a Valid Institutional Order Block?

An Order Block (OB) isn't just any red candle before a green move, or any green candle before a red move. A high-probability institutional Order Block must fulfill three strict criteria:

  1. Liquidity Sweep: The Order Block candle must have swept liquidity (taken out a previous swing high or low, equal highs, or session extremes) right before the reversal.

  2. Aggressive Expansion: Price must explode away from the Order Block, breaking market structure (BOS) or changing character (CHOCH).

  3. Fair Value Gap (FVG): That explosive push out must leave an unmitigated Fair Value Gap directly above (for bullish OBs) or below (for bearish OBs) the order block.

If a candle did not sweep liquidity or leave an imbalance behind, it is simply a standard candle—not an institutional Order Block.

Bullish Order Block (Demand)

The last down-close (bearish) candle that swept sell-side liquidity immediately before a powerful upward move that broke structural resistance and created an FVG.

Bearish Order Block (Supply)

The last up-close (bullish) candle that swept buy-side liquidity immediately before a sharp downward move that broke structural support and created an FVG.

The Mitigation Process: Why Price...

Continue reading...
0
0
GFATHER

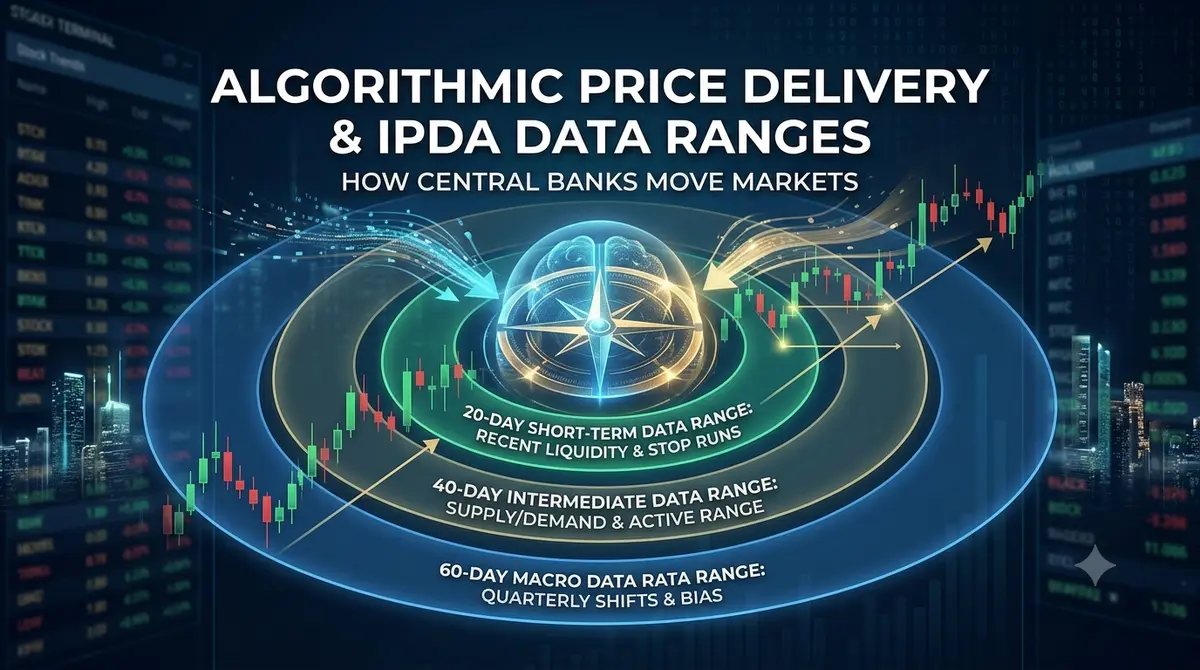
Algorithmic Price Delivery & IPDA Data Ranges: How Central Banks Move Markets

Algorithmic Price Delivery & IPDA Data Ranges: How Central Banks Move Markets

Algorithmic Price Delivery & IPDA Data Ranges: How Central Banks Move Markets

If you’ve ever wondered why price turns around at the exact pip, hour, or minute without touching any traditional indicator on your screen, the answer lies in Algorithmic Price Delivery.

Modern markets aren’t moved by buyers and sellers bidding against each other on a pit floor anymore. They are controlled by the Interbank Price Delivery Algorithm (IPDA)—a centralized computational framework used by tier-1 banks and central financial institutions to reprice assets, seek liquidity, and balance market inefficiencies.

Understanding IPDA removes the guesswork from your trading. You stop treating the market like a random walk and start looking at charts through the lens of scheduled institutional routines.

What Is IPDA?

IPDA stands for the Interbank Price Delivery Algorithm. Its core job is to deliver fair prices efficiently while providing continuous liquidity to institutional players.

Unlike retail traders who think in terms of lines, indicators, or shapes on a screen, IPDA delivers price based on two simple variables:

  1. Time: Price is programmed to reach specific levels at specific times of the day, week, month, and quarter.

  2. Price (Liquidity & Efficiency): IPDA moves price to either sweep liquidity (stop losses resting above swing highs or below swing lows) or rebalance inefficiencies (Fair Value Gaps and unmitigated Order Blocks).

If price is not seeking liquidity, it is seeking efficiency. There is no third state.

The IPDA Look-Back Engine: The 20, 40, and 60-Day Data Ranges

IPDA operates on strict historical time cycles to calculate where current price should be delivered. These cycles are known as IPDA Data Ranges.

To determine where institutions are likely to send price next, the algorithm constantly references three specific look-back windows:

  • 20-Day Look-Back (Short-Term Liquidity): Used to identify recent swing highs/lows for immediate...

Continue reading...
0
0

Don’t rush to accept a leverage from any broker, until u read this.

Don’t rush to accept a leverage from any broker, until u read this.

What Is Leverage in Forex Trading?

Leverage is one of the most important concepts every forex trader must understand before placing a trade. Many beginners hear that leverage can help them make bigger profits, but they often ignore the fact that it can also increase losses. Learning how leverage works is essential because it helps traders make informed decisions and manage risk effectively.

In simple terms, leverage is borrowed money provided by a broker that allows traders to control a larger trading position with smaller amount of their own money. Instead of paying the full value of a trade, the trader only needs to deposit a small percentage called the margin. The broker temporarily provides the remaining amount needed to open the position.

For example, imagine you have only $100 in your trading account. Without leverage, you can only trade up to the value of your account. However, if your broker offers 1:100 leverage, your $100 can control a position worth as much as $10,000. This gives traders the opportunity to participate in larger trades than they could afford with their own funds alone.

Leverage is usually written as a ratio, such as 1:10, 1:50, 1:100, or 1:500. The first number represents your own capital, while the second number shows how much buying power the broker is providing. A higher leverage ratio means you can control a larger position with less money, but it also means your account is exposed to greater risk if the market moves against you.

Many new traders are attracted to high leverage because they believe it guarantees higher profits. While leverage can increase potential returns, it can also magnify losses. If a trade moves in your favor, your profit will be larger than it would have been without leverage. On the other hand, if the...

Continue reading...
0
0
GFATHER

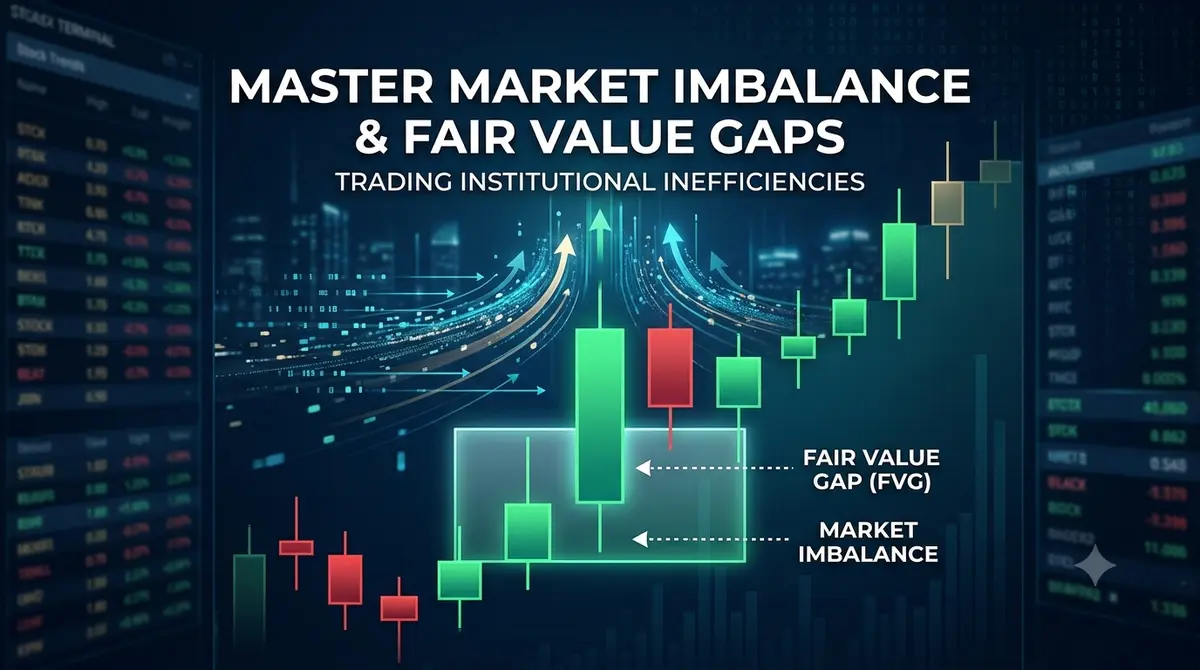
Master Market Imbalance & Fair Value Gaps: Trading Institutional Inefficiencies

Master Market Imbalance & Fair Value Gaps: Trading Institutional Inefficiencies

Master Market Imbalance & Fair Value Gaps: Trading Institutional Inefficiencies

We’ve all been there. You look at a chart, and out of nowhere, a massive green candle explodes upward. Panic sets in. You think, "If I don’t buy right now, I’m going to miss the whole move." So you hit market buy at the top—and almost instantly, price turns around and slams straight back down.

That FOMO trap destroys more trading accounts than almost anything else.

Professional traders look at those violent moves totally differently. When a huge candle tears through a chart, it leaves behind an inefficiency—what traders call a Fair Value Gap (FVG) or market imbalance. Instead of chasing the spike, pros mark that zone and sit back. They know price almost always comes back to fill the gap before the real move continues.

What Actually Is a Fair Value Gap?

In a normal, healthy market, buyers and sellers trade back and forth smoothly. Price moves up a bit, down a bit, and fills orders at every single price level.

An imbalance happens when an overwhelming chunk of institutional money hits the market all at once. Think big bank orders, CPI news releases, or session open spikes. The buying or selling is so aggressive that price literally skips levels, leaving a big pocket of un-filled orders behind.

Spotting an FVG comes down to a simple three-candle pattern on your chart:

  • Bullish FVG: Find a big, aggressive green candle (Candle 2). Now look at the candle before it (Candle 1) and the candle after it (Candle 3). If the high of Candle 1 and the low of Candle 3 don't overlap, that open gap in the middle is your bullish Fair Value Gap.

  • Bearish FVG: Find a strong red candle (Candle 2). If the low of Candle 1 and...

Continue reading...
0
0
GFATHER

Decoding Order Blocks & Supply/Demand Zones: Trading High-Probability Turnarounds

Decoding Order Blocks & Supply/Demand Zones: Trading High-Probability Turnarounds

Decoding Order Blocks & Supply/Demand Zones: Trading High-Probability Turnarounds

If market structure gives you the map and liquidity sweeps show you where the traps are laid, Order Blocks and Supply/Demand zones give you exact precision for entries.

Most retail traders struggle with timing. They either buy after a massive rally has already stretched too far or try to catch a falling knife right in the middle of nowhere. Finding institutional order blocks gives you the patience to wait for price to return to high-interest footprints, letting you enter with tight stop losses and massive risk-to-reward potential.

What Is an Order Block?

An Order Block (OB) is a specific price zone on a chart where major market participants—such as central banks, hedge funds, and institutional desks—placed heavy buy or sell orders.

Because institutional orders are far too massive to fill all at once without breaking market stability, these players leave behind unfilled orders (resting liquidity). When price eventually returns to these exact levels later on, those remaining orders trigger, causing price to violently launch away or ignite a brand-new trend expansion.

Spotting a real order block requires looking for two simple criteria:

  • Bullish Order Block: Look for the last down-close candle right before a powerful, aggressive move up that successfully breaks market structure (BOS) or changes character (CHOCH).

  • Bearish Order Block: Look for the last up-close candle right before a sharp, downward collapse that breaks structure to the downside.

If a candle didn't cause an aggressive move that broke structure and left imbalance behind, ignore it. It isn't a valid order block.

Supply and Demand vs. Basic Support and Resistance

Retail textbooks love drawing simple horizontal lines across random wicks and calling them support or resistance. The problem? Those lines ignore institutional volume.

Supply and Demand zones mark entire price ranges...

Continue reading...
0
0
GFATHER

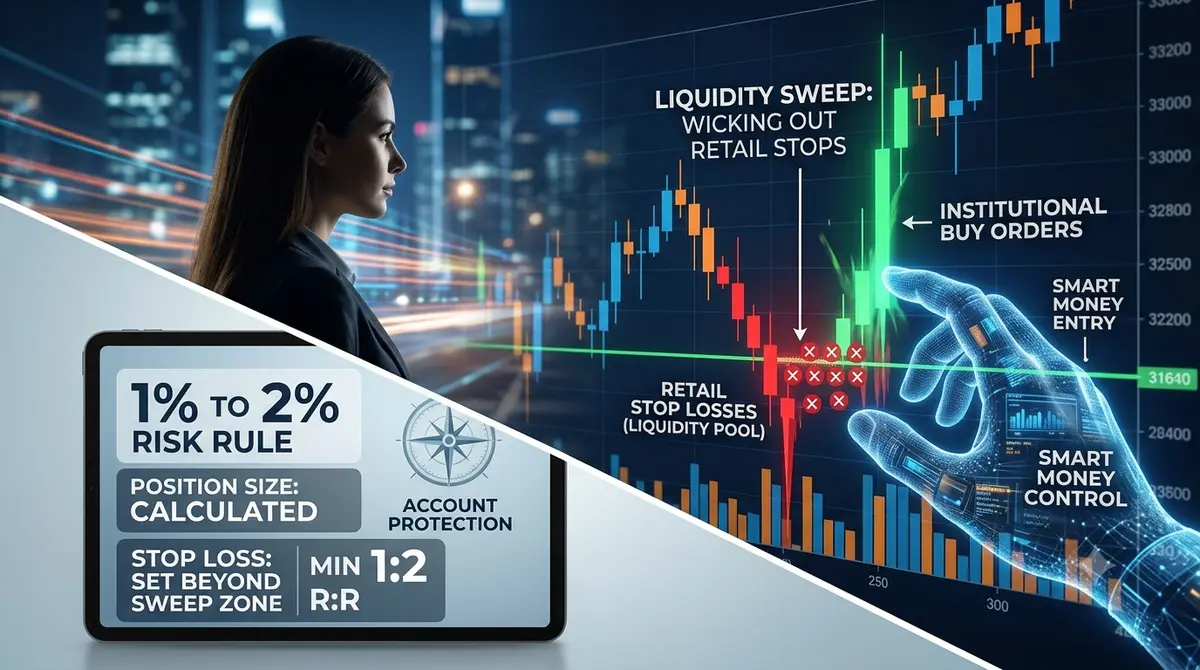
Liquidity Sweeps & Risk Management: How Smart Money Manipulates the Charts

Liquidity Sweeps & Risk Management: How Smart Money Manipulates the Charts

Liquidity Sweeps & Risk Management: How Smart Money Manipulates the Charts

If you have ever set a tight stop loss right under a support level, watched price dip just far enough to blow you out, and then immediately skyrocket toward your profit target... congratulations. You have been swept.

Most retail traders treat stop runs like bad luck or unfair market manipulation. In reality, liquidity sweeps are just how big money operates. Once you realize that institutions need your stop loss to fill their own orders, you can stop falling for the trap—and start using it to your advantage.

What Is a Liquidity Sweep?

Markets do not move because an RSI line crosses 30 or a moving average turns green. Price moves toward liquidity. Liquidity is simply a massive cluster of orders resting at predictable levels on a chart.

Retail trading courses teach millions of people to put their stops in the exact same spots:

  • Sell Stops: Placed right below obvious equal lows, double bottoms, or major support lines.

  • Buy Stops: Placed right above obvious equal highs, double tops, or major resistance lines.

If a hedge fund wants to buy $500 million worth of a currency, stock, or crypto asset, they cannot just click "market buy." Doing that would cause massive slippage and ruin their entry price. To buy a massive position, they need an equal amount of sellers.

Where are all the sellers? Sitting right below support levels as retail stop losses.

A liquidity sweep happens when price aggressively pushes through a key high or low to slam into those stop losses. Once the institutional orders get filled against retail stops, price violently snaps back in the opposite direction.

Spotting Sweeps vs. Real Breakouts

The secret to trading sweeps comes down to watching candle behavior at key structural levels. You...

Continue reading...
0
0
GFATHER

Mastering Market Structure: The Universal Map Every Trader Needs

Mastering Market Structure: The Universal Map Every Trader Needs

Mastering Market Structure: The Universal Map Every Trader Needs

Every market leaves footprints. It doesn’t matter if you’re looking at a 5-minute crypto chart, tracking Apple stock on the daily, or scanning EURUSD ... during the London open. Price leaves clues everywhere.

The problem? Most traders waste years chasing lagging indicators. They tweak RSI settings, test double moving average crossovers, or wait for Stochastic lines to magically solve the market. It doesn't work. Indicators only summarize what already happened. If you want to know where price is actually heading, you have to read the core engine of price itself: market structure.

Understanding the Core Blueprint

Strip away the indicators, and the market becomes surprisingly simple. Price moves in natural cycles of expansion, contraction, and consolidation. It’s just an endless tug-of-war between buyers and sellers fighting over liquidity.

Across every asset class and timeframe, you’ll see the market rotate through three main states:

  • Uptrends: Price makes higher highs and higher lows. Buyers clearly hold the steering wheel, and dips get bought quickly.

  • Downtrends: Price makes lower highs and lower lows. Sellers dominate the room, breaking support levels while buyers fail to defend pullbacks.

  • Ranges: Price bounces back and forth between obvious floor and ceiling levels. Neither side has control, creating a messy chop where orders pile up on both sides.

If you can identify which state the market is in right now, you instantly avoid the biggest mistake in trading: trying to buy a crashing market or shorting a moonshot.

Identifying the Shift: BOS vs. CHOCH

Once you spot the overall trend, you need to know when it’s healthy and when it’s about to fall apart. This comes down to two key price events.

First, there’s the Break of Structure (BOS). When a market is trending up and punches cleanly past...

Continue reading...
0
0
GFATHER

Mastering Market Structure: The Universal Map Every Trader Needs

Mastering Market Structure: The Universal Map Every Trader Needs

Mastering Market Structure: The Universal Map Every Trader Needs

Every market tells a story.

Whether you are staring at a 5-minute chart of Bitcoin, analyzing the daily candles of Apple stock, or tracking momentum on EURUSD ... , price action leaves distinct clues. Yet, most retail traders spend years chasing lagging indicators—searching for a secret moving average crossover or a magical RSI setting that will guarantee consistent profits.

The cold truth? Indicators only show you what has already happened. They are mathematical derivatives of past price. To understand where price is going next, you must master the fundamental blueprint behind every market: Market Structure.

What Is Market Structure?

At its core, market structure is the universal framework describing how price moves in natural cycles. Markets never move in straight lines indefinitely. They expand, contract, reverse, and consolidate as buyers and sellers continuously compete for liquidity.

Regardless of the asset class or timeframe, market structure consists of three primary phases:

1. Uptrend: Defined by a series of Higher Highs (HH) and Higher Lows (HL). Buyers are aggressively pushing price upward, and sellers are only able to cause minor, temporary pullbacks.

2. Downtrend: Defined by Lower Highs (LH) and Lower Lows (LL). Sellers dominate, systematically breaking key support levels while buyers fail to defend previous swing points.

3. Consolidation (Range): Price is trapped between a clear resistance ceiling and support floor. Neither side has control, creating a neutral environment where institutional liquidity builds up on both sides.

Understanding which phase the market is currently in saves you from making the single most common retail trading error: fighting the macro trend.

The Shift: Spotting the Break of Structure & CHOCH

Trading becomes significantly clearer when you learn to identify a Break of Structure (BOS). A break of structure occurs when price forcefully...

Continue reading...
0
0
Navigation menu
instaforex banner