
Liquidity Sweeps & Risk Management: How Smart Money Manipulates the Charts
Liquidity Sweeps & Risk Management: How Smart Money Manipulates the Charts
If you have ever set a tight stop loss right under a support level, watched price dip just far enough to blow you out, and then immediately skyrocket toward your profit target… congratulations. You have been swept.
Most retail traders treat stop runs like bad luck or unfair market manipulation. In reality, liquidity sweeps are just how big money operates. Once you realize that institutions need your stop loss to fill their own orders, you can stop falling for the trap—and start using it to your advantage.
What Is a Liquidity Sweep?
Markets do not move because an RSI line crosses 30 or a moving average turns green. Price moves toward liquidity. Liquidity is simply a massive cluster of orders resting at predictable levels on a chart.
Retail trading courses teach millions of people to put their stops in the exact same spots:
-
Sell Stops: Placed right below obvious equal lows, double bottoms, or major support lines.
-
Buy Stops: Placed right above obvious equal highs, double tops, or major resistance lines.
If a hedge fund wants to buy $500 million worth of a currency, stock, or crypto asset, they cannot just click “market buy.” Doing that would cause massive slippage and ruin their entry price. To buy a massive position, they need an equal amount of sellers.
Where are all the sellers? Sitting right below support levels as retail stop losses.
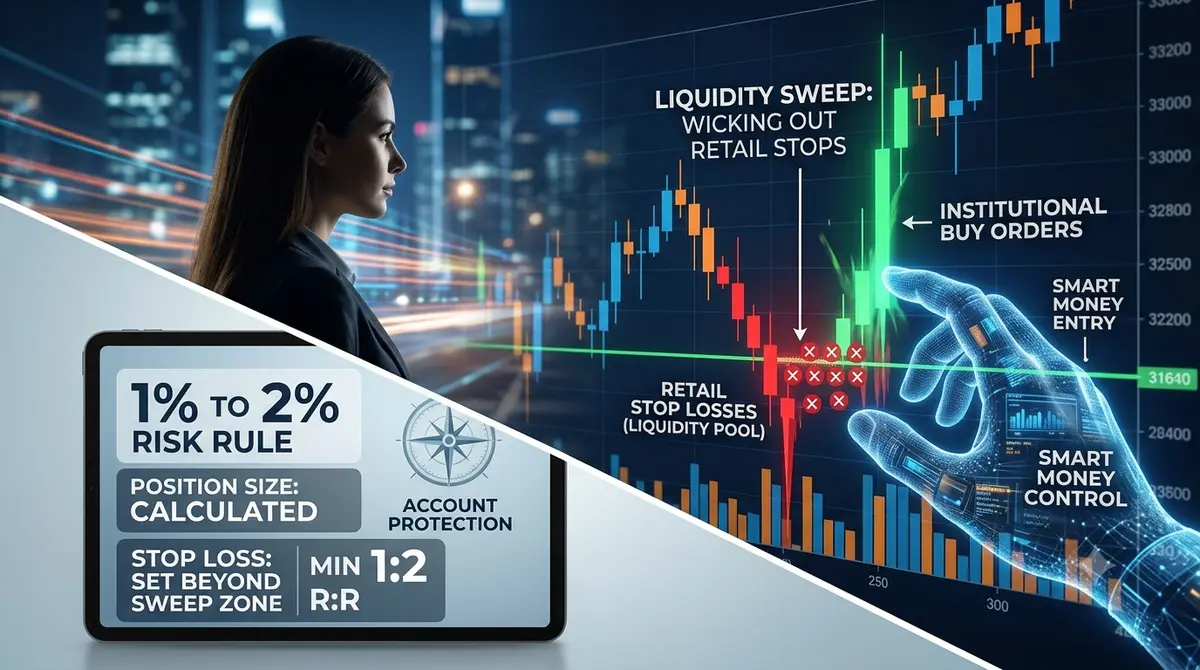
A liquidity sweep happens when price aggressively pushes through a key high or low to slam into those stop losses. Once the institutional orders get filled against retail stops, price violently snaps back in the opposite direction.
Spotting Sweeps vs. Real Breakouts
The secret to trading sweeps comes down to watching candle behavior at key structural levels. You have to wait and see how price behaves after hitting the level:
-
Real Breakout: Price punches through a support or resistance zone with heavy volume and closes cleanly outside the range on the candle body. Buyers or sellers are aggressively committing real capital to push price further.
-
Liquidity Sweep: Price pierces a key level, triggers all the resting stop-loss orders, and then instantly rejects. The candle closes back inside the previous range, leaving behind a long, sharp wick.
If you jump into breakouts blindly, you will get caught in sweeps over and over. If you wait for the sweep to finish and look for a strong rejection wick, you get a clean, high-probability entry alongside smart money.

Applied to Stocks, Forex, Crypto, and Options
Liquidity sweeps show up across every asset class because human behavior is the same everywhere.
-
Forex: Sweeps happen constantly around major bank session opens (London and New York) or news events like interest rate decisions. Banks routinely sweep the Asian session high or low before setting the real trend for the day.
-
Stocks: Individual stocks love to sweep the previous day’s high or low right at the opening bell. Index futures like the NASD.L ... (NQ) frequently sweep key round numbers before making sustained moves.
-
Crypto: Crypto is packed with high leverage, meaning liquidation levels are stacked above and below obvious chart points. Bitcoin frequently engineers sharp spikes to wipe out over-leveraged long or short positions before resuming its broader trend.
-
Options: Options premiums get crushed during sweeps because volatility spikes right at the wick. Knowing where liquidity rests helps options buyers avoid buying calls at the absolute top or puts at the absolute bottom.
The Risk Management Rules That Save Accounts
Understanding sweeps means nothing if your risk management is sloppy. Here is how to structure your account to survive and thrive long-term:
-
Calculate Position Size for Every Single Trade: Never trade a fixed number of shares or lots. Always calculate your size using your risk percentage and stop-loss distance.
$$text{Position Size} = frac{text{Account Risk ( USD ... )}}{text{Entry Price} – text{Stop Loss Price}}$$
-
Never Risk More Than 1% to 2%: If you risk 1% per trade, a terrible streak of 5 straight losses only drawdown your account by 5%. That keeps you calm and in control.
-
Hide Your Stop Behind Liquidity: Stop putting your stop loss right at obvious support or resistance. Place it beyond the liquidity pool where institutional sweeps run out of steam.
-
Demand a 1:2 Minimum Risk-to-Reward: If you risk $100, your target should make at least $200. With a 1:2 ratio, you can lose more trades than you win and still turn a steady profit over time.
Stop letting market makers use your account as fuel. Respect where liquidity rests, manage your risk like a business, and let the market come to you.



Comments
No comments yet. Be the first to share your thoughts!
Authentication Required
You must be logged in to post a comment.