
Mastering Risk Management & Liquidity Sweeps: How Smart Money Controls the Market

Mastering Risk Management & Liquidity Sweeps: How Smart Money Controls the Market
Ask any seasoned trader what separates consistent professionals from the 90% who lose money, and you will rarely hear about a secret indicator or a perfect entry pattern. The real differentiator comes down to two foundational pillars: understanding institutional liquidity sweeps and executing disciplined risk management.
If you have ever placed a trade, set a tight stop loss right beyond a technical swing high or low, and watched in frustration as price surged just far enough to kick you out before immediately reversing in your predicted direction, you have experienced a liquidity sweep.
Understanding how market makers use retail stop losses to fill their own orders—and structuring your risk parameters around this reality—is the single most important step in protecting your capital and trading with longevity.
The Anatomy of a Liquidity Sweep
To navigate the market effectively, you must understand that price does not move simply because an indicator flashes a signal. Price moves toward areas of high liquidity. Liquidity is simply pool money—a collection of buy and sell orders resting at predictable chart levels.
Retail trading textbooks teach millions of people to place stop-loss orders in the exact same locations:
-
Buy Stop Losses: Placed just above obvious resistance levels, previous day highs, or equal highs.
-
Sell Stop Losses: Placed just below obvious support levels, previous day lows, or equal lows.
Institutional market participants—such as hedge funds, algorithmic trading desks, and bank market makers—operate with orders so large that they cannot enter positions without moving the price against themselves. To fill a massive buy order, an institution needs a massive cluster of sell orders. Where are those sell orders resting? Right below key support levels as retail stop losses.
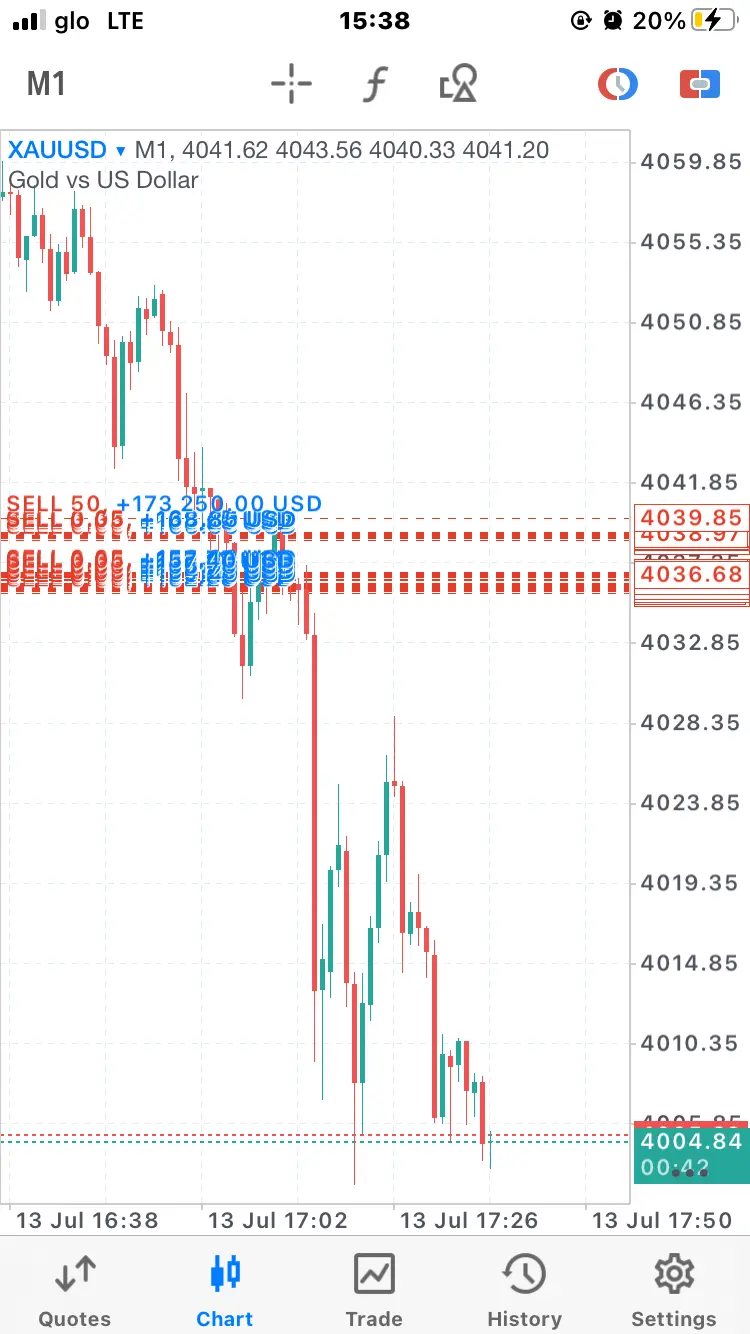
A liquidity sweep (often called a stop hunt or sweep) occurs when price aggressively drives past a known high or low to trigger those pending orders. Once that liquidity is consumed, price rapidly reverses, leaving behind a long wick on the chart.
Differentiating Fakeouts from True Breakouts
Recognizing liquidity sweeps in real time requires shifting how you interpret price action. The key lies in observing how price reacts after hitting a critical level:
-
A True Breakout: Price forcefully expands past a key level with strong momentum and closes comfortably beyond it. Higher timeframes will show solid candle bodies, confirming that aggressive buyers or sellers are committing real capital to sustain the move.
-
A Liquidity Sweep: Price pierces a key structural high or low, triggering stop losses and breakout orders, but fails to sustain acceptance. The candle quickly pulls back, closing back inside the range and leaving a extended wick.
When you see a liquidity sweep on a key timeframe, it is not a sign that the market is broken—it is a signal that institutional orders have been matched. Trading with the sweep, rather than falling victim to it, completely transforms your win rate.
Universal Application Across All Asset Classes
Liquidity sweeps occur everywhere because human fear and greed manifest identically across every financial instrument:
-
Forex: In currency trading, liquidity sweeps routinely occur around major macroeconomic news releases (like NFP or CPI data) or market session opens (London and New York reversals). Banks sweep Asian session highs or lows before establishing the true directional move for the day.
-
Stocks & Indices: Equities frequently sweep gap levels, opening range highs/lows, and previous daily support levels before institutional buyers step in. Index futures like the USCL.TO ... (ES) and Nasdaq (NQ) are notorious for sweeping round numbers before trend expansion.
-
Crypto: High leverage in cryptocurrency markets creates massive pools of liquidation levels above and below key chart points. Bitcoin and Ethereum frequently experience sharp volatility spikes designed to clean out over-leveraged retail traders before continuing their macro trend.
-
Options: Options traders suffer heavily during liquidity sweeps due to delta expansion and implied volatility spikes. Understanding where liquidity rests allows options buyers to avoid buying expensive calls at resistance wicks and helps options sellers choose safer strike prices outside liquidity sweep zones.

The Practical Risk Management Blueprint
Understanding liquidity is worthless without strict risk management. To protect your portfolio, adopt these non-negotiable rules:
-
The 1% to 2% Rule: Never risk more than 1% to 2% of your total account balance on a single trade setup. This ensures that even a streak of five consecutive losses will not inflict permanent damage on your capital.
-
Calculate Position Size Based on Volatility: Your position size should never be fixed; it must adjust based on your stop-loss distance.
$$text{Position Size} = frac{text{Account Risk ( USD ... )}}{text{Entry Price} – text{Stop Loss Price}}$$
-
Place Stops Beyond Liquidity: Stop placing your stop loss directly on structural support or resistance. Give your trade room to breathe by placing your stop beyond the liquidity pool where institutional sweeps are likely to exhaust themselves.
-
Target Asymmetrical Risk-to-Reward: Always aim for a minimum Risk-to-Reward ratio of 1:2. This means a 40% win rate can still yield long-term profitability.
By mastering liquidity dynamics and anchoring your strategy with strict mathematical risk controls, you stop trading against smart money and start trading alongside it.



Comments
No comments yet. Be the first to share your thoughts!
Authentication Required
You must be logged in to post a comment.