Master Market Imbalance & Fair Value Gaps: Trading Institutional Inefficiencies
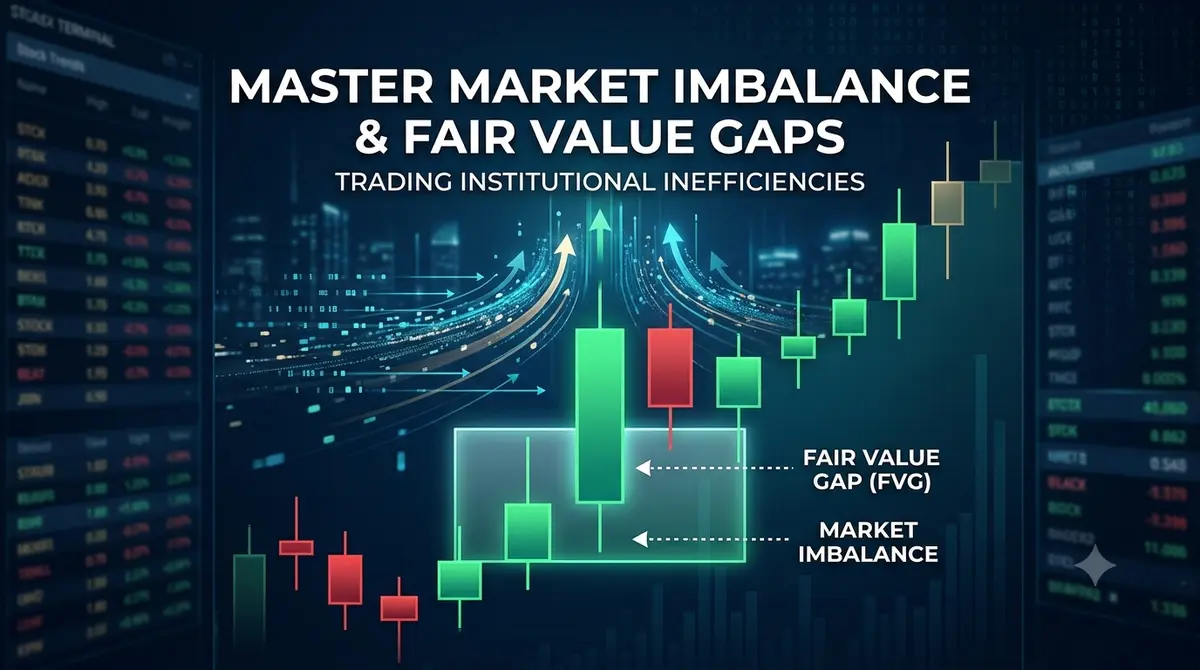
Master Market Imbalance & Fair Value Gaps: Trading Institutional Inefficiencies
We’ve all been there. You look at a chart, and out of nowhere, a massive green candle explodes upward. Panic sets in. You think, "If I don’t buy right now, I’m going to miss the whole move." So you hit market buy at the top—and almost instantly, price turns around and slams straight back down.
That FOMO trap destroys more trading accounts than almost anything else.
Professional traders look at those violent moves totally differently. When a huge candle tears through a chart, it leaves behind an inefficiency—what traders call a Fair Value Gap (FVG) or market imbalance. Instead of chasing the spike, pros mark that zone and sit back. They know price almost always comes back to fill the gap before the real move continues.
What Actually Is a Fair Value Gap?
In a normal, healthy market, buyers and sellers trade back and forth smoothly. Price moves up a bit, down a bit, and fills orders at every single price level.
An imbalance happens when an overwhelming chunk of institutional money hits the market all at once. Think big bank orders, CPI news releases, or session open spikes. The buying or selling is so aggressive that price literally skips levels, leaving a big pocket of un-filled orders behind.
Spotting an FVG comes down to a simple three-candle pattern on your chart:
Bullish FVG: Find a big, aggressive green candle (Candle 2). Now look at the candle before it (Candle 1) and the candle after it (Candle 3). If the high of Candle 1 and the low of Candle 3 don't overlap, that open gap in the middle is your bullish Fair Value Gap.
Bearish FVG: Find a strong red candle (Candle 2). If the low of Candle 1 and...