
Hey u don’t need to trouble ur mind trying to figure out how to read or analyse complicated candlestick chart, in this article, I have break it down for u in a simplified English language.
How to Read Candlestick Charts Like a Pro
Candlestick charts are one of the most powerful tools in forex trading. They provide traders with valuable information about price movements, market sentiment, and potential trading opportunities. Unlike line charts, candlestick charts reveal the battle between buyers and sellers during a specific period, making them an essential part of technical analysis. Learning how to read candlestick charts correctly can help traders make better decisions and improve their overall trading performance.
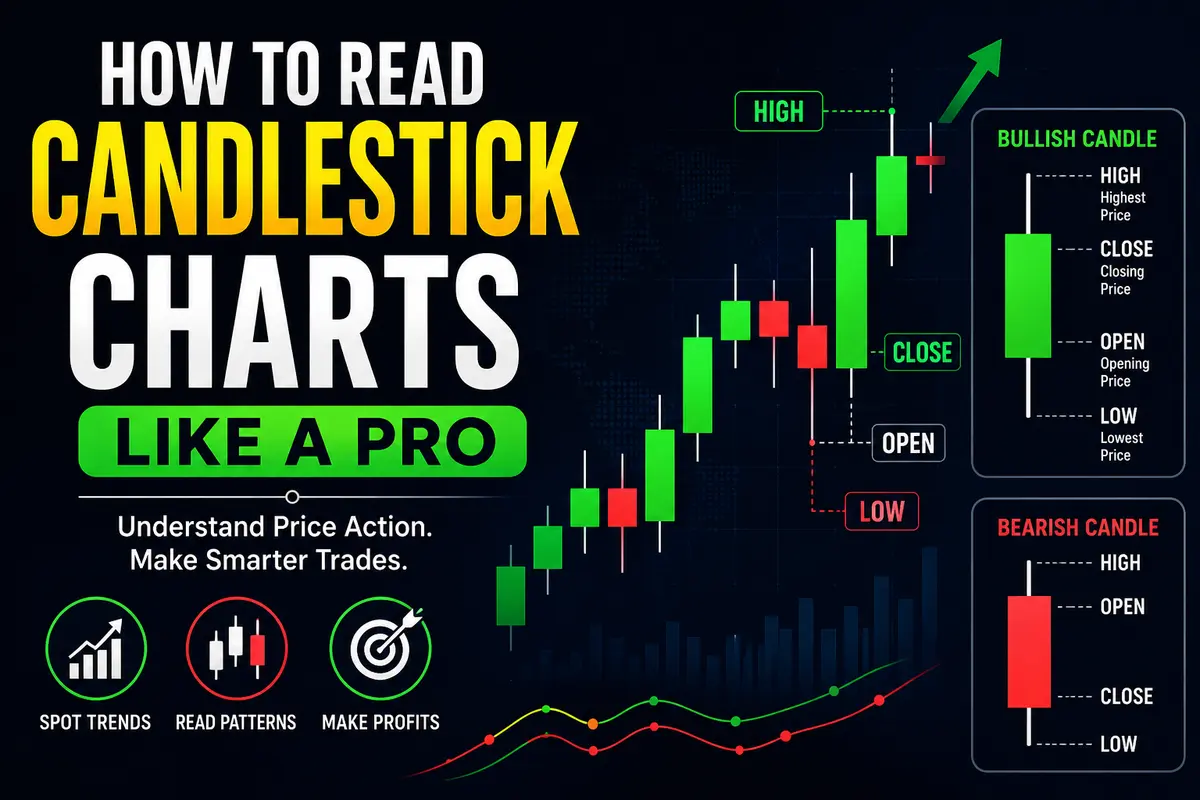
A candlestick represents the price movement of a currency pair over a selected timeframe. This timeframe can be one minute, five minutes, one hour, four hours, one day, or even one month. Each candlestick tells a story about what happened during that period by showing four important prices: the opening price, the highest price, the lowest price, and the closing price.
Every candlestick consists of two main parts: the body and the wicks, also known as shadows. The body shows the difference between the opening and closing prices. The wicks represent the highest and lowest prices reached during the trading period. By examining both the body and the wicks, traders can understand who was in control of the market.
Bullish candlesticks indicate that buyers dominated the market during the selected period. These candles are commonly displayed in green or white, depending on the trading platform. A bullish candle forms when the closing price is higher than the opening price, showing that buyers pushed prices upward.
Bearish candlesticks show that sellers controlled the market. They are usually displayed in red or black. A bearish candle forms when the closing price is lower than the opening price, indicating that sellers successfully drove prices lower during that trading session.
The size of a candlestick's body is also important. A long bullish body suggests strong buying...