
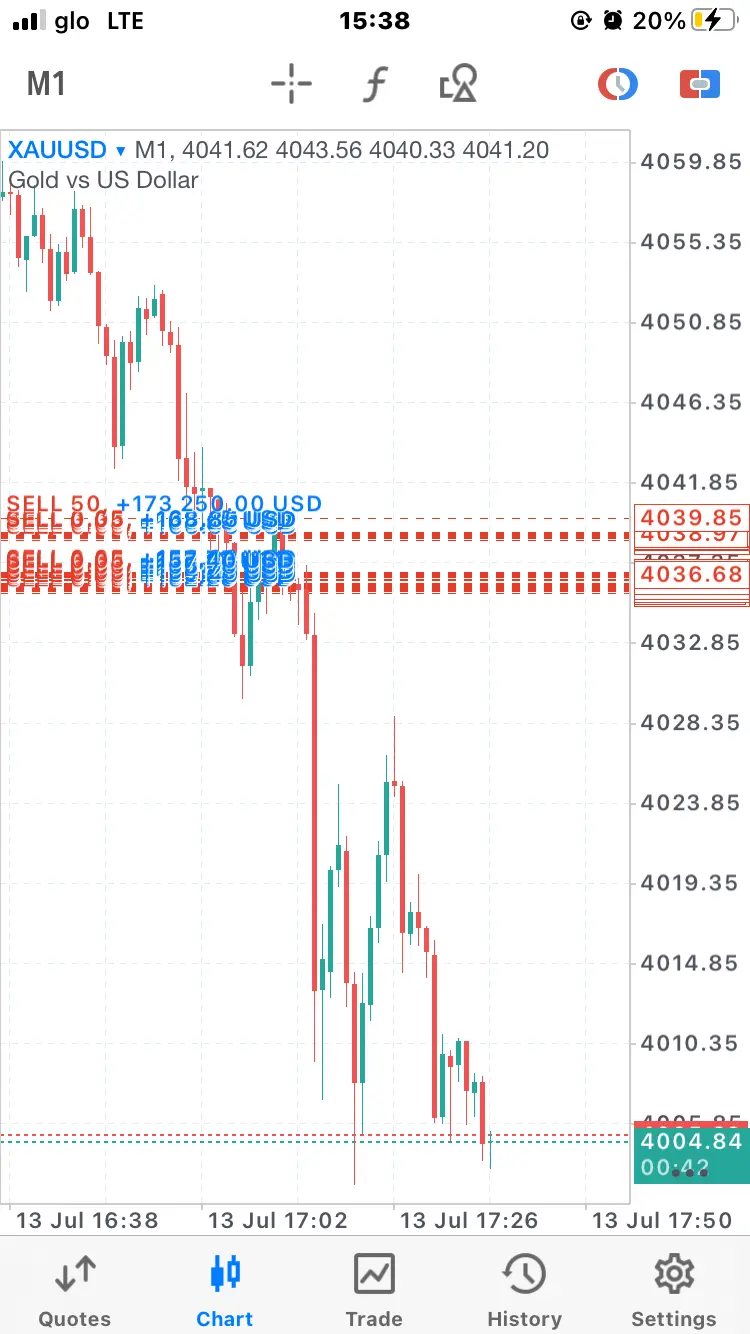
Mastering Market Structure: The Universal Map Every Trader Needs

Mastering Market Structure: The Universal Map Every Trader Needs
Every market tells a story.
Whether you are staring at a 5-minute chart of Bitcoin, analyzing the daily candles of Apple stock, or tracking momentum on EURUSD ... , price action leaves distinct clues. Yet, most retail traders spend years chasing lagging indicators—searching for a secret moving average crossover or a magical RSI setting that will guarantee consistent profits.
The cold truth? Indicators only show you what has already happened. They are mathematical derivatives of past price. To understand where price is going next, you must master the fundamental blueprint behind every market: Market Structure.
What Is Market Structure?
At its core, market structure is the universal framework describing how price moves in natural cycles. Markets never move in straight lines indefinitely. They expand, contract, reverse, and consolidate as buyers and sellers continuously compete for liquidity.
Regardless of the asset class or timeframe, market structure consists of three primary phases:
1. Uptrend: Defined by a series of Higher Highs (HH) and Higher Lows (HL). Buyers are aggressively pushing price upward, and sellers are only able to cause minor, temporary pullbacks.
2. Downtrend: Defined by Lower Highs (LH) and Lower Lows (LL). Sellers dominate, systematically breaking key support levels while buyers fail to defend previous swing points.
3. Consolidation (Range): Price is trapped between a clear resistance ceiling and support floor. Neither side has control, creating a neutral environment where institutional liquidity builds up on both sides.
Understanding which phase the market is currently in saves you from making the single most common retail trading error: fighting the macro trend.
The Shift: Spotting the Break of Structure & CHOCH
Trading becomes significantly clearer when you learn to identify a Break of Structure (BOS). A break of structure occurs when price forcefully closes beyond a key swing high or low, confirming that the current trend is maintaining its momentum and expanding.
However, trends do not last forever. When a market is ready to reverse, it signals this shift through a Change of Character (CHOCH).
Imagine a stock in a clean uptrend, making steady Higher Highs and Higher Lows. Suddenly, price drops with sudden volume and breaks below the most recent Higher Low. That breakdown is your warning light. It tells you that institutional supply has flooded the market, invalidating the bullish structure and setting the stage for a potential downtrend.
For beginners, watching for a CHOCH prevents you from “buying the dip” on a falling knife. For advanced traders, it provides high-probability entry points right as a new trend begins, well before lagging indicators catch on.
Institutional Liquidity and Order Blocks
To truly master structure, you must understand why price moves to certain levels. Big market players—such as hedge funds, central banks, and market makers—cannot simply enter full positions at any moment without causing massive slippage. They need liquidity.
Liquidity sits right beyond obvious structural points:
* Above major equal highs (where retail stop losses for short positions live as buy stops).
* Below major equal lows (where retail stop losses for long positions live as sell stops).
Institutions will frequently drive price past these structural key levels to “sweep” liquidity, triggering retail stops to fill their own massive orders. Once that liquidity is absorbed, price quickly reverses back into the true structural direction. This phenomenon is often mistaken by retail traders for a “fakeout,” but it is simply market efficiency in action.
Why Structure Applies to Every Asset Class
One of the biggest mistakes traders make is assuming different markets require entirely different foundational rules. While volatility and leverage differ, human psychology remains constant—and price charts simply reflect human behavior.
* Forex: Driven by macroeconomic data and central bank policy. Yet, institutional bank orders consistently respect major structural support and resistance levels across 4-hour and Daily timeframes.
* Stocks & Indices: Heavily influenced by quarterly earnings and broader economic sentiment, but major index movements (like the S&P 500 or Nasdaq) follow classic trend structure, respecting key pullback zones before pushing to new highs.
* Crypto: Known for wild volatility and news-driven momentum. Even so, Bitcoin and Ethereum respect market structure during both bull and bear cycles, often sweeping liquidity above old highs before major macro reversals.
* Options: Options traders rely heavily on direction and timing. Reading market structure allows options buyers to time breakout entries when implied volatility expands, while options sellers can safely place credit spreads beyond strong structural barriers.
Bringing It All Together: A Practical Rule Set
To turn market structure into an actionable trading framework, keep these core rules in mind every time you open a chart:
1. Trade Top-Down: Start on the Daily or 4-Hour chart to establish the overall market direction. Use the 15-Minute or 5-Minute chart purely for precise execution and risk management.
2. Never Buy at the Extension: Wait for price to pull back to a key Higher Low, order block, or discount zone before taking a long position.
3. Respect Candle Closes: Wicks show rejection, but body closes confirm structure. Always wait for a candle body close past a structural point to confirm a genuine break.
By stripping away clutter and focusing purely on market structure, you align your strategy with how smart money actually operates. Master the structure, and the chart will finally tell a clear story.

Comments
No comments yet. Be the first to share your thoughts!
Authentication Required
You must be logged in to post a comment.