

Volume Profile Analysis — Point of Control (POC) and Value Areas
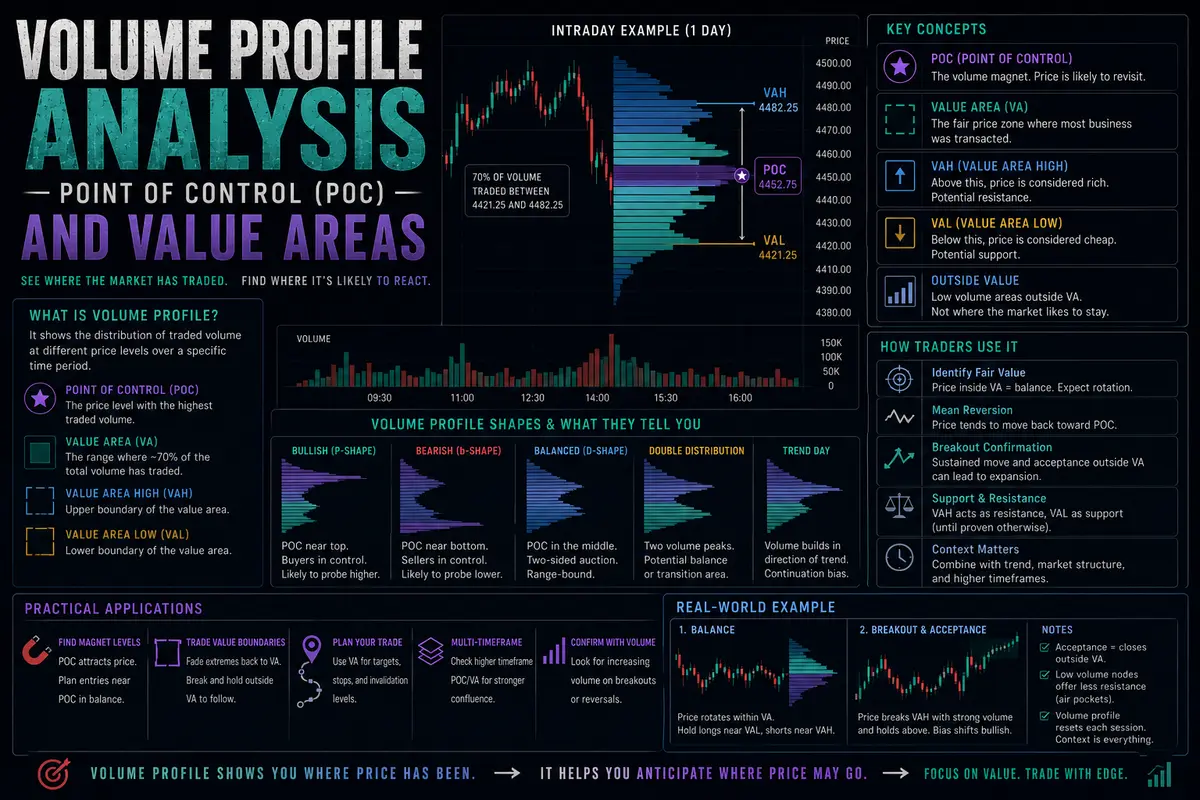
When standard technical analysis relies exclusively on time-based volume charts displayed along the bottom of a price graph, it measures trading activity horizontally. This approach tells you how much volume was traded during a specific 5-minute or 1-hour candle, but it obscures where volume was distributed relative to absolute price levels. Volume Profile flips this paradigm entirely by plotting trading activity on the vertical axis, revealing precisely how much volume accumulated at every specific price tier over a given session or multi-day period.
By mapping volume against price rather than time, Volume Profile shifts a trader’s focus from when trades occurred to where fair value was established and accepted by the market. Mastering key volume profile concepts—such as the Point of Control, Value Area, and Volume Nodes—transforms structural chart reading into an auction market analysis framework.
The Core Architecture of Volume Profile
Unlike a standard time-based volume histogram that extends vertically beneath each candle, a Volume Profile histogram extends horizontally outward from the price scale. Every horizontal bar represents the total volume of contracts or shares traded at that exact price level, regardless of whether those trades occurred during the morning session or late in the afternoon.
This structural display identifies how market participants negotiate value over time:
-
Auction Market Theory Principle: Markets are continuous auctions designed to facilitate trade. When buyers and sellers agree on price, volume accumulates heavily. When price is deemed unfair or too high/low, volume thins out rapidly, leading to fast price rejection or acceptance.
-
The Value Area: Statistical theory dictates that a normal distribution accounts for roughly 68% of all data points. In Volume Profile analysis, the Value Area represents the price range where 70% (or standard exchange conventions of 68%) of all total volume was transacted during the specified timeframe.
Key Volume Profile Components Explained
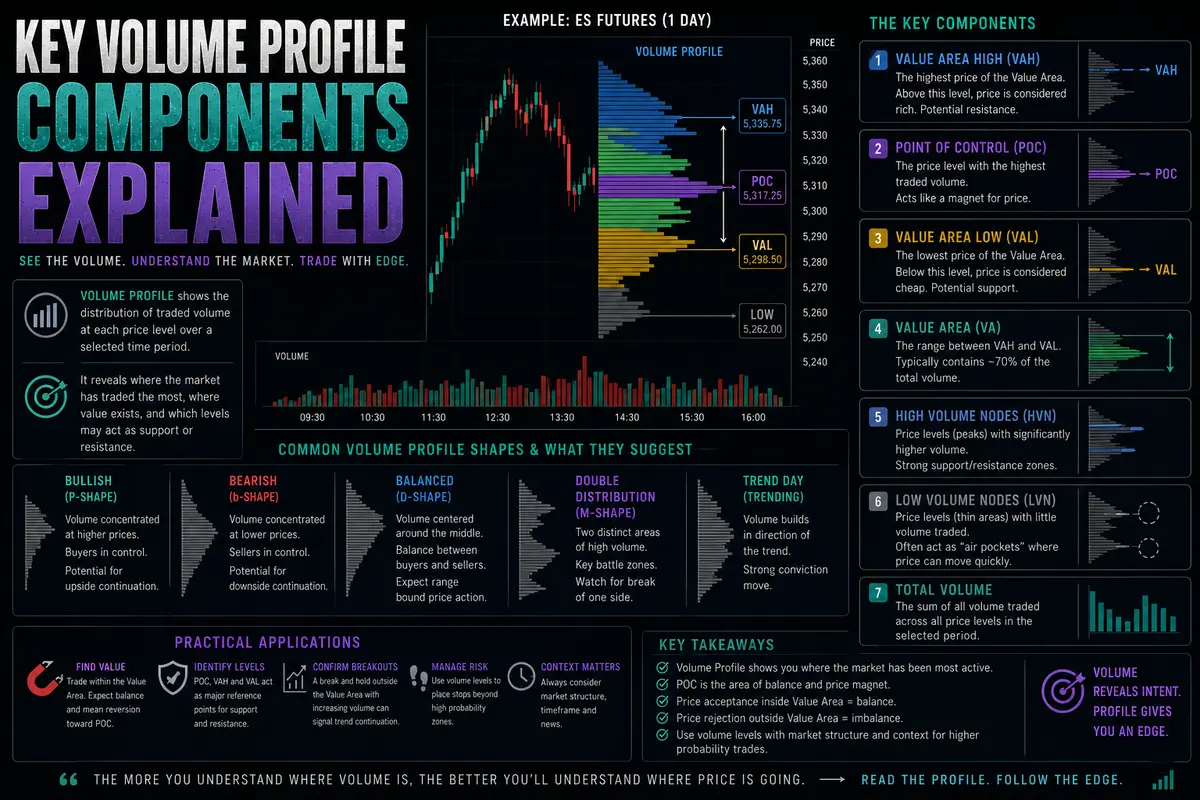
To read a volume profile effectively, you must understand its three foundational structural components:
1. The Point of Control (POC)
The Point of Control is the single horizontal price level within the entire profile where the absolute highest volume was traded.
-
Fair Value Magnet: The POC represents the ultimate point of agreement between buyers and sellers—the true “fair value” price for that asset during the measured period.
-
Price Magnet Behavior: When price moves away from the POC due to sudden news or momentum, the POC acts as a powerful statistical magnet. Markets frequently rotate back toward the POC to retest fair value before establishing a new directional trend.
2. Value Area High (VAH) and Value Area Low (VAL)
The upper and lower boundaries that encompass the 70% volume threshold are designated as the Value Area High (VAH) and Value Area Low (VAL).
-
VAH (Value Area High): The upper boundary of fair value. Prices trading above the VAH are considered statistically expensive or overvalued relative to the session’s accepted auction volume.
-
VAL (Value Area Low): The lower boundary of fair value. Prices trading below the VAL are considered statistically cheap or undervalued.
3. High Volume Nodes (HVNs) and Low Volume Nodes (LVNs)
Within the profile histogram, volume clusters unevenly, forming distinct peaks and valleys:
-
High Volume Nodes (HVNs): Peaks in the profile where significant volume was transacted. These represent areas of prolonged consolidation, heavy institutional participation, and market consensus. HVNs act as thick structural support and resistance zones.
-
Low Volume Nodes (LVNs): Valleys or gaps in the profile where very little volume was transacted. These represent areas of rapid price rejection or aggressive momentum. When price enters an LVN, it typically slices through the zone quickly because there are no resting limit orders or historical volume clusters to absorb the move.
Profile Shapes and Market Regimes
The overall visual shape of a volume profile provides immediate contextual insight into the prevailing market regime:
-
The D-Shape Profile (Balanced Market): A bell-shaped or symmetrical D-shape profile indicates a balanced, two-way auction driven by range-bound rotation. The POC sits comfortably in the middle, and volume tapers off smoothly toward the VAH and VAL. In this regime, fade trades from the value area extremes back toward the POC dominate profitability.
-
The P-Shape Profile (Short Squeeze / Accumulation): A profile shaped like the letter P features a heavy volume cluster at the lower end of the range, tapering off into a thin volume tail at the top. This indicates that aggressive short-covering or heavy institutional accumulation occurred at lower prices, driving price higher where liquidity thinned out.
-
The b-Shape Profile (Long Liquidation / Distribution): A profile shaped like a lowercase b features a heavy volume cluster at the upper end, tapering into a long thin tail at the bottom. This reveals aggressive long liquidation or distribution at high prices, followed by a rapid breakdown through thin liquidity below.
Practical Execution Strategies Using Volume Profile
-
Trade the Value Area Extremes: When price opens or rotates outside of the prior day or week’s Value Area High (VAH) or Value Area Low (VAL), evaluate how price reacts. If price pushes abo
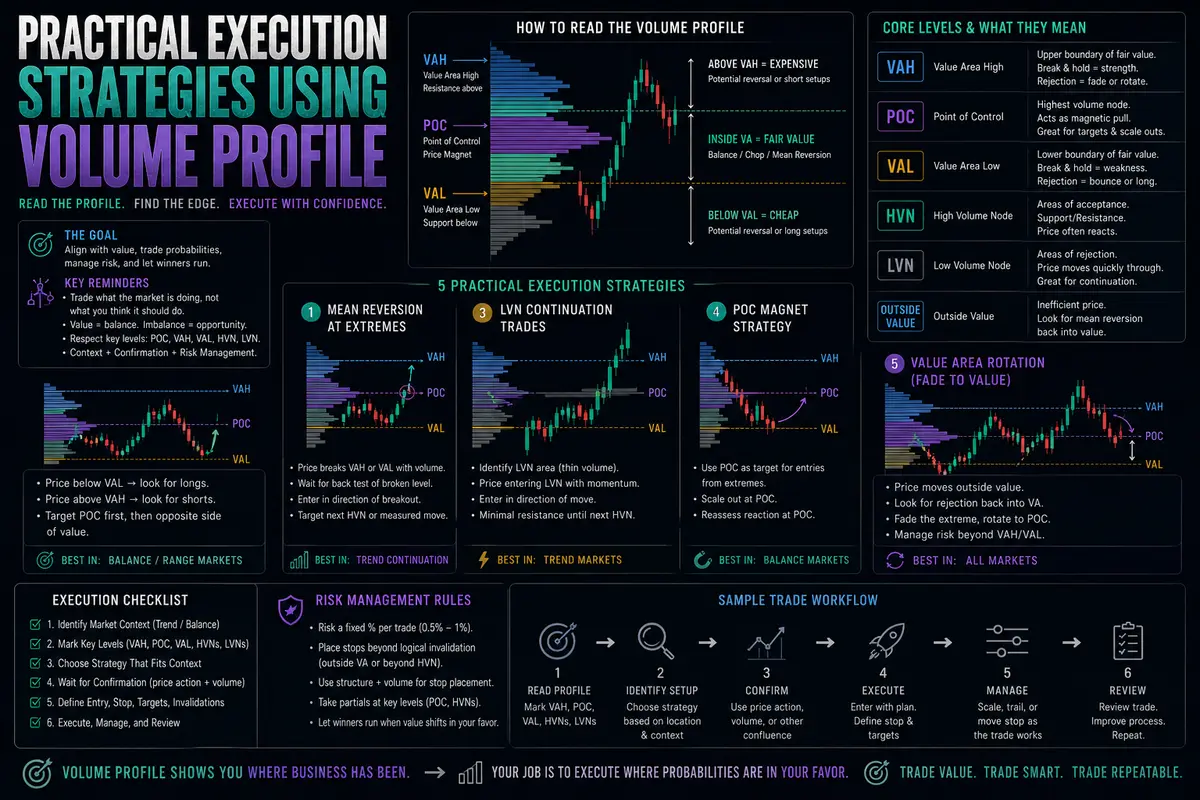
ve the VAH but fails to sustain acceptance (showing low volume on footprint or thin acceptance), fade the move back inside the Value Area, targeting the POC as your primary profit objective.
-
Exploit Low Volume Nodes for Breakouts: Because LVNs represent structural air pockets where trading activity was sparse, use them as entry zones for momentum continuation. When price breaks out of a consolidation range and enters an LVN, expect rapid price acceleration through that zone.
-
Reference Prior Session POCs: Multi-day or composite volume profiles reveal where major historical value was established. Approaching a prior session’s POC often triggers heavy institutional defense or absorption. Use these levels to scale out of existing positions or identify high-probability reversal zones.
-
Avoid Executing Inside High Volume Nodes: Because HVNs represent dense zones of two-way agreement and fair value rotation, entering directional trend trades directly inside an HVN exposes your position to whipsaw chop. Wait for price to migrate away from high volume consensus nodes toward low volume profile edges before initiating new directional exposure.

Comments
No comments yet. Be the first to share your thoughts!
Authentication Required
You must be logged in to post a comment.