

The Head and Shoulders Chart Pattern
Introduction to the Head and Shoulders Pattern
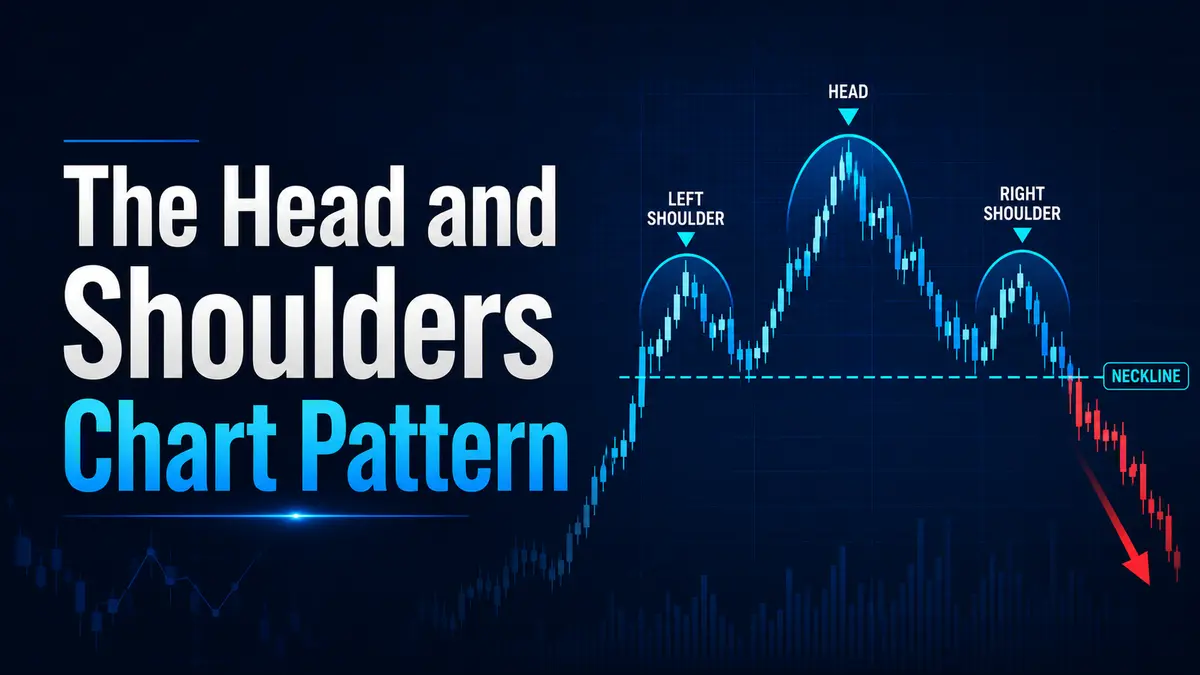
The Head and Shoulders chart pattern is widely recognized as one of the most reliable and effective trend reversal formations in technical analysis. It signifies a profound shift in market sentiment, marking the transition from a dominant bullish trend to an emerging bearish trend. Structurally, this pattern can be understood as an advanced variation of the triple top formation. However, unlike a standard triple top where all three peaks hit similar resistance levels, the Head and Shoulders pattern features a distinct central peak that rises significantly higher than the two surrounding extrema.
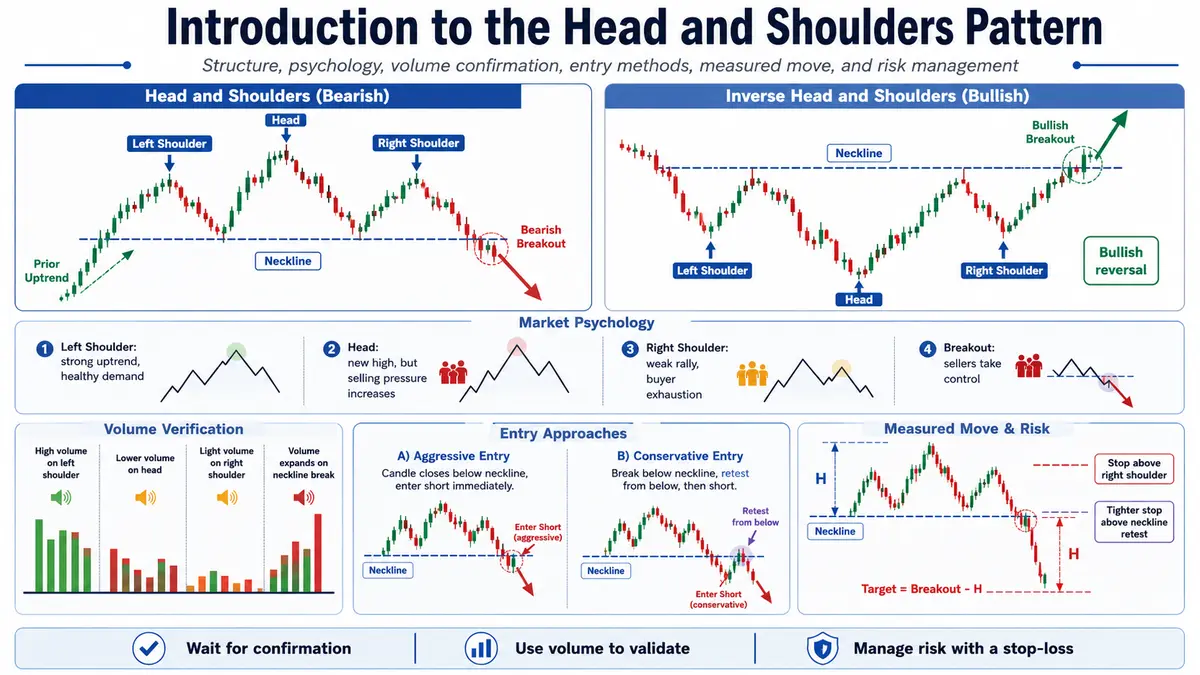
In a textbook implementation of this pattern, the two outer peaks (the shoulders) are roughly equal in height, and the intermediate local troughs (the price valleys between the peaks) align on a similar horizontal or slightly tilted plane. This foundational support zone forms what traders call the “neckline”. When price action decisively violates this neckline, it provides a highly reliable technical signal to initiate short positions.
The Inverse Head and Shoulders (Bottom)
Conversely, the exact same structural logic applies to market bottoms following a prolonged downward trajectory. Known as the “Inverse Head and Shoulders” or “Head and Shoulders Bottom,” this formation mirrors the top pattern completely. It develops at the exhaustion point of a bearish trend, where the central valley drops significantly lower than the flanking left and right shoulders. In this scenario, the neckline acts as a major overhead resistance level. A clear breakout above this neckline serves as a powerful confirmation that the bearish trend has concluded, generating a robust buy signal for long-term market participants.
Market Psychology and Volume Dynamics
To trade this pattern successfully, a trader must look past the superficial geometric shape and understand the underlying auction dynamics and behavioral psychology driving the price action. Each component of the formation represents a structural shift in the balance of power between buyers (bulls) and sellers (bears).
Behind the Scenes: Buyer Exhaustion
During the formation of the left shoulder, the market behaves normally within an established uptrend, making a higher high on healthy buying momentum, followed by a routine corrective pullback. The surge toward the “head” represents a massive push by the bulls to achieve new price territory. However, the subsequent decline back down to the neckline support level provides the first warning sign: the deep retracement indicates that selling pressure is intensified, wiping out almost all the gains made during the head’s rally.
The final phase occurs at the right shoulder, where bulls attempt to revive the macro uptrend. Their inability to push the price anywhere near the peak of the head demonstrates severe buyer exhaustion. At this juncture, demand has dried up, setting the stage for a comprehensive distribution phase.
The Critical Role of Volume Verification
Volume acts as the ultimate validation metric for the Head and Shoulders pattern. In an authentic reversal setup, volume behaves in a specific, predictable manner across the three peaks:
-
Left Shoulder: Accompanied by high, robust volume, reflecting strong institutional participation in line with the preceding uptrend.
-
The Head: Price reaches a new high, but often on lower or diminishing volume compared to the left shoulder. This divergence reveals a loss of buying momentum.
-
Right Shoulder: Experiences noticeably light volume, proving that there is little to no demand backing the upward price movement.
-
The Breakout: As the price approaches and cracks through the neckline, volume should expand dramatically, validating that institutional supply is aggressively dumping the asset.
How to Trade the Pattern Effectively
Trading the Head and Shoulders formation requires discipline and strict adherence to systematic confirmation rules. Entering a trade prematurely — before the pattern is fully formed and confirmed — can lead to severe losses due to failed patterns or extended consolidations.
Identifying the Neckline and Entry Points
The first step is drawing an accurate neckline by connecting the low points established after the left shoulder and after the head. While a perfectly horizontal neckline is ideal, it is common to encounter necklines that slope upward or downward.
Position execution occurs exclusively within the breakout zone. Traders generally choose between two primary execution strategies depending on their risk tolerance:
-
The Aggressive Approach: Entering a short position immediately when a specific candle (typically on a daily or 4-hour timeframe) breaks and closes below the neckline. This ensures entry into fast-moving markets but carries the risk of encountering a “fakeout”.
-
The Conservative Approach: Waiting for the price to break below the neckline and subsequently execute a corrective rally back up to retest the neckline from below. Once the neckline (former support) successfully holds as new resistance, a short position is safely initiated.
Measuring Price Targets (The Measured Move)
One of the most powerful attributes of this chart pattern is its built-in, mathematical approach to calculating take-profit targets, commonly referred to as the “measured move”.
To determine the price objective, a trader measures the exact vertical distance from the peak of the head down to the closest point on the neckline. This distance represents the structural height of the pattern. Once the breakout occurs, this exact value is projected downward from the specific breakout point on the neckline. Mathematically, the target price can be expressed as: Target = Price(Breakout) – (Price(Head) – Price(Neckline)).
Risk Management and Stop-Loss Rules
No technical indicator or pattern is infallible. To safeguard trading capital against invalidation or sudden market reversals, systematic stop-loss placement is non-negotiable.
For standard configurations, the ultimate invalidation level sits just above the peak of the right shoulder. If the price rallies past the right shoulder, the bearish thesis is fundamentally disproven. Alternatively, more conservative traders utilizing the retest method can place a tighter stop-loss immediately above the newly established neckline resistance or above the high of the specific breakout candle, locking in a highly favorable risk-to-reward ratio.
Practical Trading Examples
To illustrate how these structural rules manifest in real-world market environments, let us analyze two detailed case studies representing both top and bottom reversals.
Example 1: Classic Head and Shoulders in an Equity Market (Short Setup)
-
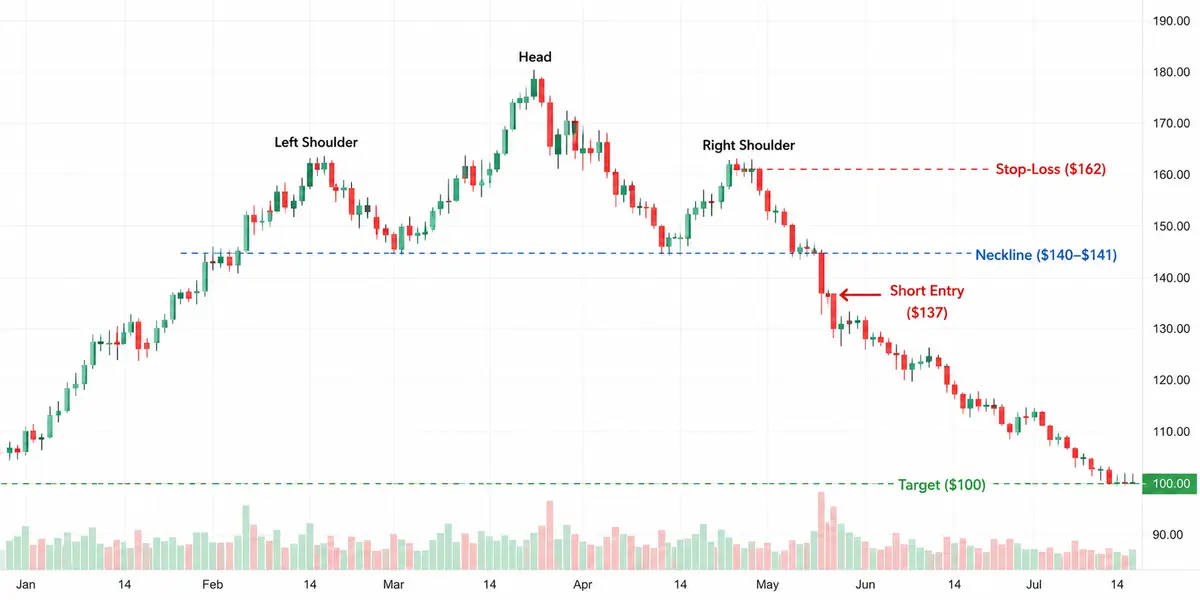
Imagine a highly valued blue-chip technology stock that has been locked in a powerful macro bull run, advancing steadily from $100 up to $160.
-
At $160, institutional profit-taking triggers a temporary retracement down to $140, forming the Left Shoulder.
-
A renewed wave of retail enthusiasm pushes the stock to an all-time high of $180 on declining volume.
-
Aggressive short-sellers step in, driving the price back down to $141, completing the Head and solidifying a horizontal Neckline at the $140-$141 zone.
-
A weak, low-volume rally follows, stalling out predictably at $159 to form the Right Shoulder.
-
Two days later, a high-volume daily candle breaks below support and closes firmly at $137.
-
The pattern height is calculated as $40 ($180 head minus $140 neckline).
-
The measured profit target is set at $100 ($140 neckline minus $40 height).
-
An aggressive trader enters short at the candle close of $137, placing a stop-loss at $162 (just above the right shoulder).
-
The stock proceeds to decline over the next three weeks, hitting the $100 profit target perfectly and yielding an exceptional return on risk.
Example 2: Inverse Head and Shoulders in Cryptocurrency (Long Setup)
-
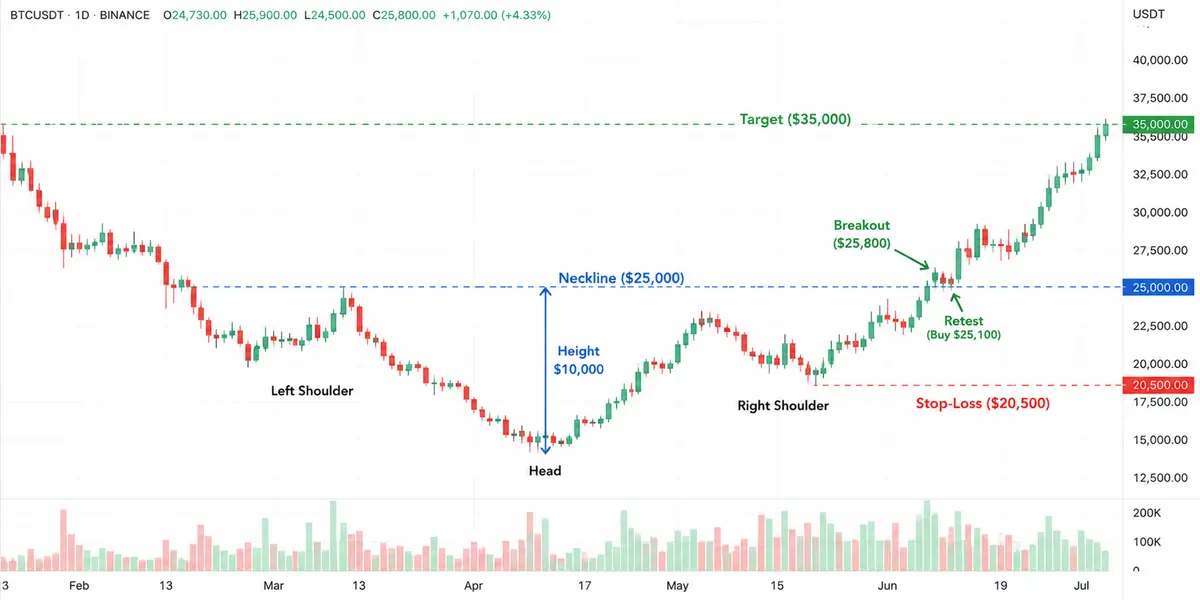
Consider a major cryptocurrency asset that has suffered under a grueling multi-month bear market, collapsing from $50,000 down to a local low of $20,000, where it bounces up to $25,000 to construct the Left Shoulder.
-
A final, panic-driven capitulation wave drives the price down to a macro bottom of $15,000 on massive liquidation volume.
-
Savvy institutional buyers accumulate the asset at this deep discount, driving the price back up to the $25,000 mark.
-
This establishes a strong, horizontal Neckline resistance at $25,000, completing the Head.
-
The price drifts downward one last time, forming a shallow trough at $21,000 on negligible volume to establish the Right Shoulder.
-
A massive influx of buying volume subsequently materializes, propelling the asset upward.
-
A 4-hour candle violently pierces the neckline, closing at $25,800.
-
The pattern height is $10,000 ($25,000 neckline minus $15,000 head).
-
Projected upward from the breakout, the target is $35,000 ($25,000 plus $10,000).
-
A conservative trader waits for a brief corrective retest, buying the asset as it taps $25,100 from above.
-
A stop-loss is positioned safely at $20,500 (below the right shoulder), and the asset successfully rallies onward to hit the $35,000 objective.

Comments
No comments yet. Be the first to share your thoughts!
Authentication Required
You must be logged in to post a comment.