

What’s next for Oil 2.0
The optimists ordered a taco: flows normalize, draws stop, the worst is behind us. Two months and a second chokepoint later, the kitchen sent out nachos. Messier, and nobody ordered them.
The follow-up to “What’s Next for Oil” July 25, 2026
Everyone wants the taco. A clean ceasefire, ships streaming through Hormuz, oil back under $70, and the whole crisis filed away as a scare. Instead, the world got served nachos, a messy pile that keeps getting messier. We now have more hands in the dish every week and no clean way to pick it up. That’s where we are.
The first piece argued the market had pre-committed to optimism and an inventory clock that doesn’t care how anyone feels. It laid out three scenarios and said mid-July was the test. Mid-July came. Here’s where we actually landed, and it isn’t Scenario A.
Let me walk you through why the market is still priced for a taco and why I think it’s dead wrong.
I. The optimists got exactly one thing right
Give them their due: over the last month, the escaping ships did their job. Barrels crept back out of the strait, the export pull on American crude eased just enough, and U.S. commercial inventory managed a small build. That build is real. It’s also the entire basis of the oil bear-case victory lap, and it’s being badly misread.
Commercial crude sits at 411.7 million barrels; this is down just 1.7% year-over-year. The optimists wave that number around as proof the crisis was overblown. Look how flat inventories are. But let’s be fair: there’s currently no shortage in crude in the US and anyone claiming there is a current shortage is selling clicks, not reality.
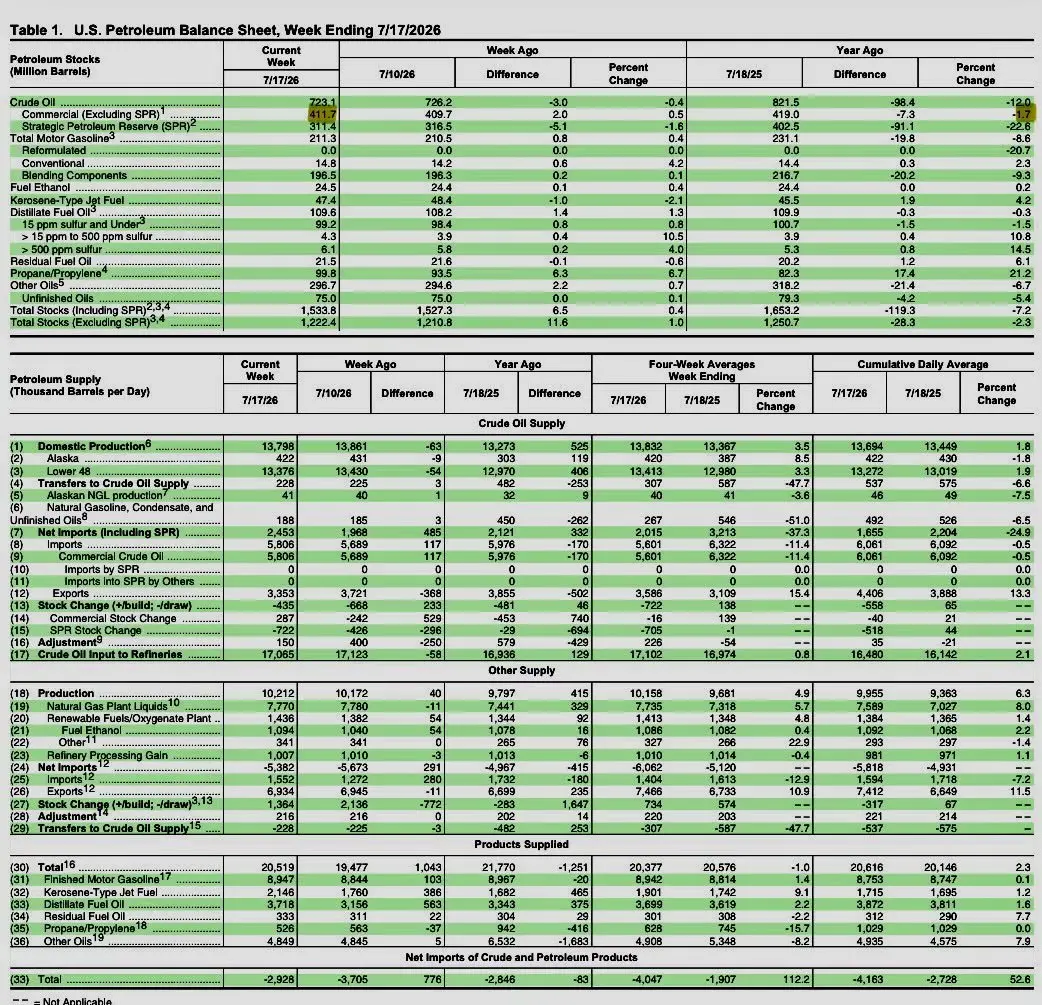
Fig. 1: EIA Table 1, U.S. Petroleum Balance Sheet (week ending 7/17/2026). Commercial crude (excluding SPR) sits at 411.7 MM bbl vs. 419.0 a year ago — barely down 1.7%. The tank held near flat only because the buffers took the hit. Source: U.S. EIA Weekly Petroleum Status Report.
Here’s the crisis those flat commercial inventories are hiding. Commercial should be falling. A war shut the world’s most important chokepoint for months, and American barrels became the planet’s release valve. A draw that violent should have punched straight through commercial stock. It didn’t, for one reason: two buffers took the hit instead. The global SPR release and China’s buyer’s strike absorbed the blow that belonged to commercial.
That isn’t resilience. It’s a bill being deferred. Both buffers are nearly spent and when they run out, the pull moves straight onto commercial, which is exactly when it starts drawing toward the spring lows. Flat inventory today is not the absence of a squeeze. It’s the squeeze, paid for by someone else, for now.
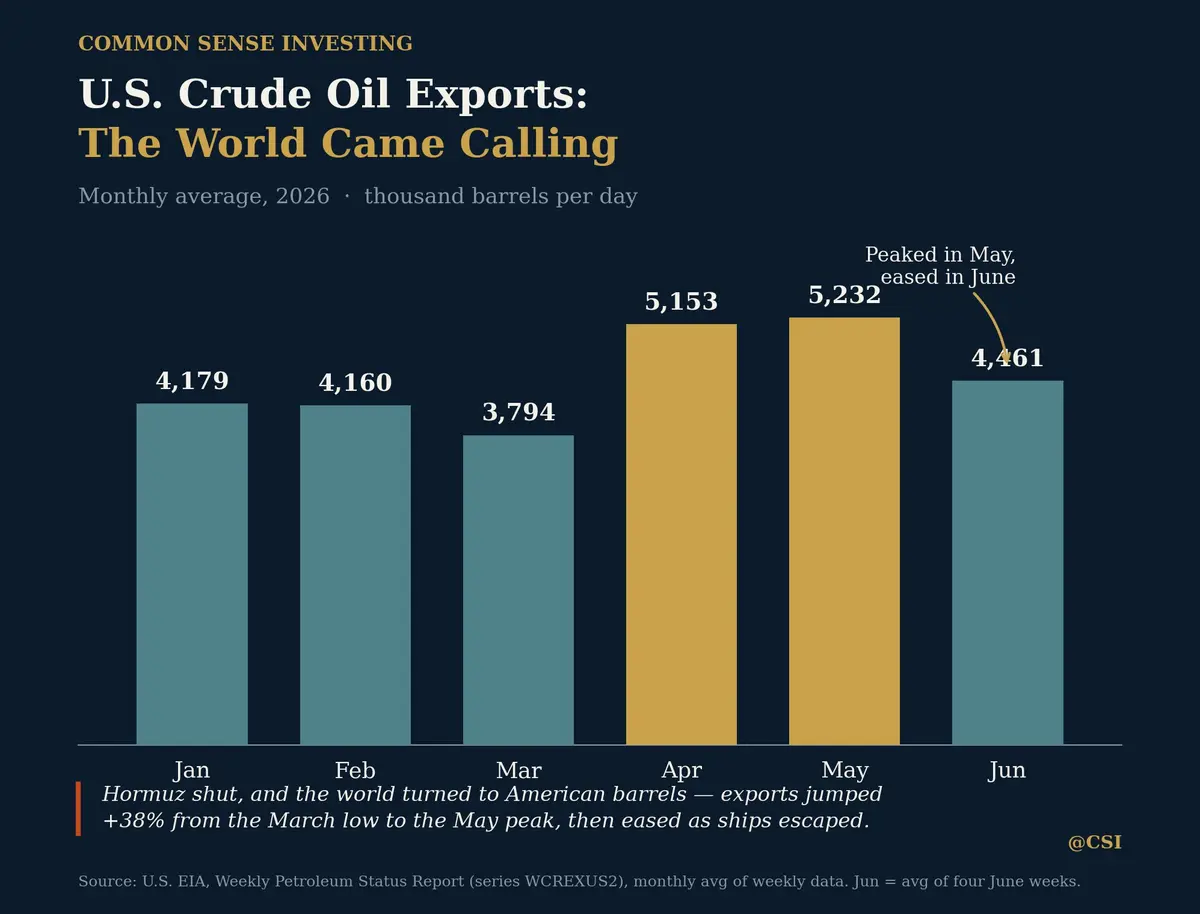
Fig. 2: U.S. crude exports by month, 2026 (monthly average of EIA weekly data, thousand bbl/day). Hormuz shut and the world turned to American barrels: exports jumped +38% from the March low to the May peak of 5,232, then eased to 4,461 in June as some ships found their way out. Source: U.S. EIA, Weekly Petroleum Status Report (series WCREXUS2).
II. Round 1 already told us how this works
Rewind. The war began February 28th. The first ceasefire landed April 7th. And the strait? It didn’t see sustained transit until mid-June. This was more than two months after the war was supposed to have gone quiet. During that entire window the world was still losing barrels while an on-again, off-again ceasefire flickered and the chokepoint stayed shut.
That lag is the whole game. The market reads “ceasefire” and “supply restored” as the same headline. Round 1 says they’re a quarter apart.
Now fast-forward, and it’s worse. The war isn’t calmer. There are more parties at the table than at any point since it began, and the Houthis and Saudis are now trading fire directly. Reported estimates put the barrels the Houthi blockade choked off from moving west last week at up to 2 million a day, a second chokepoint stacked on top of the first. In the figure below, we can see estimates from showing over 2mbd were choked off in the blockade of the Saudi’s this past week.
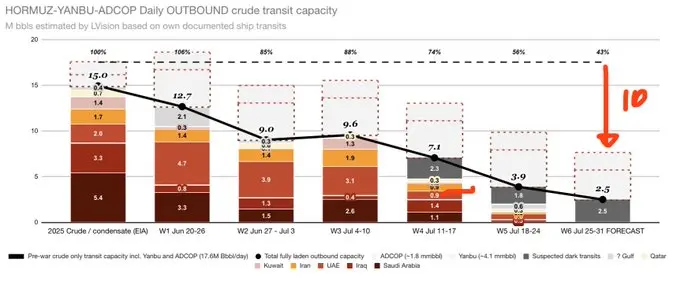
Fig 3: Source gave her a follow. Her estimates as stated, “Weekly crude oil loadings in the Persian Gulf fell from 6 mbd to 2.5 mbd over the past seven days; from Saudi Arabia’s Yanbu bypass, they fell from 5.3 mbd to 3.3 mbd.”
Meanwhile, Kpler’s director of commodity research went on CNBC this week and said the quiet part out loud: they’re pushing the reopening into next year, explicitly citing the Houthi–Saudi escalation as a new dimension on the timeline. When the trackers start talking in quarters instead of weeks, the market’s “any day now” pricing is living in Candyland.
III. Three scenarios, revisited
The original three paths, keyed to when Hormuz actually reopens, not when a ceasefire is signed, but when barrels move. The bands are the whole game: above 400 is OK, below 373 is the yellow, at 325 and below the commercial cushion is flashing red. Start from 418 million barrels of commercial crude, 340 in the SPR, and run the tape.
Scenario A: flows return to 100% MOU Sticks
The original consensus case in our first “What’s Next for Oil” article. Stuck ships leave, draws taper, and modest builds take over. Commercial troughs around 407, claws back across 400, and finishes the year comfortably in the low-to-mid 410s. That’s what “the worst is behind us” actually looks like: a normalization, not a glut. It’s also the scenario that needed the strait open by now. It isn’t.
This is not happening. We can check this one off the list. This is what the market priced in June, and it did not happen. It will not happen. Let’s move on from this scenario.
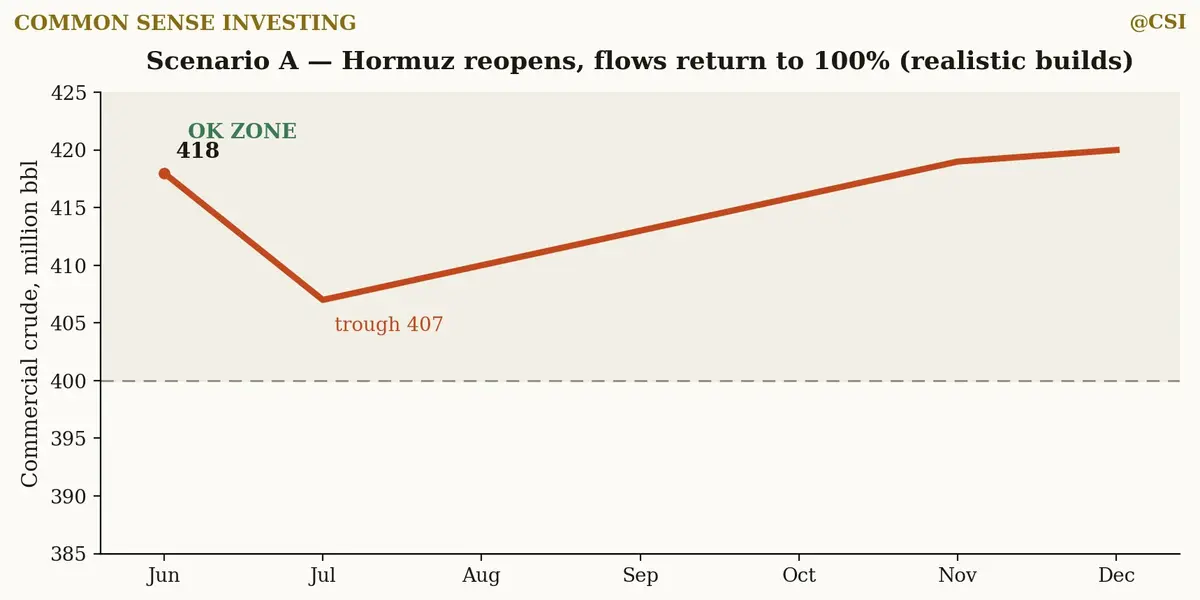
Fig. 4: Scenario A. Commercial crude troughs at 407 (July), rebuilds to ~420 by year-end, holding the OK zone above 400. This is the oil bear case the market is pricing.
Scenario B: flows only half-normalize
The honest middle. Ships leave and draws halve this year; we get a ceasefire in a few weeks, then after a month or so everyone acts normal. Commercial slides into the yellow and finishes the year around 366, with the SPR drained to roughly 260. This would be a moderate oil crisis occurring in slow-motion. We would expect to see crude around 120-130 a barrel here for a short time.
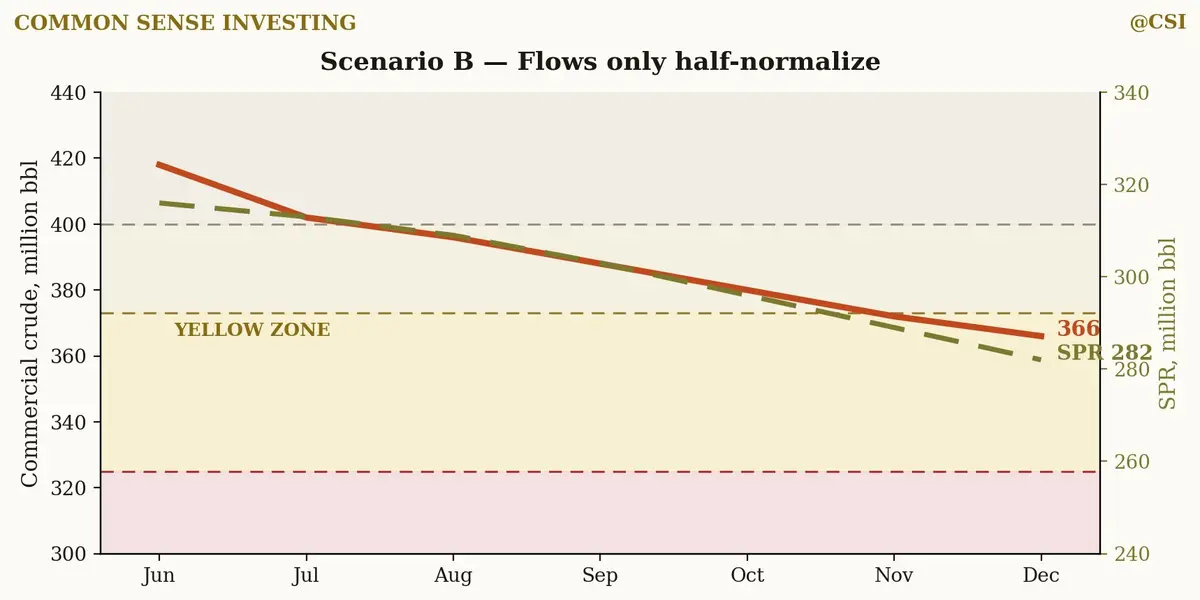
Fig. 5: Scenario B. Commercial drifts into the yellow zone (ends 366); SPR draws to 282 to cover the gap. Muddle-through with a shrinking cushion.
Scenario C: nothing changes, and we’re in it
The world where the strait remains closed for the considerate future and draws persist back at the levels we saw in April/May. The math gets ugly fast: commercial punches through 377, through 350, and ends the year near 302 deep in the danger band. All the while, the SPR grinds toward 250. This isn’t a forecast. It’s what the arithmetic does if we get back to the April/May draw rates. And with Kpler pushing reopening into next year, two chokepoints instead of one, and more parties at the table. We would expect to see crude at all-time highs here.
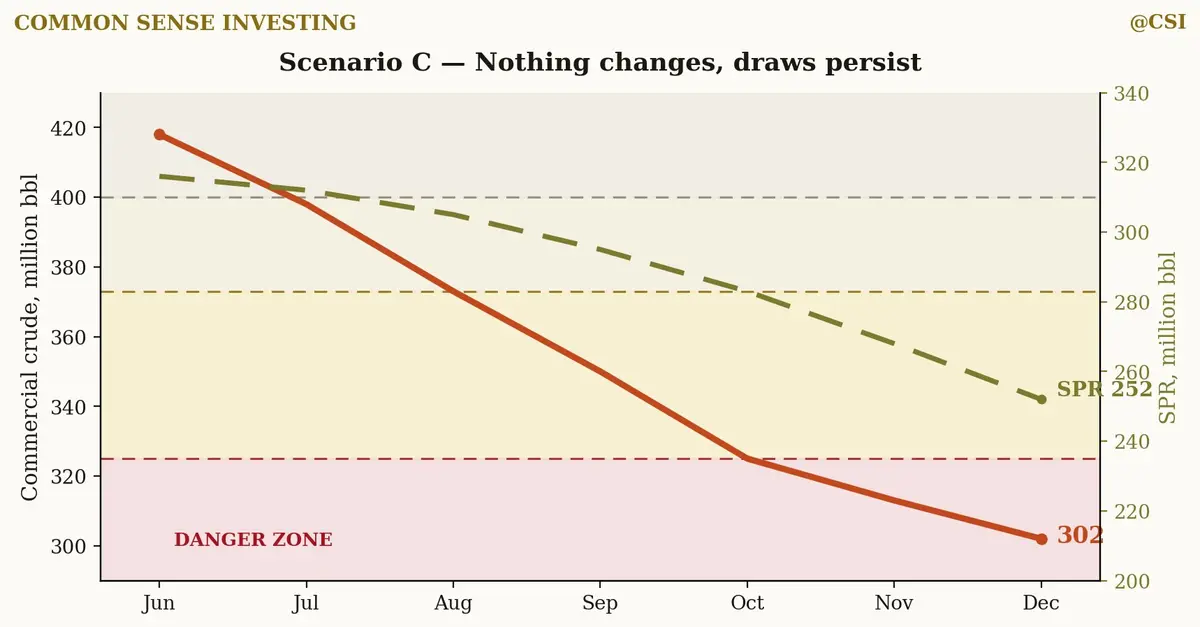
Fig. 6: Scenario C. Draws persist: commercial punches through 373 and 325 to end at 302, deep in the danger zone; SPR grinds to 252. The point is how little has to go wrong.
You could get a ceasefire next week. You still don’t get an open strait and now there’s a second one being choked.
IV. The call: less than a coin flip, and not the good half
Here’s the math the optimists won’t run. The first ceasefire hit April 7th; sustained transit didn’t return until mid-June. There was a two-to-three-month lag under simpler conditions than today’s. So even if a ceasefire lands next week, the strait realistically stays shut off/on for another two to three months with more parties involved this time. That puts any real reopening in the mid-October to November window at the earliest.
Which means the odds of a ceasefire and an open strait inside the next few months are, in my read, essentially 5–10%. Run the draws back to the April–May pace for a few more months, the Scenario C line, and you land on the number that matters. The SPR can physically go lower; the point is that I don’t expect it to. Washington committed to a 172-million-barrel draw, and roughly 250 million barrels is about where that announced draw is scheduled to stop. That isn’t a statutory hard floor; it’s the end of the program the government actually authorized. So, Scenario C doesn’t run the SPR to zero; it runs it to the edge of the release the U.S. said it would do, and then the release valve the world has leaned on all summer simply isn’t there anymore. The buffer isn’t just shrinking. It’s running out of authorization.
The optimistic case needed the strait open by now. It isn’t. The trackers are moving to next year. The buffers are nearly spent. And the market is still pricing a handshake it hasn’t even gotten. So hold your popcorn: we’re in between Scenario B & Scenario C.
V. So why hasn’t the market repriced?
Here’s the fair objection. If Scenario B or C is really where we’re headed, why hasn’t crude already ripped higher? If the setup is this obvious, why is the market sitting on its hands?
Because the market has barely shown up. Net positioning in crude is still low, nowhere near the levels you’d expect for a supply story this tight. This chart from Giovanni Staunovo lays it out: speculative net length, in both barrels and dollars, has participated only weakly in this latest move. The rally has happened without the crowd, not because of it.
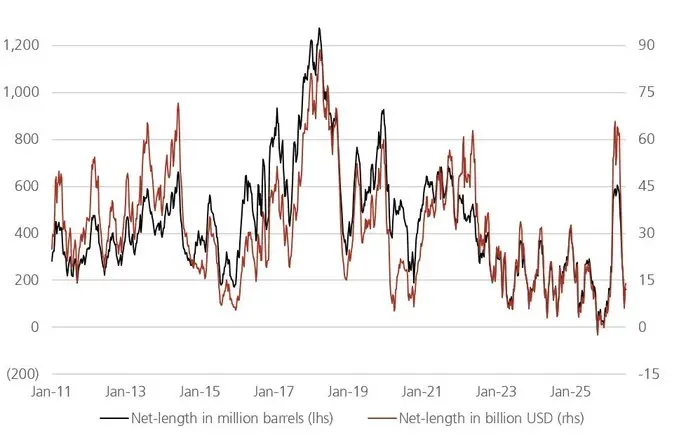
Fig. 7: Speculative net length in crude, in barrels (lhs) and dollars (rhs), 2011–2026. Positioning sits well off its historical peaks — the market has scarcely participated in the current move. Chart: Giovanni Staunovo.
Why is the crowd absent? Fear of a ceasefire. Everyone remembers getting run over on the headline the first time, and nobody wants to be long into a truce that tanks the price. But, as I argued in the earlier pieces, that is not manipulation. It’s mechanics. Because commercial inventory isn’t low, policymakers still have the room to jaw the price down: talk up a deal, lean on the SPR, remind everyone the strait could reopen “any day.” That verbal pressure has quietly pulled speculators out of the market. The fear isn’t irrational; it’s exactly the tool that’s keeping length suppressed.
Now flip the boat over. If the longs are absent, where’s everybody standing? Short. And not a little short — near the highs. This chart from 3Fourteen Research shows managed-money short as a percent of positioning, and the last read is 40.81%, up above the elevated line, with the 2026 spike touching roughly 48%. This is the highest on a chart that runs back to 2007.
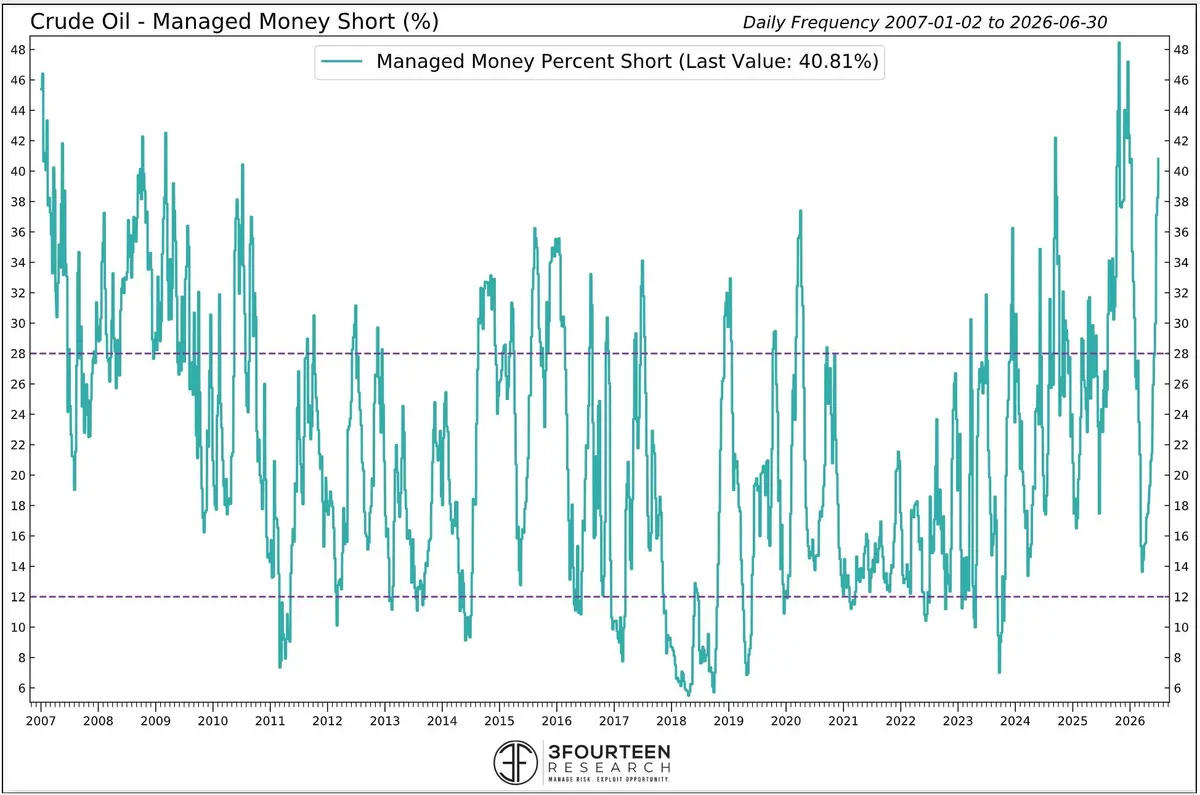
Fig. 8: Crude oil managed-money short, as a percent of positioning, daily 2007–2026 (last value 40.81%). Shorts sit near the top of the entire series. Chart: 3Fourteen Research.global
Three things jump off that chart. First, the last time shorts were stacked this high was the 2007–08 run — the one that ended with crude near $147. Second, look at 2022: when oil ripped toward $120, shorts were near nothing. And now, they’re near the highs. The market is doing what it always does, it is standing on the wrong side of the boat. It was un-short into the last top and heavily short into what may be the next one.
Why so offsides? Because participants are still pricing a clean reopening, and a lot of them got burned trading oil earlier this cycle and have gone timid. That’s understandable. But this time the ground has actually shifted underneath the consensus: China has restarted imports at higher levels than June, and the U.S. buffer —the SPR — is running down toward the end of its authorized draw. The two shock absorbers that kept the tank flat are both fading at once.
The market is short, timid, and pricing “nothing happens.” Reality gets the last word.
For the record, this isn’t a call I’m making from the sidelines. I went super long oil in January, and I’ve stayed in the entire way. I’ve said consistently: don’t over-leverage, be patient, let it come to you. That hasn’t changed. What I’d add now is simple. The crowd is positioned for a clean reopening that the timeline, the trackers, and the buffers all argue against. If we land somewhere between Scenario B and C, which is what I expect, price is the only variable left to do the rationing that supply can’t. That’s not a prediction of chaos. It’s just what the arithmetic does when the buffers are gone, and the shorts have to cover.
Disclosure & Disclaimer
This is a follow-up in an ongoing series. The author is positioned long the oil complex via BNO and related names. The three inventory scenarios are the author’s own forward extrapolations of EIA weekly data (commercial crude 411.7 MM bbl and SPR figures, week ending 7/17/2026) and recent draw rates; they are illustrative behavioral cases, not predictions, and the exact paths depend on assumptions stated in the text. Verify all figures against primary EIA and market sources before relying on them.


Comments
No comments yet. Be the first to share your thoughts!
Authentication Required
You must be logged in to post a comment.