Bar Pipa
We pay for a post of 10$

News

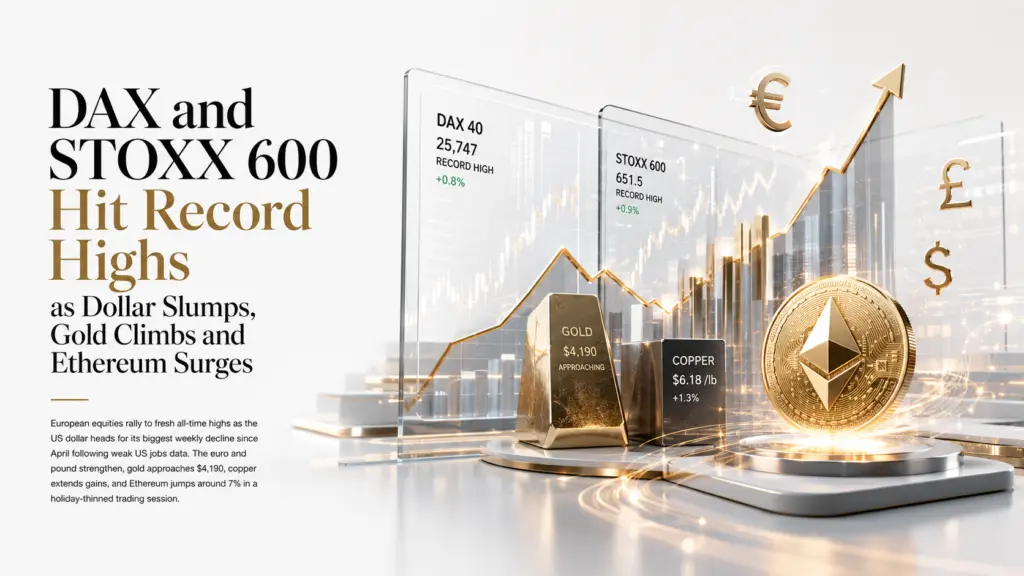
DAX and STOXX 600 Hit Record Highs as Dollar Slides Toward Worst Week Since April, Euro and Pound Rally, Gold Nears $4,190, Ethereum Surges 7%
DAX and STOXX 600 Hit Record Highs as Dollar Slides Toward Worst Week Since April, Euro and Pound Rally, Gold Nears $4,190, Ethereum Surges 7%

DXY ~100.8 -- on track for biggest weekly drop since early April. EUR/USD ~1.1443 two-week high. GBP/USD ~1.3365 best week in ~3 months. DAX 40 record ~25,747. STOXX 600 record ~651.5. Gold ~$4,185-$4,190. Copper ~$6.18/lb. ETH +7% to ~$1,717. Yen intervention watch live. US markets closed for Independence Day.

YEN INTERVENTION WATCH LIVE: FM Katayama issued fresh verbal warning Friday after yen touched 40-year low near 162.8 Thursday. Holiday-thinned session = elevated volatility risk.


LEVEL

SESSION STORY

EUR/USD

~1.1443

Two-week high. Up ~0.6% on week. Dollar weakness dominates over softer Eurozone CPI (headline 2.8%, core 2.4%).

GBP/USD

~1.3365

Best week in ~3 months (+1.2%). Bailey's Sintra remarks did little to slow the advance. Pure dollar-weakness story.

Gold XAU

~$4,185-$4,190

Extending advance. +1.3% on session. Dollar slide + reduced hike odds. WGC structural floor intact.

Copper

~$6.18/lb

+1.1-1.3% on session. Softer dollar + Goldman Sachs constructive demand commentary (EV, renewables, AI).

DAX 40

~25,747

Fresh all-time high. +0.65-0.9% on session. Siemens biggest boost (Kepler Cheuvreux upgrade). Defence names add.

STOXX 600

~651.5

Own record high. Best weekly rise since mid-May. Defence stocks +0.8% on Russia's deadliest Ukraine strike this year.

Ethereum ETH

~$1,717

+7%. Reclaims $1,700 handle. Sharp reversal after weeks of underperformance vs BTC.

Litecoin LTC

~$42.26

+~2%. Riding broader risk-on wave.

Natural Gas

~$3.25

Testing Fibonacci resistance inside descending channel. $3.245-$3.285 key band. Neutral-to-bearish structure.

Germany 20Y Bund

~3.30%

Easing from near two-week high as US Treasury yields pull back on reduced Fed-hike expectations.


Thursday's 57,000 NFP miss against a 115,000 consensus, combined with downward revisions to April and May payrolls, has done what five straight Nasdaq losing sessions and four straight gold weekly declines could not: it has cleanly broken the dollar's grip on European markets. The DXY has slipped to around 100.8, on track...


Continue reading...
0
0

Retail Sales in Italy Rose by 0.2% in May: Numbers That Say Nothing About Consumer Sentiment

Retail Sales in Italy Rose by 0.2% in May: Numbers That Say Nothing About Consumer Sentiment

Introduction: Italian Shopping That Neither Delights nor Alarms

Friday. Rome, Milan, Naples — Italians are opening their wallets slightly wider than in previous months. The National Institute of Statistics, ISTAT, has published retail sales data for May, and the figures look... rather dull. Sales rose by 0.2% compared with April, when the indicator did not change at all. In annual terms, growth was 2.2%, slightly better than the revised April increase of 1.7%.

For the eurozone’s third-largest economy, this is neither a victory nor a defeat. It is more of a confirmation that the Italian consumer continues to spend, but without enthusiasm, without excitement, and without the confidence that drove markets in pre-COVID times.

Sales of food products increased by 0.2% month-on-month. Non-food goods also rose by 0.2%. Everything is even, everything is predictable, everything is within the margin of statistical error. Inflation in Italy, measured by the Harmonised Index of Consumer Prices, stands at 3.2% year-on-year. In other words, real sales growth, if inflation is deducted, is almost zero.

But let’s not rush to conclusions. Behind these dry figures lie many nuances: seasonal factors, regional differences, and consumer behavior patterns. And most importantly, the question of what these numbers say about the overall state of the Italian economy. Because retail sales are not just statistics — they are a mirror of consumer confidence, and consumer confidence is the engine of economic growth.

Let’s dig deeper. What really stands behind the 0.2% increase? Why is Italy, a country that has survived more than one crisis, now showing such sluggish momentum? And what does this mean for the future of the eurozone economy as a whole?

Figures and Context: What ISTAT Says

May vs. April: Stability Without Momentum

Let’s start with the most obvious point. Retail sales in Italy rose by...

Continue reading...
0
0

Kospi Rockets Past 6%, Yen Slides to a 40-Year Low, Gold Nears $4,200 as Asia Extends the Post-Payrolls Rally

Kospi Rockets Past 6%, Yen Slides to a 40-Year Low, Gold Nears $4,200 as Asia Extends the Post-Payrolls Rally

June NFP: 57,000 vs 115,000 consensus. Unemployment 4.2% (expected 4.3%). Fed September hike odds: 45-53%, from 65-67%. Dow Jones record close 52,900.07, +594.83 pts (+1.14%). Nasdaq -0.8%. S&P flat. US markets closed Friday for Independence Day. Yen at 40-year low 161.35. Kospi +6% intraday, triggers 'sidecar' halt.

57,000  June NFP  vs 115,000 consensus -- roughly half the forecast -- unemployment 4.2% vs 4.3% expected

52,900.07  Dow Jones close  +594.83 pts (+1.14%) -- fresh record high Thursday

45-53%  Sept hike odds  down from 65-67% before the payrolls report (CME FedWatch)


Thursday's NFP printed 57,000 against a 115,000 consensus -- roughly half of what the market expected. The unemployment rate came in at 4.2% against a 4.3% forecast, providing a modest offset that the market read as labour-market cooling rather than genuine downturn. Fed funds futures now imply a September hike probability of 45 to 53%, sharply down from 65 to 67% before the report. The combination produced a Dow Jones record close at 52,900.07, up 594.83 points, a 1.14% gain. The Nasdaq fell 0.8% and the S&P 500 finished essentially flat, underscoring a rotation away from megacap technology names even as the broader risk-on tone carried into Asia.

Friday's Asian session is the post-payrolls reaction carrying through a full trading day with US markets completely absent. South Korea's Kospi is the standout: reversing an early dip to surge more than 6% intraday and triggering a trading 'sidecar' halt as SK Hynix and Samsung Electronics both rallied more than 8% on renewed AI-chip demand optimism. This is a sharp turnaround after the index's roughly 8% slump earlier in the week. The USD/JPY intervention story is simultaneously live: the pair is holding above 161.00 but capped below 161.50, within a 161.00-161.74 day range, as Japan's Finance Minister Katayama repeats...

Continue reading...
0
0
Tom Maffin

WTI Oil Rises in Asian Trading: Is There Life Above $69?

WTI Oil Rises in Asian Trading: Is There Life Above $69?

Introduction: A Friday Morning That Started in the Green

Friday. Morning in Asia. Traders in Singapore, Tokyo, and Shanghai open their terminals and see a pleasant picture: WTI crude is back in the green. Futures for August delivery are rising to $69.11 per barrel, gaining 0.61% compared with the previous session’s close. Yes, the increase is not breathtaking, but after several weeks of volatility and declines, even such a modest gain feels like a breath of fresh air.

What is behind this movement? Over the past few weeks, the oil market has looked like a roller coaster: news from Iran, hawkish rhetoric from the Fed, inventory data, dollar fluctuations — all of this created chaos in which traders lost their bearings. But today, on this Friday, oil has found the strength to move higher.

Resistance is located at $71.60 per barrel. Support is at $67.05. The main battle is taking place between these two levels. And while the price remains closer to the lower boundary than the upper one, it is too early to speak of a trend reversal. Still, any upward movement, even 0.6%, gives hope to those who believe in a recovery in the oil market.

Interestingly, WTI’s rise is accompanied by a similar move in Brent. September Brent crude futures rose by 0.72% to $72.32 per barrel. The spread between Brent and WTI is $3.21 per barrel, which is within the normal historical range. The markets are moving in sync, suggesting that the growth factors are global rather than local.

So what exactly is pushing oil higher this Friday morning? Let’s take a closer look.

Macroeconomic Background: A Weak Dollar, Strong Oil

The Dollar Index Falls — Oil Gets Support

One of the classic factors influencing oil prices is the exchange rate of the dollar. Oil is...

Continue reading...
0
0

Eurobond Yields Rise amid Hawkish Rhetoric in Sintra

Eurobond Yields Rise amid Hawkish Rhetoric in Sintra

Introduction: The Portuguese Coast Where Hopes Break Apart

The coast of Sintra, with its fairy-tale palaces and sweeping ocean views, has always seemed like a place for inspiration and romance. But these days, the Portuguese city has turned into the epicenter of a harsh financial reality. The European Central Bank’s annual forum, which brings together the world’s leading central bankers, has this year become not merely a platform for exchanging views, but a battlefield for investors’ expectations.

The outcome of the two-day debate came as a surprise to those accustomed to soft wording and cautious signals. The hawkish rhetoric voiced by Federal Reserve Chair Kevin Warsh and ECB President Christine Lagarde immediately reverberated across sovereign debt markets. The yield on benchmark 10-year German bonds, which had recently been falling toward multi-month lows, reversed course and began climbing toward 2.95%.

All of this is happening at a time when inflation risks appeared to be receding. Oil has fallen to levels not seen since before the start of geopolitical turmoil, global supply chains are normalizing, and the eurozone economy is sending mixed signals. But the central bankers gathered on the Atlantic coast made one thing clear: the party is over. Inflation has not yet been defeated, and rate cuts are not a matter for the coming months.

Investors who had already begun pricing in imminent policy easing found themselves confused. Their expectations crashed against the firm statements made in Sintra just as Atlantic waves crash against the cliffs of Cabo da Roca. Bond markets are now undergoing a painful repricing.

What did Warsh and Lagarde actually say? Why have Eurobonds, which had protected capital during periods of uncertainty, begun to lose ground? And how will this shift affect the eurozone economy in the coming months? Let’s take a closer look.

Sintra 2026:...

Continue reading...
0
0
Tom Maffin

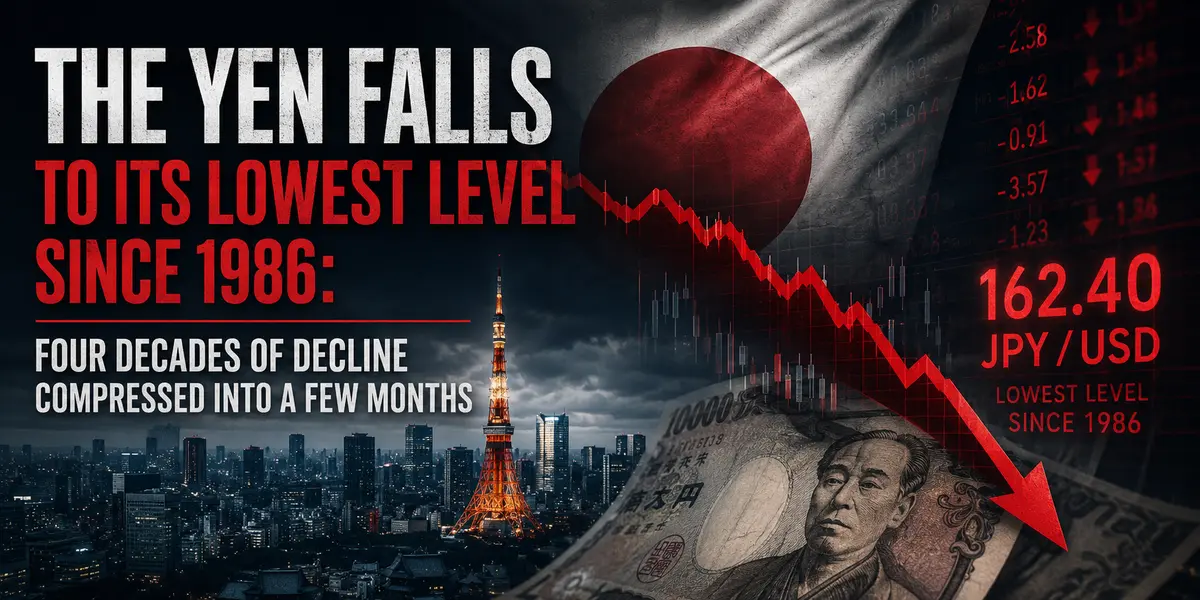
The Yen Falls to Its Lowest Level Since 1986: Four Decades of Decline Compressed Into a Few Months

The Yen Falls to Its Lowest Level Since 1986: Four Decades of Decline Compressed Into a Few Months

Introduction: The Day the Clock Turned Back

Tuesday began in Asia like any other trading day. Exchanges opened, traders took their seats, and price charts lit up across countless screens. But what happened next made many market participants rub their eyes in disbelief.

The Japanese yen, the national currency of the world's third-largest economy, plunged to a level that none of today's active market participants had ever witnessed. 162.40 yen per U.S. dollar. The last time the exchange rate reached this level was in 1986.

For those born after the fall of the Berlin Wall, 1986 is little more than a line in a history textbook. For currency traders who have spent three decades in the market, however, it marks a moment when every familiar reference point suddenly disappears. Once regarded as a symbol of Japan's economic strength, the yen has increasingly become a currency investors are eager to sell whenever the opportunity arises.

Chief Cabinet Secretary Minoru Kihara and Finance Minister Satsuki Katayama responded with the government's familiar verbal warnings. The market barely reacted. Because words are just words. Markets respond to numbers, and the numbers tell a clear story: the Japanese currency has been in freefall for months, and nothing so far has managed to stop it.

Last year, the Japanese government spent a record $72 billion on currency interventions. The Bank of Japan raised its policy rate to 1%, the highest level in three decades. Yet all of those efforts proved to be little more than a drop in the ocean.

Let's examine why the yen continues to weaken, what this means for Japan's economy, and whether a reversal of the trend is possible—or even likely.

The Mechanics of the Decline: Why the Yen Can't Stop Falling

Carry Trade: The Yen's Biggest Enemy

To understand...

Continue reading...
0
0

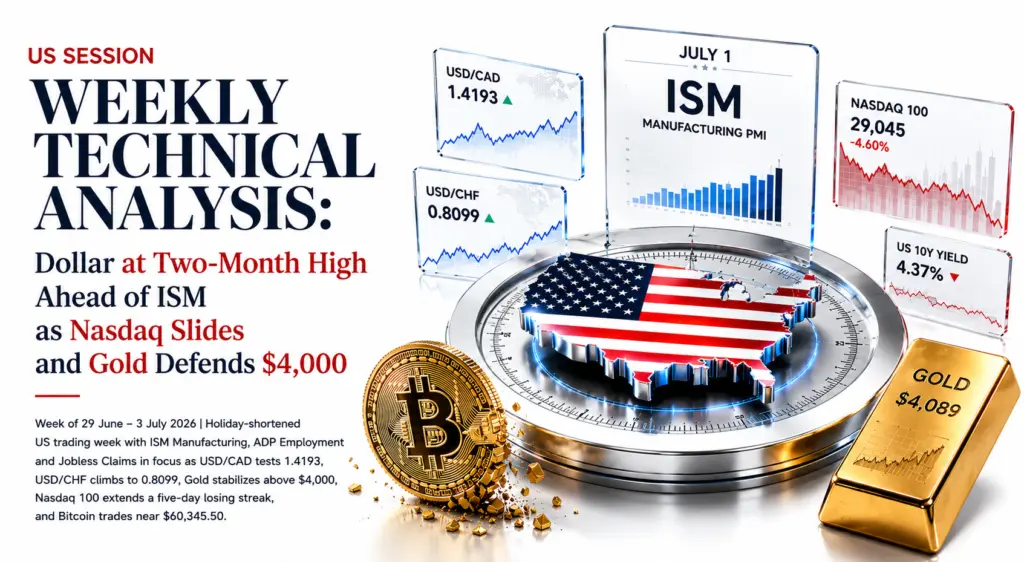
US Session Weekly | 29 June–3 July 2026 | Holiday-Shortened Week Dollar Hits Two-Month High. Nasdaq 100 Five-Day Losing Streak. Bitcoin at $60,345.50. ISM Manufacturing Is the Week’s Decisive Catalyst

US Session Weekly | 29 June–3 July 2026 | Holiday-Shortened Week Dollar Hits Two-Month High. Nasdaq 100 Five-Day Losing Streak. Bitcoin at $60,345.50. ISM Manufacturing Is the Week’s Decisive Catalyst

DXY above 100 for first time since May 2025. USD/CAD 1.4193 -- best since late January. USD/CHF 0.8099. Gold $4,089 after fourth consecutive weekly decline, briefly sub-$4,000. Nasdaq 100 -4.60% on five-day losing streak from June 3 record near 30,762. US 10Y 4.37% (-7bps). BTC $60,345.50 -- lowest since late 2024. ADA $0.146 multi-year lows. US markets closed Friday.


LEVEL

HEADING INTO THE WEEK

USD/CAD

1.4193

Five-month high (best since late Jan). Dollar + deteriorating Canadian growth + gold pullback. ISM Tue + NFP Thu are the gates.

USD/CHF

0.8099

DXY above 100 first time since May 2025. CHF safe-haven demand outweighed by greenback rally.

Gold XAU

$4,089

Fourth consecutive weekly decline. Briefly sub-$4,000 before Friday PCE bounce reclaimed $4K. $3,800-$3,900 structural floor.

Wheat CBOT

588.45c

Eased from 3-week high. Hormuz freight premium easing + improving US harvest + Black Sea conditions.

Nasdaq 100

29,045

-4.60%. Five-day losing streak from June 3 record near 30,762. Chip rout + delayed AI IPO headlines drove the fall.

US 10Y Yield

4.37%

-7bps. Seven-week low. In-line PCE trimmed (not eliminated) multiple-hike bets. Core PCE held at 3.4%.

Bitcoin BTC

$60,345.50

Lowest since late 2024. Spot ETF outflows accelerated. Capital rotating to defensive equity + AI infrastructure.

Cardano ADA

$0.146

Multi-year lows. Amplified BTC breakdown on smaller cap + thinner institutional liquidity.


A hawkish-priced dollar and a five-day Nasdaq losing streak. Does ISM Manufacturing on Tuesday deliver the reprieve, or does a holiday-shortened week with Friday closure deliver thinner liquidity and sharper moves?

USD/CAD at 1.4193: The Most Consequential North American Pair

USD/CAD at 1.4193 is the most consequential North American pair for the week. The loonie's slide to a five-month high in USD/CAD terms -- its best level since late January -- reflects a combination of broad-based dollar strength and a...

Continue reading...
0
0

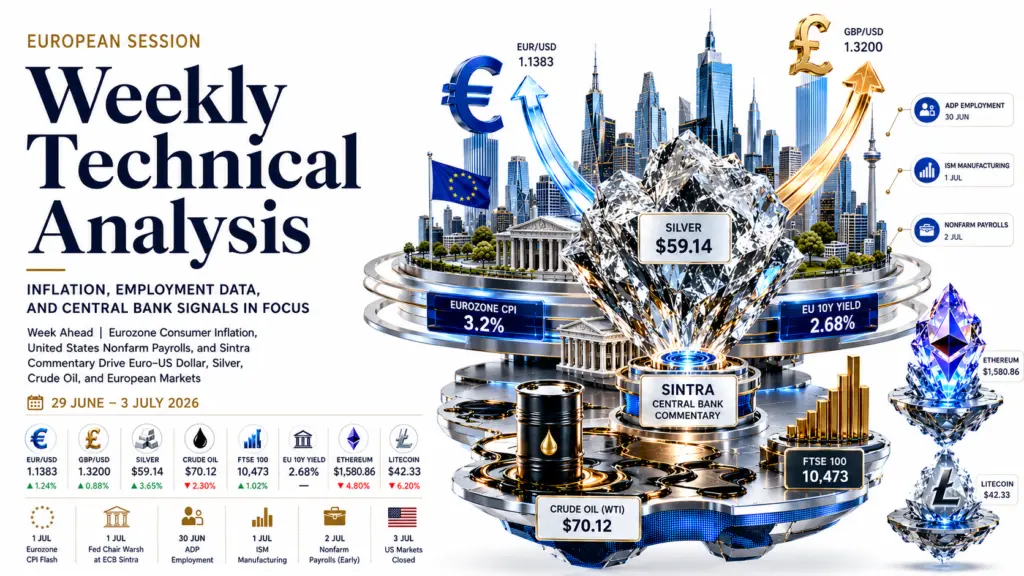
European Markets Weekly | 29 June–3 July 2026 Eurozone CPI Hits 3.2%. Nonfarm Payrolls Thursday. Warsh Speaks at Sintra Tuesday. EUR/USD Holds 1.1383 as Silver Breaks $59

European Markets Weekly | 29 June–3 July 2026 Eurozone CPI Hits 3.2%. Nonfarm Payrolls Thursday. Warsh Speaks at Sintra Tuesday. EUR/USD Holds 1.1383 as Silver Breaks $59

Holiday-shortened US week. EUR/USD 1.1383 -- strongest since late 2024. Silver $59.14. FTSE 100 at record 10,473. WTI $70.12. EU 10Y 2.68% stable. ETH $1,581 in Extreme Fear. LTC $42.48. Eurozone CPI Tuesday, ISM Manufacturing Tuesday, Warsh at Sintra Tuesday, ADP Wednesday, NFP Thursday.


LEVEL

HEADING INTO THE WEEK

EUR/USD

1.1383

Strongest since late 2024. Dollar softness, not ECB hawkishness, drove the move. Eurozone CPI Tuesday + Warsh Sintra = the twin gates.

GBP/USD

1.3200

Psychological pivot. Sterling benefited from dollar weakness + resilient UK services. GDP revision this week.

Silver XAG

$59.14

Multi-year high. Weaker dollar + green-energy demand signals. $59 is the intraweek pivot for continuation or reversal.

Crude Oil WTI

$70.12

OPEC+ supply-increase signals + soft Chinese demand. $70 structurally critical; break below opens mid-$60s.

FTSE 100

10,473

Record territory. Financials and consumer staples led. Energy lagged on crude weakness.

EU 10Y Yield

2.68%

Stable. Dollar weakness + soft US data offset French political noise. Eurozone CPI Tuesday is the next catalyst.

Ethereum ETH

$1,580.86

Extreme Fear. Tracking crypto-specific fear cycle, not macro risk-on. $1,500 demand shelf is structural anchor.

Litecoin LTC

$42.33

Broke below $45 support. Halving narrative is primary fundamental floor. $40 shelf = next accumulation zone.


EUR/USD at 1.1383: Dollar Weakness, Not ECB Strength

EUR/USD at 1.1383 is the most consequential European pair for the week, and the distinction between what drove it here and what can sustain it is analytically important. The pair's advance through 1.13 to its strongest level since late 2024 was driven by broad dollar softness -- soft US data reducing Fed tightening urgency -- not ECB hawkishness. That distinction matters because it creates a different set of conditions for how the pair behaves this week.

The dollar softness that drove EUR/USD to 1.1383 was itself a function...

Continue reading...
0
0

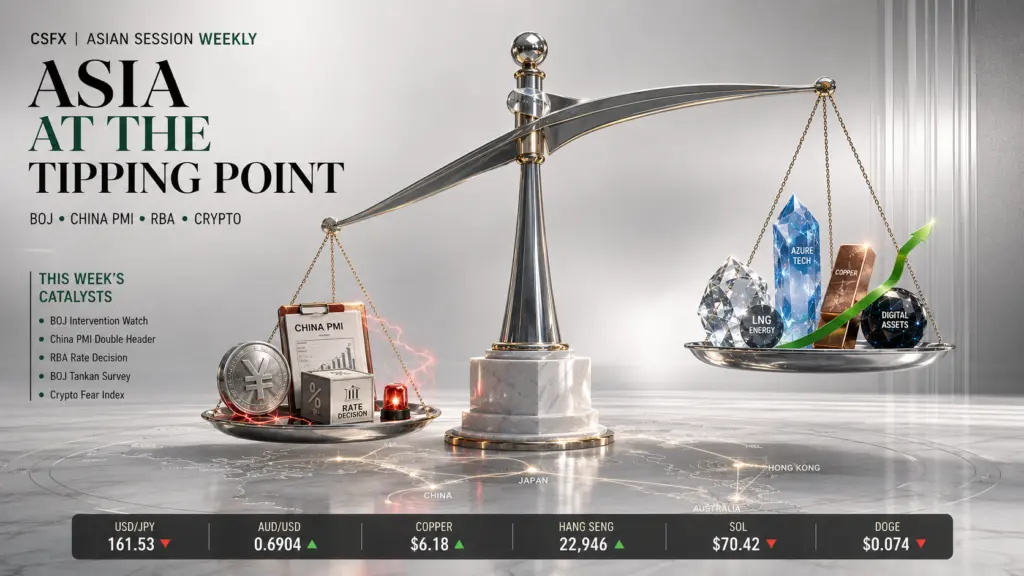
Asia-Pacific Weekly | 29 June–4 July 2026 BoJ Intervention Watch as USD/JPY Tests 162. China PMIs and the RBA Decision Steer Asian Risk. Crypto Braces for Extreme Fear

Asia-Pacific Weekly | 29 June–4 July 2026 BoJ Intervention Watch as USD/JPY Tests 162. China PMIs and the RBA Decision Steer Asian Risk. Crypto Braces for Extreme Fear

USD/JPY 161.53 pressing 52-week high of 161.95. China NBS and Caixin PMIs Monday. RBA rate decision Wednesday. BoJ Tankan Survey Tuesday. Solana post-unlock stabilising at $70.42. DOGE broke below the $0.085 demand zone at $0.074. Fear & Greed at 12 -- Extreme Fear.


LEVEL

HEADING INTO THE WEEK

USD/JPY

161.53

13-month high, pressing 52-week high 161.95. Intervention zone active. Tokyo CPI 1.7% adds BoJ hike urgency.

AUD/USD

0.6904

Weighed by dollar strength and soft China demand. RBA decision Wednesday is the directional gate.

Copper (HG)

$6.18

Eased on hawkish-Fed dollar bid. Renewables and electronics demand steady. Traditional Chinese demand soft.

Natural Gas

$3.28

+5.67% on the month. Above-average temperatures through early July. Record LNG feedgas at Golden Pass.

Hang Seng

22,946

Strong Sell technical reading. Near bottom of 22,485-28,056 yearly range. 52-week low risk active.

Nikkei 225

~69,683

Weak yen flattering large-cap exporters. Gains thin as intervention chatter builds.

Solana (SOL)

$70.42

Stabilising near $70 after June 624,666-token unlock. Fear & Greed at 12 (Extreme Fear). $66 support.

Dogecoin (DOGE)

$0.074

Broke below $0.085 demand zone. -14.35%. Steadier short-term MA structure the only technical support.


USD/JPY at 161.53: The Single Most Important Pair of the Week

USD/JPY at 161.53 is the single most important pair for the Asian session this week. The pair's grind to a fresh 13-month high is driven almost entirely by the dollar side: the Fed's hawkish hold under Chair Warsh, with nine of nineteen policymakers projecting at least one additional 2026 hike, has kept the DXY near a 13-month high and the US-Japan rate gap at 250 to 275 basis points. The BoJ hiked to 1.00% on June 19 -- the first time at that level since 1995 -- and Tokyo's June CPI accelerated to 1.7% headline and 1.6% core, giving the BoJ an...

Continue reading...
0
0

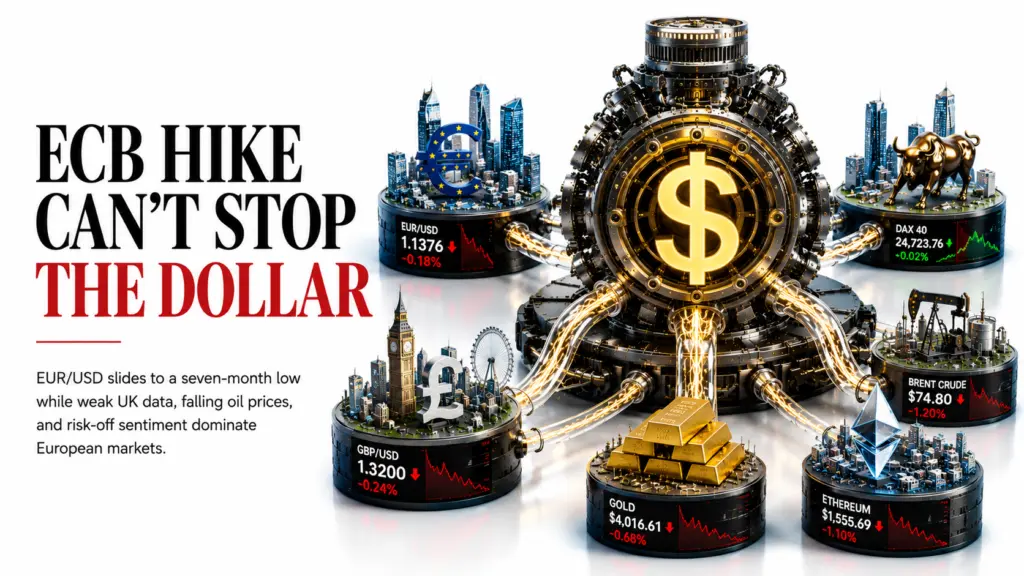
European Session | Friday 26 June 2026 Dollar Dominance and ECB Hike Bets Squeeze EUR/USD as Sterling Buckles Under a 14-Month PMI Low

European Session | Friday 26 June 2026 Dollar Dominance and ECB Hike Bets Squeeze EUR/USD as Sterling Buckles Under a 14-Month PMI Low

A dollar that will not relent. A sterling that cannot defend. A crude market on track for a third straight decline. And Frankfurt finding a rare bright spot in Bayer's courtroom victory. The defining variable is the same as it has been all week: the Fed-ECB rate gap, and whether 3.4% US Core PCE has permanently pushed the first Fed cut off the table.

Friday's European open inherits a complex macro backdrop from the Asian session. The US dollar index remains pinned near a 13-month high after Thursday's hot Core PCE print of 3.4% year-on-year locked in Fed higher-for-longer expectations. That print, combined with the Q1 GDP revision to 2.1%, has reduced Fed September cut probability to near zero and raised September hike probability to approximately 63%. Against that dollar backdrop, EUR/USD has drifted to 1.1376 -- near a seven-month low -- even as ECB hike probability for September sits at roughly 50% and should be providing structural EUR support. The Fed is simply winning the narrative battle.

The session's domestic European catalyst is negative: the UK composite PMI printed 49.4 in June, a 14-month low below the 50 expansion threshold. Combined with Prime Minister Starmer's resignation and the political uncertainty of the Burnham succession, sterling has no support mechanism today. GBP/USD at 1.3200 is a seven-month low. EUR/GBP has been stable, which tells you the market is selling GBP specifically rather than buying EUR -- the political discount is doing real currency damage that a rate story alone would not produce.

EUR/USD at 1.1376: The ECB Hike That Cannot Beat the Dollar

EUR/USD at 1.1376 should, in a purely rate-differential framework, be meaningfully higher. The ECB raised its deposit rate to 2.25% on June 11 -- the first hike since 2023 -- and September hike probability is now priced...

Continue reading...
0
0
Navigation menu
instaforex banner